Article Text

Abstract
Objective Visually estimated coronary artery calcium (VECAC) from chest CT or attenuation correction (AC)/CT obtained during positron emission tomography (PET)–myocardial perfusion imaging (MPI) is feasible. Our aim was to determine the prognostic value of VECAC beyond conventional risk factors and PET imaging parameters, including coronary flow reserve (CFR).
Methods We analysed 608 patients without known coronary artery disease who underwent PET–MPI between 2012 and 2016 and had AC/CT and/or chest CT images. We used Cox regression to estimate the association of VECAC categories (≤10, 11–400, >400 Agatston units (AU)) with the primary outcome of all-cause death, acute coronary syndrome or stroke (mean follow-up 4.3±1.8 years). C-statistics assessed the relationship between PET parameters and VECAC with the primary outcome.
Results Mean age was 58±11 years, 65% were women and 67% were black. VECAC ≤10, 11–400 and >400 AU was observed in 68%, 12% and 20% of subjects, respectively. Compared with VECAC ≤10, VECAC categories 11–400 (HR 2.25, 95% CI 1.24 to 4.08) and >400 AU (HR 3.05, 95% CI 1.87 to 4.98) were associated with the primary outcome after adjusting for traditional risk factors, MPI findings and CFR. Adding VECAC to a model that included PET–MPI, CFR and clinical risk factors improved the prognostic value for the primary outcomes (c-statistic 0.71 to 0.75 with VECAC, p=0.01).
Conclusions VECAC is a potent predictor of events beyond traditional risk factors and PET imaging markers, including CFR. These data further support the importance for routine VECAC implementation.
- coronary artery disease
- positron emission tomography computed tomography
- outcome assessment
- health care
Data availability statement
Data are available on reasonable request.
This is an open access article distributed in accordance with the Creative Commons Attribution Non Commercial (CC BY-NC 4.0) license, which permits others to distribute, remix, adapt, build upon this work non-commercially, and license their derivative works on different terms, provided the original work is properly cited, appropriate credit is given, any changes made indicated, and the use is non-commercial. See: http://creativecommons.org/licenses/by-nc/4.0/.
Statistics from Altmetric.com
- coronary artery disease
- positron emission tomography computed tomography
- outcome assessment
- health care
Key questions
What is already known about this subject?
Visually estimated coronary artery calcium (VECAC) on CT is a well-validated tool with proven prognostic value in multiple cohorts.
What does this study add?
It was unknown whether VECAC could enhance risk stratification beyond traditional imaging risk markers, such as coronary flow reserve, abnormal myocardial perfusion and left ventricular ejection fraction. We found that VECAC was the strongest predictor of clinical outcomes among patients undergoing cardiac positron emission tomography imaging.
How might this impact on clinical practice?
VECAC is a simple, readily available, reliable and potent prognostically relevant marker and should be implemented routinely in clinical reports of patients undergoing myocardial perfusion imaging.
Introduction
Coronary artery calcium (CAC) is one of the strongest tools available in identifying individuals at high risk of major cardiovascular events in the contemporary era,1 2 leading to its incorporation into guideline recommendations for primary prevention risk assessment.3 4 Dedicated CAC imaging typically employs electrocardiographically (ECG) gated multidetector row cardiac CT during a breath hold.5 However, myocardial perfusion imaging (MPI) techniques, such as positron emission tomography (PET), routinely obtain non-gated, low-dose CT scanning for attenuation correction (AC). Moreover, diagnostic-quality non-gated, chest CT scans are also commonly available in clinical practice, providing an opportunity to visually estimate (VE) CAC score from readily available imaging.
Clinical limitations to quantifying CAC from non-dedicated, non-gated scans include different protocol acquisition and reconstruction protocols compared with standard CAC scans, motion artefact during spontaneous breathing and the additional burden placed on clinical throughput. Yet, VECAC is reproducible and demonstrates remarkable agreement with CAC score acquired from ECG-gated CT scans.6 Given that semi-quantitative reporting of CAC in all non-gated, non-contrast chest CT scans is recommended by professional society guidelines,7 VECAC may be a valuable and easily implementable clinical tool. However, the prognostic significance of VECAC have yet to be demonstrated among patients undergoing quantitative myocardial perfusion PET imaging.
We sought to determine whether VECAC assessment obtained from routine CT during PET provides effective risk stratification and predicts major adverse cardiovascular events beyond traditional clinical risk factors and data obtained from MPI, including coronary flow reserve (CFR). Secondarily, we evaluated the impact of incorporating VECAC assessment on subsequent identification of aspirin and statin treatment eligibility among patients with normal MPI, who would not have come to clinical attention otherwise.
Methods
Study design
We retrospectively analysed data from patients undergoing hybrid cardiac PET/CT Rubidium-82 (82Rb) MPI at the Hospital of the University of Pennsylvania, an urban tertiary care centre, from March 2012 to March 2015 (n=1270). We excluded patients with (1) unavailable CT images (n=430), (2) known coronary artery disease (n=153), (3) history of heart transplantation (n=36), (4) incomplete PET datasets (n=7) and (5) no follow-up (n=36), for a final study cohort of 608 individuals. Informed consent was waived for this retrospective study using data from the electronic health record. Description on data collection and outcomes are available in online supplemental file.
Supplemental material
PET protocol
Patients underwent a rest-dipyridamole stress 82Rb cardiac PET using a PET/CT scanner (Biograph mCT; Siemens Healthineers, Malvern, PA).8 Low-dose CT images were acquired for photon AC prior to emission scans. AC/CT scans were performed during free breathing and without ECG gating, using a spiral mode with pitch 0.8, collimation 32×1.2 mm, rotation 0.5 s, medium-smooth (B30f) kernels, 3 mm thick slices, 2 mm increment, tube voltage 120 kVp and effective mAs 13. Subsequently, the rest of the PET images were obtained with a 6 min list-mode dynamic PET acquisition imaging while ~30 mCi of 82Rb was injected intravenously as a fast bolus. Dipyridamole (0.56 mg/kg) was then administered, and 3 min after completion of dipyridamole infusion, dynamic PET imaging was repeated with an additional ~30 mCi of 82Rb. Iterative reconstruction was performed with two iterations and matrix size 128×128.
Abnormal myocardial perfusion was defined as a summed stress score equal to or greater than 2. Coronary flow reserve (CFR) was calculated semiautomatically using commercially available software (Syngo MBF; Siemens Healthineers). In brief, this software uses data from the list-mode acquisition to determine time–activity curves for blood pool and myocardium. The data are then fit into a one-compartment model of 82Rb kinetics with a non-linear extraction curve to calculate myocardial blood flow.9 CFR was defined as the ratio of hyperemic to resting myocardial blood flow. Patients were divided into three groups based on CFR results: (1) severely reduced (CFR <1.5); (2) mild-to-moderately reduced (CFR 1.5–1.99); 3) preserved (CFR ≥2.0).
Visual estimation of coronary artery calcium score
VECAC was carried out by reviewing the AC/CT performed during the index hybrid PET and/or if available any diagnostic chest CT images that were obtained within 12 months from PET (n=284, median time 43 days (IQR 1–179)). Then, using a routine PACS viewer (Uniview; Sectra, Inc., Shelton, CT), one trained physician-reviewer blinded to all other clinical data classified all CT images using previously established categories as following: (1) VECAC <10 (corresponding to minimal plaque burden), (2) VECAC 11–400 (encompassing mild to moderate plaque burden) and (3) VECAC >400 (defining large plaque burden) Agatston units (AU).6 When both CT scans were available, priority was given to chest CT images due to its higher image quality, and the fact that they are acquired with breath-holding, further reducing image blurring (online supplemental figures 1,2). VECAC was estimated from 284 (47%) diagnostic chest CT scans. We validated VECAC assessment in separate cohorts from the main analysis (see online supplemental file).
Patient and public involvement statement
It was not appropriate or possible to involve patients or the public in the design, or conduct, or reporting, or dissemination plans of our research.
Statistical analysis
Baseline characteristics grouped by VECAC categories (≤10, 11–400 and >400 AU) were described using means±SD and medians and 25th–75th percentiles or percentages as appropriate for the levels of measurement and distributions of the variables. VECAC groups were compared using ANOVA for continuous variables (or non-parametric equivalent when appropriate) and χ2 tests (or Fisher’s exact test when appropriate) for categorical variables. P values for trend are displayed.
The association between baseline VECAC categories and the primary, composite outcome was assessed using crude and multivariable Cox regression. Patients undergoing early revascularisation (within 90 days from PET) were censored because they could have a significant impact on the outcome analyses. We tested the interactions of VECAC categories with CFR (as a continuous variable), VECAC source (diagnostic chest CT or AC/CT during PET), race and sex for the primary outcome using crude analysis. Multivariable models first adjusted for clinical risk factors included in the pooled cohort equation (age, sex, race, history of hyperlipidaemia, systolic blood pressure, heart rate, history of diabetes mellitus, current smoking and use of blood pressure medication).3 We substituted history of hyperlipidaemia for high-density lipoprotein cholesterol and total cholesterol, since these values were missing in 341/608 participants. In a second model, we additionally adjusted for abnormal MPI on PET imaging (fixed or reversible defect) and coronary flow reserve. Because CFR is a strong predictor of adverse events,10 we assessed for an interaction between VECAC and CFR for the composite outcome.
In a sensitivity analysis, we performed multiple imputation analyses for missing model covariates using the Markov chain Monte Carlo method to impute missing cholesterol values. We imputed all missing data using 10 sets of values using non-missing predictors and ultimately pooled to obtain a single set of inferential values.
We generated receiver operating characteristic curves of clinical and imaging predictors for the primary composite outcome. To assess the utility of VECAC scores beyond clinical risk factors and standard imaging data from PET in predicting the composite outcome, we computed area under the receiver operating characteristics curve using sequential models to compare net model improvement.
Analyses were performed using STATA V.14 (STATA Corp, College Station, TX), and a two-sided p value <0.05 was considered statistically significant.
Results
Baseline characteristics
The baseline characteristics of the 608 participants meeting study inclusion criteria stratified by VECAC category are shown in table 1. VECAC ≤10, 11–400 and >400 AU was observed in 68%, 12% and 20% of subjects, respectively. The average age of the entire cohort was 58±11 years, 65% were women and 67% were black. Comorbidities (hypertension 83%, dyslipidaemia 62%, diabetes 42%, heart failure 20%, prior stroke 12%) were common. MPI was abnormal in 16% and CFR (2.17±0.79) was generally preserved. Higher VECAC was associated with older age, male sex, white race, higher systolic blood pressure and lower diastolic blood pressure, lower body mass index, as well as higher proportion of hyperlipidaemia and peripheral artery disease. Medication use reflected the increased prevalence of related comorbidities. Higher VECAC was also associated with lower left ventricular ejection fraction, CFR and greater proportion of abnormal MPI results.
Baseline clinical characteristics by visually estimated coronary artery calcium categories
Prognostic utility of VECAC
Over an average follow-up time of 4.3±1.8 years, there were 61 deaths, 20 acute coronary syndrome events and 29 strokes. Using VECAC <10 as the referent category, increasing VECAC category was associated with a significantly increased risk for the primary outcome on crude analysis in a dose-dependent fashion (figure 1, table 2). This relationship was not modified by CFR (p-interaction=0.99) or source of VECAC estimation (p-interaction=0.50). Likewise, there was no effect modification by black versus non-black race (p-interaction=0.49) or sex (p-interaction=0.77). Adjusting for clinical risk factors used in the Myed cohort equation and PET imaging markers (abnormal MPI, and CFR) attenuated, but failed to eliminate this relationship. Compared with VECAC ≤10, the fully adjusted HRs (95% CI) for VECAC 11–400 and >400 AU were 2.25 (1.24 to 4.08) and 3.05 (1.87 to 4.98), respectively. A sensitivity analysis using multiple imputation for missing covariates demonstrated similar findings (online supplemental table 2).
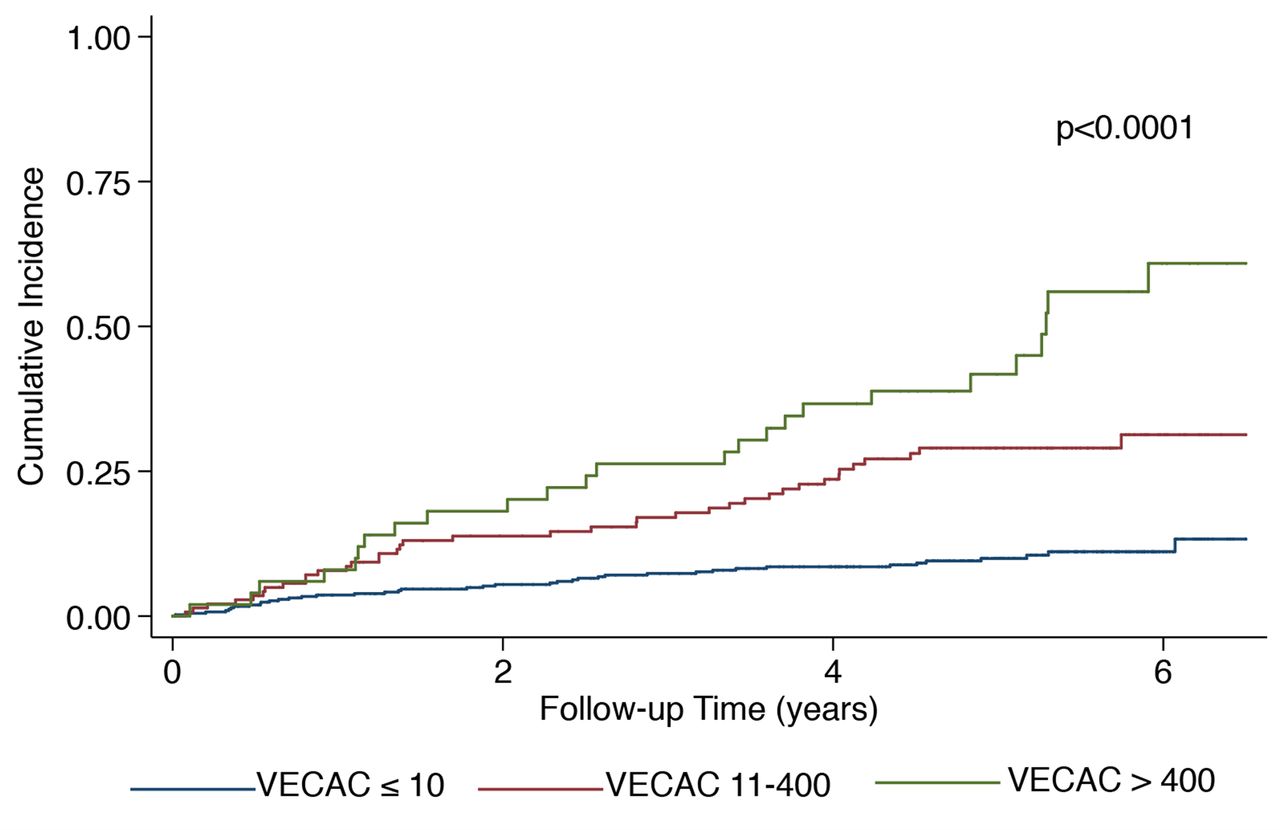
Cumulative incidence of major adverse cardiovascular events by visually estimated coronary artery calcium categories. Cumulative incidence for acute coronary syndrome, stroke and all-cause mortality by categories of VECAC. P value shown for log-rank test. VECAC, visually estimated coronary artery calcium.
Event rates and crude and adjusted HRs for the composite outcome by visually estimated coronary artery calcium
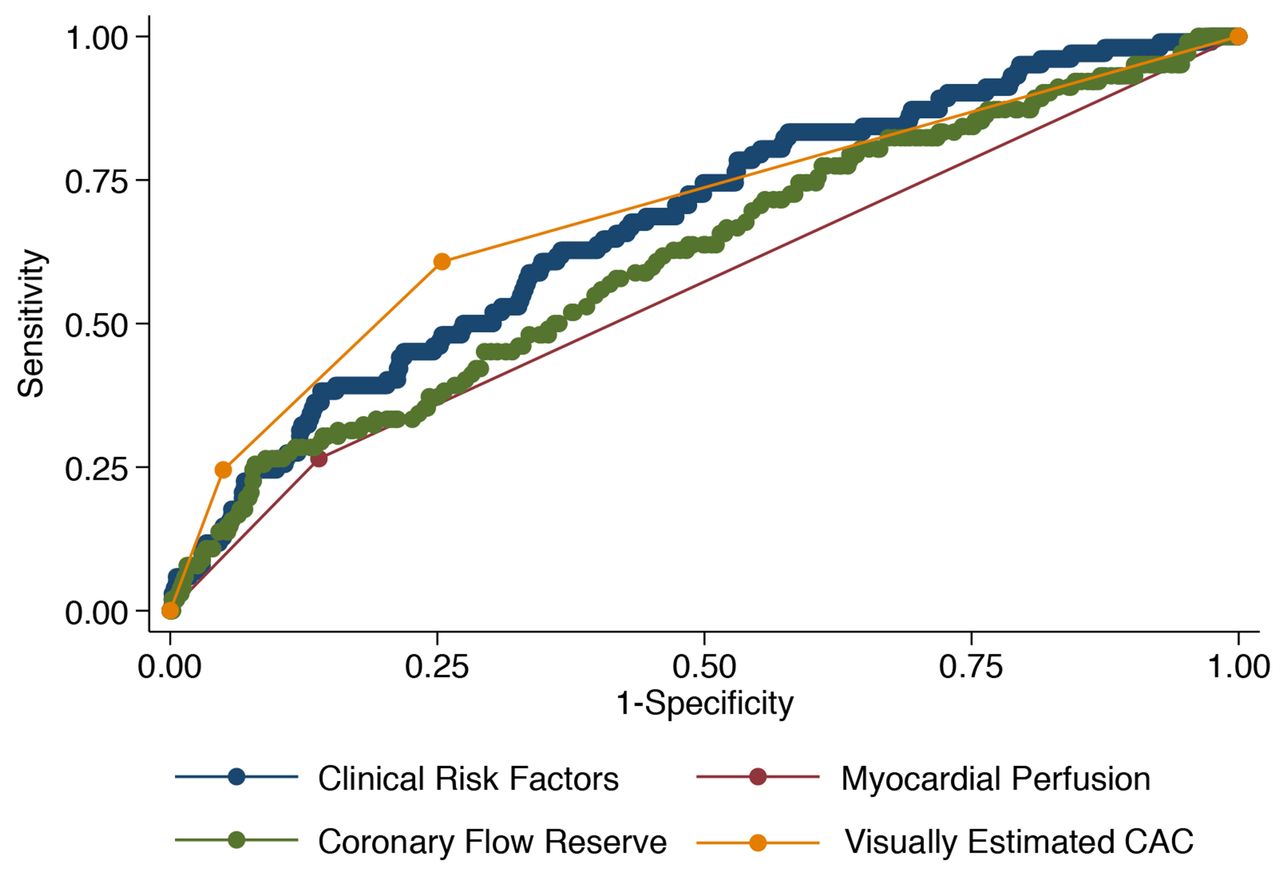
Figure 2 demonstrates using receiver operating characteristics curves of VECAC, clinical risk factors and PET imaging markers. VECAC (0.68, 95% CI 0.63 to 0.74) was superior to PET imaging markers MPI (0.56, 95% CI 0.52 to 0.61; p<0.001) and CFR (0.61, 95% CI 0.55 to 0.67; p=0.037) for predicting the primary outcome, and equivalent to the group of clinical risk factors that included the pooled cohort equations (0.67, 95% CI 0.62 to 0.73; p=0.53). A complementary analysis using c-statistics with sequential modelling is shown in online supplemental table 3. The area under the curve for clinical risk factors alone for the primary outcome had a c-statistic of 0.67 (95% CI 0.62 to 0.73). The sequential addition of PET imaging marker improved on the model (0.71, 95% CI 0.66 to 0.77, p=0.02). The final addition of VECAC further improved the model (0.75, 95% CI 0.70 to 0.80, p=0.01).

Receiver operating characteristic curves for predictors of major adverse cardiovascular events. Receiver operating characteristic curves depicted for clinical risk factors (from the pooled cohort equation), abnormal myocardial perfusion imaging (fixed or reversible defects), coronary flow reserve and VECAC. VECAC, visually estimated coronary artery calcium.
Prognostic interplay between VECAC and CFR
The annualised event rate increased with higher VECAC and lower CFR (figure 3). However, increasing VECAC estimates consistently identified higher-risk individuals across CFR subgroups, including in patients with preserved CFR (≥2.00), whereas lower VECAC estimates were generally associated with better outcomes even in the presence of severely reduced CFR (<1.5) (figure 3).
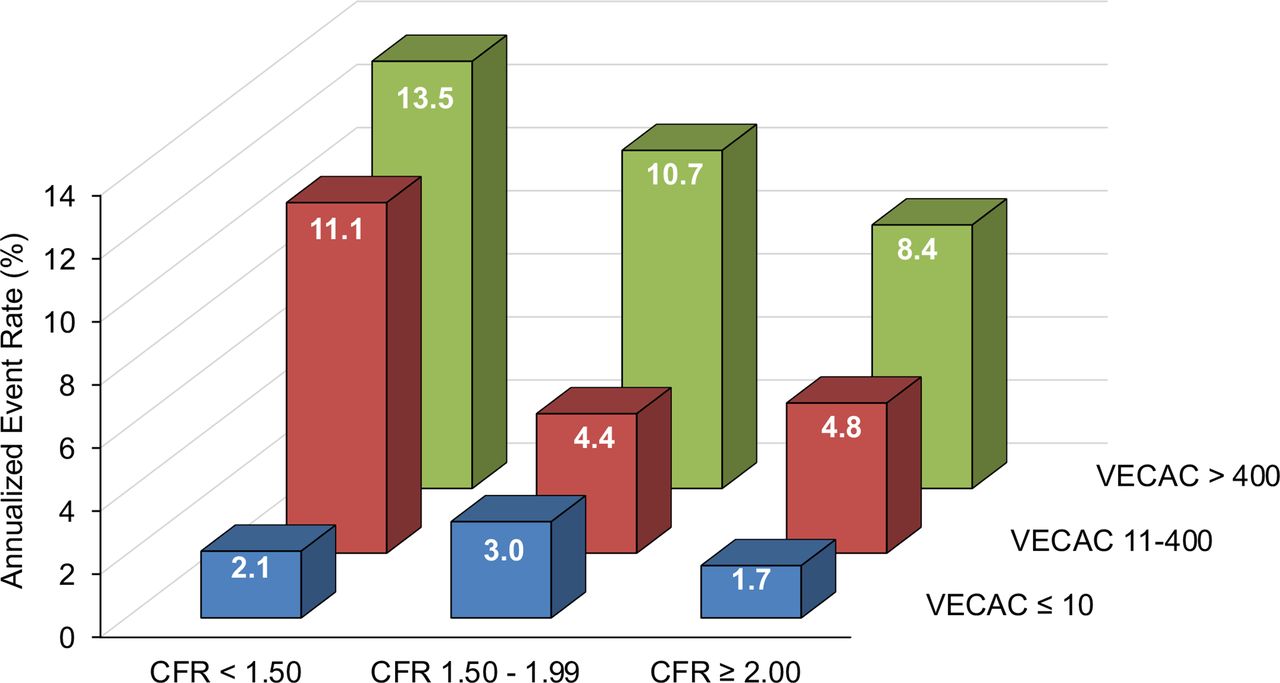
Annualised event rates of visually estimated coronary artery calcium (VECAC) categories stratified by coronary flow reserve groups. Increasing VECAC estimates consistently identified higher-risk individuals across coronary flow reserve groups, including patients with preserved microvascular function.
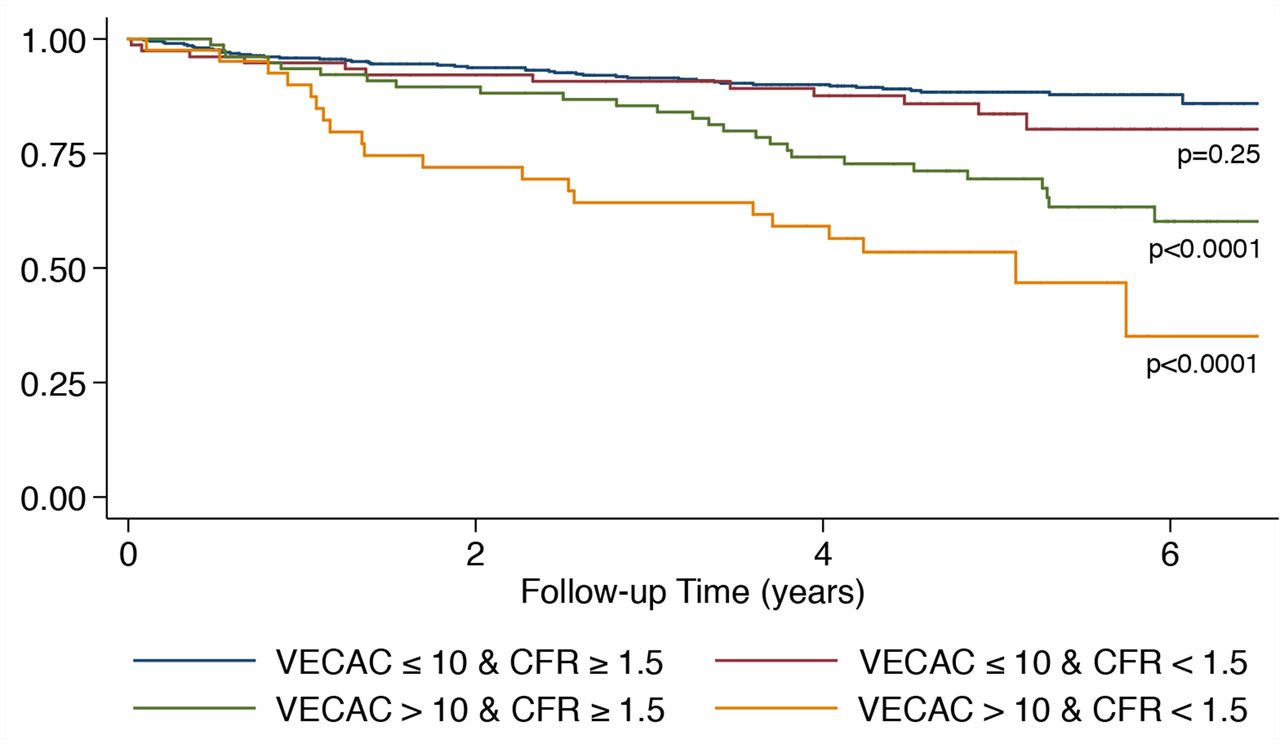
The combination of VECAC and CFR yielded the following subgroups (figure 4): (1) VECAC ≤10 and CFR ≥1.5 (minimal coronary plaque with non-severely reduced flow (reference group); n=413); (2) VECAC ≤10 and CFR <1.5 (minimal coronary plaque with severely reduced flow; n=77); (3) VECAC >10 and CFR ≥1.5 (evident coronary plaque with non-severely reduced flow; n=77); (4) VECAC >10 and CFR <1.5 (evident coronary plaque with severely reduced flow; n=41).

Event-free survival curves of the composite outcome according to visually estimated coronary artery calcium and coronary flow reserve categories. Risk increases with higher degrees of coronary plaque deposits and flow reserve impairment. CFR, coronary flow reserve; VECAC, visually estimated coronary artery calcium.
Compared with the reference group, patients with VECAC ≤10 and CFR <1.5 (HR 1.45 (95% CI 0.77 to 2.75); p=0.25) displayed a non-significant trend for higher risk, whereas patients with VECAC >10 and CFR ≥1.5 (HR 3.02 (95% CI 1.86 to 4.89); p<0.001) and VECAC >10 and CFR <1.5 (HR 5.61 (95% CI 3.31 to 9.52); p<0.0001) were at significantly greater risk for MACE (figure 4). Adjustments for clinical risk factors, MPI status and left ventricular ejection fraction did not change this relationship (online supplemental table 4).
Discussion
In a study of 608 patients referred for cardiac PET evaluation, we have found that VECAC from routinely obtained CT imaging was feasible, reliable and a powerful prognostic marker of adverse cardiovascular events. VECAC was robustly associated with the primary composite outcome even after adjustment for clinical variables included in the pooled cohort equation and routinely assessed PET imaging markers (including CFR). Indeed, VECAC improved risk stratification above and beyond these other highly prognostic markers. Further, the relationship of VECAC with adverse outcomes was not modified by CFR,8 10 suggesting these assessments are complementary.11 Finally, in cases where MPI imaging was normal, implementation of VECAC identified a substantial proportion of patients not on preventive therapies that would newly qualify for initiation. Our analyses demonstrate the strong clinical utility of VECAC and, given the ease and rapidity of estimation, suggest that VECAC should be routinely clinically implemented.
With training, VECAC can easily be assessed from available chest CT or AC/CT images and does not require dedicated software. Further, we demonstrated excellent agreement with dedicated CAC imaging comparable with previous estimates,6 and there was no significant effect modification by source of VECAC estimation (diagnostic chest CT or hybrid PET/CT) for the primary outcome. Our results are complementary to data showing the prognostic utility of VECAC in non-gated chest CTs obtained for lung cancer screening.12 These findings suggest that dedicated CAC imaging may not be an absolute requirement for the purposes of risk stratification. Moreover, although VECAC is already rapidly assessed, automated scoring algorithms on non-gated chest CT have also been recently developed, further supporting clinical applicability.13
Semiquantitative reporting of CAC from all non-contrast chest CT examinations is a class I professional society guideline recommendation,7 and VECAC assessment could thus play a pivotal part in this evaluation. While payer reimbursement is not widely available at this time for CAC assessment, our findings may support efforts to implement such a billing code by demonstrating its strong prognostic utility, ability to identify populations who may benefit from preventive therapies,14 and potentially decrease healthcare utilisation of separate, dedicated CAC scans.
CFR is a known robust marker of coronary microvascular disease and cardiovascular disease in general.8 10 15 Indeed, CFR in the lowest tertile compared with the highest tertile has been associated with >5-fold risk of major adverse cardiovascular events.10 It is thus remarkable that VECAC can significantly predict adverse events beyond CFR. In fact, in our study, VECAC was the strongest predictor of events and consistently modified the risk of individuals at different levels of CFR impairment (figures 3 and 4). For example, patients with preserved CFR (≥2.00) but large plaque burden (VECAC >400) had a higher observed annualised event rate compared with patients with severely reduced CFR (<1.50) but minimal plaque burden (VECAC ≤10) (figure 3).
This difference in outcomes is likely explained by the broad spectrum of phenotypes that can coexist between individuals with varying degrees of coronary microvascular dysfunction (as reflected by CFR) and coronary atherosclerosis severity (as estimated by VECAC), which can ultimately characterise or phenotype individuals according to CFR and coronary atherosclerosis status into different risk profiles. Consequently, it is clear that VECAC and CFR in combination can provide complementary and enhanced risk stratification, and therefore both assessments should be incorporated into clinical use where available.
There are some limitations of our study. Despite comprehensive multivariable adjustment, residual confounding may still influence some of our results. Second, our patient population was predominantly female and black. However, these populations are often undertreated, underdiagnosed, and suffer worse outcomes compared with men and Caucasians, implying that VECAC may be particularly useful in these vulnerable populations.16 17 Third, since most events in our analysis are all-cause mortality, we were not able to provide stable estimates for individual components of the composite outcome. Moreover, since CAC is a marker of arterial ageing, it is highly conceivable that VECAC is predicting cardiovascular and also non-cardiovascular deaths.18 VECAC of zero was not reported separately as a number of such cases may correspond to a non-zero CAC (typically 1–10) when reviewing ungated CT scans.6 Finally, events were determined by electronic health record review, and therefore some events that occurred outside of our large, tertiary, healthcare system may not be captured.
In summary, VECAC is a simple, readily available, reliable and potent predictor of cardiovascular events beyond traditional risk factors and PET imaging markers, including CFR. VECAC implementation additionally identifies a substantial proportion of patients that qualify for preventative therapies. These findings suggest that VECAC assessment should be incorporated into routine clinical practice among patients referred for MPI.
Data availability statement
Data are available on reasonable request.
Ethics statements
Ethics approval
This study was approved by the University of Pennsylvania Institutional Review Board (#5; protocol no. 833757).
Acknowledgments
We would like to thank all the staff of the PET centre at the Hospital of the University of Pennsylvania for their technical support.
References
Supplementary materials
Supplementary Data
This web only file has been produced by the BMJ Publishing Group from an electronic file supplied by the author(s) and has not been edited for content.
Footnotes
SS and MSK contributed equally.
Contributors PB had full access to all of the data in the study and takes responsibility for the integrity of the data and the accuracy of the data analysis. SS and MSK served as first authors. SS, MSK, PCW, MAG and PB contributed to the study design. SS, MSK and PB contributed to data gathering. SS, MSK, SK, RT and PB contributed to data interpretation. SS, MSK and PB drafted the original manuscript and MKV, PCW, AEdF, HJ, DJ, HL, DP, JD and MAG revised it critically with respect to intellectual content.
Funding The authors have not declared a specific grant for this research from any funding agency in the public, commercial or not-for-profit sectors.
Competing interests SS receives research support from the National Institutes of Health (Training Grant 5-T32HL007843-23), the Doris Duke Charitable Foundation (Physician Scientist Fellowship Award 2020061), the Measey Foundation, Institute for Translational Medicine and Therapeutics (Junior Investigator Preliminary/Feasibility Grant Programme award) and the American Society of Nuclear Cardiology (Institute for the Advancement of Nuclear Cardiology award). HL has research grants from Siemens Healthineers for unrelated projects.
Provenance and peer review Not commissioned; externally peer reviewed.