Article Text

Abstract
Objectives To validate the Global Registry of Acute Coronary Events (GRACE) risk score and examine the extent and impact of the risk–treatment paradox in contemporary patients with acute coronary syndrome (ACS).
Methods Data from 5015 patients with ACS enrolled in the FORCE-ACS registry between January 2015 and December 2019 were used for model validation. The performance of the GRACE risk score for predicting in-hospital and 1-year mortality was evaluated based on indices of model discrimination and calibration. Differences in the delivery of guideline-recommended care among patients who survived hospitalisation (n=4911) per GRACE risk stratum were assessed and the association with postdischarge mortality was examined.
Results Discriminative power of the GRACE risk score was good for predicting in-hospital (c-statistic: 0.86; 95% CI: 0.83 to 0.90) and 1-year mortality (c-statistic: 0.82; 95% CI: 0.79 to 0.84). However, the GRACE risk score overestimated the absolute in-hospital and 1-year mortality risk (Hosmer-Lemeshow goodness-of-fit test p<0.01). Intermediate-risk and high-risk patients were 12% and 29% less likely to receive optimal guideline-recommended care compared with low-risk patients, respectively. Optimal guideline-recommended care was associated with lower mortality in intermediate- and high-risk patients.
Conclusions The GRACE risk score identified patients at higher risk for in-hospital and 1-year mortality, but overestimated absolute risk levels in contemporary patients. Optimal guideline-recommended care was associated with lower mortality in intermediate-risk and high-risk patients, but was less likely to be delivered with increasing mortality risk.
- acute coronary syndrome
- pharmacology, clinical
- myocardial infarction
Data availability statement
Data are available upon reasonable request.
This is an open access article distributed in accordance with the Creative Commons Attribution Non Commercial (CC BY-NC 4.0) license, which permits others to distribute, remix, adapt, build upon this work non-commercially, and license their derivative works on different terms, provided the original work is properly cited, appropriate credit is given, any changes made indicated, and the use is non-commercial. See: http://creativecommons.org/licenses/by-nc/4.0/.
Statistics from Altmetric.com
Key questions
What is already known about this subject?
Patients with acute coronary syndrome are a heterogeneous group with a varying risk of in-hospital and long-term mortality. Clinical risk scores, especially the Global Registry of Acute Coronary Events (GRACE) risk score, play an important role in estimating these risks.
What does this study add?
The GRACE risk score remains a useful tool to identify patients at higher risk for in-hospital and 1-year mortality, although the absolute risk in contemporary patients is overestimated.
Patients at high risk are less likely to receive guideline-recommended care, although high-risk patients potentially benefit most from these therapies in terms of absolute risk reduction.
How might this impact on clinical practice?
In combination with more awareness of the risk–treatment paradox, risk stratification using risk scores could lead to increased implementation of evidence-based therapies, especially in high-risk patients.
Introduction
Patients with acute coronary syndrome (ACS) are a heterogeneous group with a varying risk of in-hospital and long-term mortality.1 2 Clinical risk scores play an important role in estimating these risks.1 2 Among the available risk scores, the Global Registry of Acute Coronary Events (GRACE) risk score is most used in clinical practice. The most recent version of the GRACE risk score (V.2.0) was originally derived in 32 037 patients enrolled in the GRACE registry (14 countries, 94 hospitals) between January 2002 and December 2007 and externally validated in the FAST-MI registry.3 Current guidelines recommend the GRACE risk score for estimating prognosis and make specific recommendations based on the GRACE risk score, for example an early invasive strategy is recommended within 24 hours in patients with non-ST-segment elevation acute coronary syndrome (NSTE-ACS) with a GRACE risk score >140.1 Given the temporal improvements in both in-hospital and long-term survival of patients with ACS, continuous validation of the GRACE risk score in contemporary patient cohorts and subgroups with specific risk profiles, for example, women or the elderly, is warranted.4 5 Furthermore, it is well recognised that the delivery of guideline-recommended care is inversely related to the estimated mortality risk, the so called risk–treatment paradox.6 7 Even though there have been encouraging signs that this treatment gap between the different risk groups is narrowing, the reasons for and consequences of the risk–treatment paradox remain poorly understood.8
Thus, using data from the FORCE-ACS registry, our study aimed to (1) validate the GRACE risk score by assessing its performance for predicting in-hospital and 1-year mortality, (2) assess the performance of the GRACE risk score among subgroups based on sex, age, type of ACS and bleeding risk and (3) assess the delivery and impact of guideline-recommended care among the different GRACE risk score strata.
Methods
Study design and patient population
The rationale and design of the FORCE-ACS registry have been described previously.9 In brief, the FORCE-ACS registry is an ongoing prospective registry of nine Dutch hospitals. The primary aim of the registry is to provide insight into different aspects of the diagnosis, management and follow-up of patients with ACS. All participating hospitals are capable of performing coronary angiography and six hospitals have on-site percutaneous coronary intervention facilities. Patient management, including the use of invasive and pharmacological therapies, in all participating hospitals is performed according to relevant guidelines.1 2 From 2015 onwards, all consecutive adult patients admitted for (suspected) ACS were eligible for participation. Patients were followed up by questionnaires at 1, 12, 24 and 36 month(s) after initial admission. Written informed consent was obtained from each patient. The institutional review boards of all participating centres approved the protocol of the FORCE-ACS registry. The current study complies with the principles of the Declaration of Helsinki and reports according to the Transparent Reporting of a multivariable prediction model for Individual Prognosis Or Diagnosis statement.10
GRACE risk score
The GRACE risk score including the predicted in-hospital and 1-year mortality risk was calculated using the web calculator available at www.outcomes-umassmed.org/grace/acs_risk2/index.html. Patients were categorised as low-risk (<109), intermediate-risk (109–140) or high-risk (>140).
Clinical endpoints
The primary endpoints were in-hospital and 1-year mortality. All deaths were reviewed by two authors (NMRvdS and JA) who had full access to the patient’s (electronic) health record. Cause of death was classified as cardiovascular or non-cardiovascular. Cause of death was assumed to be cardiovascular unless a non-cardiovascular cause could be identified. The primary endpoints were evaluated in several subgroups: (1) men versus women, (2) <75 years versus ≥75 years, (3) NSTE-ACS versus ST-segment elevation acute coronary syndrome (STE-ACS) and (4) low bleeding risk (PRECISE-DAPT score <25) versus high bleeding risk (PRECISE-DAPT score ≥25).
To assess the association between the delivery of guideline-recommended care and 1-year mortality within each GRACE risk score stratum, each patient was classified as receiving optimal or suboptimal guideline-recommended care. Optimal guideline-recommended care was defined as undergoing coronary angiography during initial hospital admission and receiving all outpatient medications with a class I guideline recommendation (ie, aspirin, a P2Y12-inhibitor, a beta-blocker, an angiotensin-converting enzyme (ACE) inhibitor or angiotensin receptor blocker (ARB) and a cholesterol-lowering drug (eg, statins, ezetimibe and/or a PCSK9-inhibitor)).1 2 In case of concurrent oral anticoagulation use (eg, because of atrial fibrillation) aspirin or a P2Y12-inhibitor on top of an oral anticoagulant was also considered as optimal guideline-recommended care in line with the most recent guidelines.1 2 Only patients who survived their initial admission were included in this analysis as the critical condition of non-survivors might have prevented them from receiving guideline-recommended care. A complete case sensitivity analysis was performed to assess the effect of excluding patients who died during their initial hospital admission.
Statistical analysis methods
Continuous variables are presented as median and 25th–75th IQR. Discrete variables are presented as frequencies and percentages. The Mann-Whitney U and χ2 test or Fisher’s exact test were used to compare quantitative and discrete variables, respectively.
Indices of discrimination and calibration were used to assess the performance of the GRACE risk score. To assess model discrimination (ie, the ability to distinguish (future) cases from non-cases), c-statistics with corresponding 95% CI were computed from the area under the receiver operator characteristic (ROC) curve. Based on current convention, discriminative ability was categorised as poor (c-statistic <0.70), moderate (c-statistic between 0.70 and 0.80) or good (c-statistic ≥0.80).11 Subgroup differences were assessed by comparing c-statistics using the DeLong method. Calibration (ie, the ability to predict the absolute level of risk) was visually assessed by plotting observed versus predicted outcomes and formally tested using the Hosmer-Lemeshow goodness-of-fit test. A p value ≥0.05 for such a test would indicate adequate calibration.
Differences in the delivery of guideline-recommended care among the different GRACE risk categories were assessed using the χ2 test. Subsequently, the cumulative incidence of postdischarge 1-year mortality among patients receiving optimal and suboptimal guideline-recommended care per GRACE risk stratum was estimated using the Kaplan-Meier method and differences between groups were assessed using the log-rank test. Additionally, the characteristics of patients receiving either optimal or suboptimal guideline-recommended care in the different risk categories were compared using previously described methods. Potential predictors for receiving optimal guideline-recommended care were investigated using multivariable forward stepwise logistic regression. Potential predictors considered for inclusion in the forward stepwise models were selected based on literature, clinical judgement and availability during hospital admission. Significance was set at a p value of <0.05. Statistical analyses were performed using SPSS V.26 (SPSS, Chicago, Illinois, USA) and R studio V.3.6.1 (Vienna, Austria).
Patient and public involvement
Patients and the wider public were not involved in the design or conduct of this study.
Results
Patient characteristics
From January 2015 until December 2019, 5817 patients were included in the FORCE-ACS registry. In total, 5181 patients were diagnosed with ACS at discharge. Vital status at 1-year follow-up was not available for 39 patients and the GRACE risk score could not be calculated in 127 patients. Hence, 5015 patients (28.7% women) were included for the model validation. A detailed flowchart is provided in online supplemental figure 1.
Supplemental material
Compared with the derivation cohort of the GRACE risk score, patients in the validation cohort were more likely to be male and to have hyperlipidaemia (table 1). A smaller proportion of the patients in the validation cohort had hypertension, diabetes mellitus, chronic kidney disease and prior myocardial infarction compared with the derivation cohort. Patients in the validation cohort more often presented with abnormal cardiac enzymes, but had markedly lower serum creatinine levels. The rate of cardiac arrest at admission was almost twofold in the validation cohort as compared with the derivation cohort. Most of the patients in the validation cohort were classified as low risk (46.6%). The rest of the patients were divided among the intermediate-risk (36.5%) and high-risk (16.9%) categories.
Baseline characteristics of the FORCE-ACS validation cohort and the GRACE risk score derivation cohort
Performance of the GRACE risk score
The observed and predicted in-hospital and 1-year mortality rates in the overall cohort and the subgroups are shown in table 2. Causes of death are specified in online supplemental table 1. A total of 104 (2.1%) patients died in-hospital, 93 (1.9%) patients due to cardiovascular causes and 11 (0.2%) due to non-cardiovascular causes. At 1 year, 271 (5.4%) patients died, 204 (4.1%) patients due to cardiovascular causes and 67 (1.3%) due to non-cardiovascular causes. The distribution of mortality among the different risk groups demonstrated a clear gradient of risk (the higher the risk at baseline, the higher the observed mortality rate).
Observed and predicated rates of in-hospital and 1-year mortality in the FORCE-ACS validation cohort
The discriminative ability of the GRACE risk score for predicting in-hospital and 1-year mortality was good in the validation cohort with a c-statistic of 0.86 (95% CI: 0.83 to 0.90) and 0.82 (95% CI: 0.79 to 0.84), respectively (figure 1). Discrimination for predicting 1-year mortality in hospital survivors alone was similar (c-statistic: 0.79; 95% CI: 0.76 to 0.82). There were no differences in discriminative ability between subgroups for predicting in-hospital mortality. At 1 year, several subgroups demonstrated only moderate discrimination. The GRACE risk score predicted 1-year mortality less well in patients ≥75 years compared with patients <75 years (c-statistic: 0.70 (95% CI: 0.66 to 0.74) vs 0.79 (95% CI: 0.74 to 0.84), p=0.01). Discrimination was poor in patients with high bleeding risk (c-statistic: 0.69; 95% CI: 0.65 to 0.73). ROC curves for the various subgroups are provided in online supplemental figures 2–5.

Receiver operating characteristic curve of the Global Registry of Acute Coronary Events risk score for in-hospital mortality (blue) and 1-year mortality (green) in the validation cohort. AUC, area under the curve.
Calibration of the GRACE risk score to predict in-hospital and 1-year mortality was inadequate, based on visual inspection of the plotted observed and predicted event rates and according to formal statistical testing (Hosmer-Lemeshow goodness-of-fit test p<0.01) (figure 2). The GRACE risk score overestimated in-hospital mortality risk in all subgroups, except in female patients, patients ≥75 years and patients at high risk of bleeding. At 1 year, the GRACE risk score overestimated the mortality risk in all subgroups. Calibration curves for the various subgroups are provided in online supplemental figures 6–9.

Calibration plot of the Global Registry of Acute Coronary Events risk score for in-hospital mortality (blue) and 1-year mortality (green) in the validation cohort. Patients were divided into deciles based on the predicted risk of mortality, each data point represents one decile. The dashed line shows absolute agreement between the observed and predicted rates.
Delivery of guideline-recommended care
A total of 104 (2.1%) patients died during their initial hospitalisation. Hence, 4911 patients were included for the evaluation of delivery of guideline-recommended care (online supplemental figure 1). Based on the GRACE risk score, 2328 (47.4%) patients were classified into the low-risk, 1811 (36.9%) intermediate-risk and 770 (15.7%) high-risk category (table 3). Patients in the intermediate-risk group were 12% less likely to receive optimal guideline-recommended care as compared with patients in the low-risk group. Even more evident, patients in the high-risk group were 29% less likely to receive optimal guideline-recommended care as compared with patients in the low-risk group. Lack of beta-blocker (29.6%) and ACE-inhibitor or ARB (26.3%) use was the most common reason for being classified into the suboptimal guideline-recommended care group, a finding present in all three risk categories. Additionally, patients in the high-risk group were frequently classified into the suboptimal guideline-recommended care group because coronary angiography was not performed (14.6%).
Patient management for the whole cohort and separately in the low-risk, intermediate-risk and high-risk categories
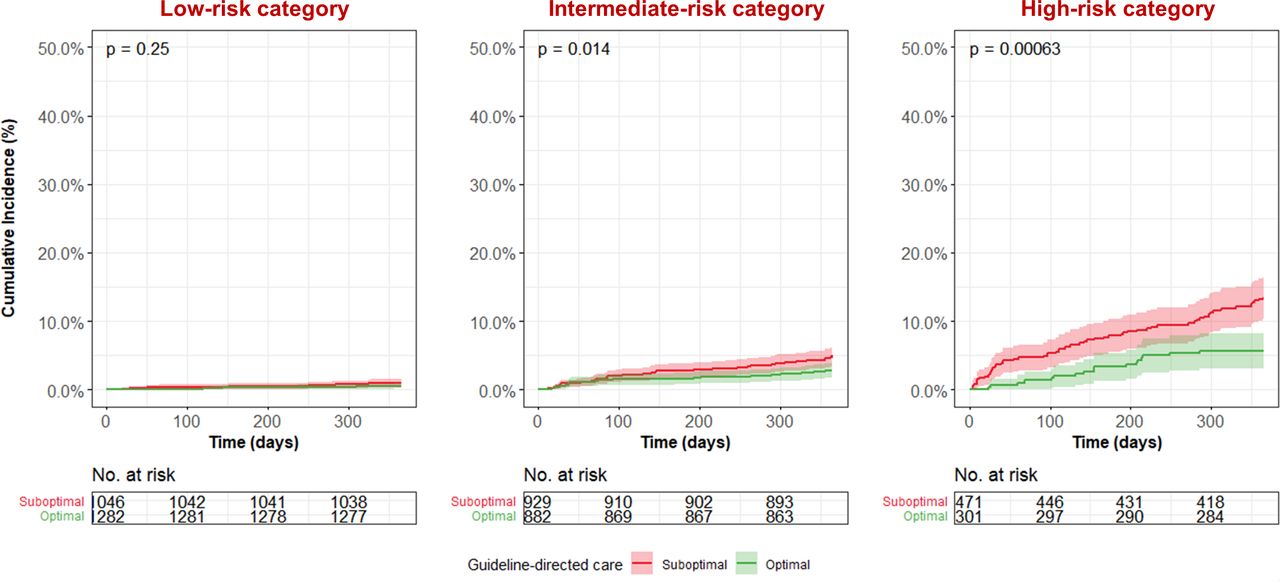
In the intermediate-risk and high-risk category, optimal guideline-recommended care was associated with a significantly lower postdischarge mortality rate as compared with suboptimal guideline-recommended care (figure 3). The postdischarge mortality rate in patients receiving optimal guideline-recommended care was 0.5%, 2.7% and 5.6% in the low-risk, intermediate-risk and high-risk category, respectively. This was higher with 1.0%, 5.0% and 13.4% in the same categories in patients receiving suboptimal guideline-recommended care. A sensitivity analysis assessing the effect of excluding patients who died in hospital revealed that including these patients would strengthen the association between optimal guideline-recommended care and reduced 1-year mortality (online supplemental figure 10).

All-cause mortality according to treatment status in the low-risk, intermediate- and high-risk categories.
Importantly, patients receiving optimal or suboptimal guideline-recommended care within the same risk strata had different characteristics (table 4) and several independent predictors for receiving optimal guideline-recommended care were identified (online supplemental table 2). Optimal-treated patients were younger and presented with STE-ACS more often compared with suboptimal-treated patients in all risk categories. STE-ACS diagnosis remained an independent predictor for receiving optimal guideline-recommended care in all risk categories, while age was an independent predictor in low-risk and high-risk patients. Optimal-treated patients at low and intermediate risk had a higher heart rate compared with patients receiving suboptimal guideline-recommended care, although heart rate was only an independent predictor in low-risk patients. Optimal-treated patients at low and high risk were less often female and presented with cardiac arrest more frequent. Female sex was an independent predictor for receiving suboptimal guideline-recommended care in these risk groups. Optimal treated patients at intermediate and high risk had lower creatinine levels compared with their counterparts receiving suboptimal guideline-recommended care, but this was not an independent predictor. Conversely, high-risk optimal-treated patients were more likely to present with cardiogenic shock than their optimally treated counterparts, although this was again not an independent predictor.
Characteristics of patients receiving suboptimal and optimal guideline-recommended care in the low-risk, intermediate-risk and high-risk categories
Discussion
The most important findings of the study are as follows: (1) the GRACE risk score retained good discrimination for prediction in-hospital and 1-year mortality, (2) the GRACE risk score overestimated the absolute in-hospital and 1-year mortality risk, (3) the delivery of optimal guideline-recommended care was inversely related to the estimated mortality risk and (4) optimal guideline-recommended care was associated with lower mortality in intermediate- and high-risk patients.
Performance of the GRACE risk score
The GRACE risk score showed good discriminative power for predicting in-hospital and 1-year mortality. These results align with previous external validation studies showing moderate-to-good discrimination.3 12–16 However, the GRACE risk score overestimated the absolute in-hospital and 1-year mortality risk, especially among low-risk patients. There are several plausible explanations for the overestimation in our cohort.
First, over the past decades there has been a substantial decrease in mortality, most likely due to (more complete) implementation of evidence-based therapies.4 5 17 Previous studies have confirmed that the GRACE risk score retains its discriminative accuracy and has not been influenced by better management or clinical outcomes.16 However, the GRACE risk score fails to account for the impact of these improvements on absolute risk prediction.16
Second, elevated cardiac biomarkers serve as an important predictor in the GRACE risk score. Almost all patients in our validation cohort had abnormal cardiac enzymes in contrast to only half of all patients in the GRACE derivation cohort. Discrepancies might be explained by the utilisation of high-sensitive cardiac troponin assays compared with traditional troponin assays at the time of model development. Introduction of these high-sensitive cardiac troponin has increased the detection of patients with only minor cardiac troponin release.18 The GRACE risk score does not differentiate between different troponin concentrations. Incorporating troponin concentration as a continuous or categorical instead of dichotomous variable might improve the performance of the model, but also provides practical concerns (eg, inter-hospital variability).
Third, geographical differences play a role in absolute risk prediction. The GRACE risk score was derived from a multinational cohort (14 countries) and geographic location has previously been identified as a predictor of mortality in patients with ACS.19 20 Overestimation of the mortality risk in this national (ie, Dutch) cohort might be a reflection of a geographical advantage.
Performance of the GRACE risk score in subgroups
Our study assessed the performance of the GRACE risk score for predicting in-hospital and 1-year mortality in several subgroups. Although discrimination remained good in most subgroups, we observed two trends: (1) the GRACE risk score lost discriminative power in subgroups at higher risk, and (2) the GRACE risk score overestimated absolute mortality risk especially in subgroups at lower risk. There are some general and subgroup-specific explanations for these trends.
First, discrimination in higher risk patients, such as elderly or patients at high bleeding risk, might be lower due to competing risks (eg, comorbidities such as cancer, neurocognitive disorders or overall frailty) for which the GRACE risk score predicts less accurately or not at all. The absolute rate of non-cardiovascular mortality was higher in patients ≥75 years and patients at high bleeding risk, although the proportion of non-cardiovascular mortality relative to overall mortality was fairly consistent across subgroups. Of note, discrimination remained at least moderate (c-statistic ≥0.70) in all subgroups, except for predicting 1-year mortality in patients at high bleeding risk. Moreover, we used the Hosmer-Lemeshow goodness-of-fit test to assess calibration, which has a tendency towards significance for larger sample sizes. In the validation cohort, the sample size of the subgroups at lower risk (ie, men, patients <75 years and patients at low bleeding risk) was more than twofold compared with their counterparts at higher risk, resulting in greater power to detect differences in predicted versus observed mortality rates in low-risk subgroups.
Our observation that absolute risk was overestimated especially in men was consistent with the findings of Gong et al in the CANRACE registry (n=14 422).21 It is well recognised that there are sex-related disparities in the management and outcome of patients with ACS.22 Treatment disparities might explain part of the inadequate calibration in men, who are more likely to receive guideline-recommended interventions, including undergoing coronary angiography and revascularisation more often compared with women.23 Gong et al argued that because treatment is not a component of the GRACE risk score, it might affect its accuracy.21 Interestingly, Gong et al did not find a significant interaction between sex and the individual GRACE risk score predictors.21
Contrary to our findings, previous studies have shown that the GRACE risk score retains good discriminative power in older patients, even for 1-year mortality.24 In our study, the GRACE risk score had moderate discriminative power for predicting 1-year mortality in older patients. Previous work has suggested that adding frailty to the GRACE risk score enhances discrimination for predicting 1-year mortality in patients ≥65 years, but the practicalities of incorporating a frailty assessment should be considered.25 Explanations for poor discrimination for predicting 1-year mortality in patients at high bleeding risk, might coincide with the abovementioned. Furthermore, patients at high bleeding risk are more likely to prematurely discontinue guideline-recommended therapies, such as dual antiplatelet therapy, which is not considered by the GRACE risk score and might hamper its accuracy.
Risk–treatment paradox
In patients who survived their initial hospital admission, predicted mortality risk was inversely associated with the delivery of optimal guideline-recommended care. There have been encouraging signs that the treatment gap between the different risk groups is narrowing, but our study reinforces the notion that continued attention is warranted.4 5 8 Importantly, current guidelines emphasise the importance of (formal) risk stratification, especially since clinicians tend to overestimate procedure-related or therapy-related risks and underestimate disease-related risks based on clinical judgement alone.1 2 26 27 In combination with more awareness of the risk–treatment paradox, risk stratification based on risk scores could lead to increased implementation of evidence-based therapies, especially in high-risk patients. High-risk patients are often older and have more comorbidities (eg, chronic kidney disease) or competing risks (eg, high bleeding risk). Therefore, clinicians might be reluctant to subject patients to invasive procedures due to the risk of procedure-related complications, such as contrast-induced kidney injury or access site bleeding. Furthermore, clinicians might be disinclined to prescribe certain recommended medications in order to prevent polypharmacy, which is linked to non-adherence, especially in older and more frail patients.28
Our study demonstrated that optimal guideline-recommended care was associated with lower 1-year mortality in intermediate-risk and high-risk patients. In the British MINAP and French FAST-MI registries guideline adherence was associated with decreased 30 days and 3 years mortality in a dose–response manner.29 30 Of note, these studies were mostly restricted to individual quality indicators or interventions rather than a cumulative measure of guideline-recommended care. In contrast, Saar et al used a cumulative measure of guideline-recommended care in the description of the in-hospital care for 3803 Estonian patients with non-ST-elevation myocardial infarction (NSTEMI). Patients with a low estimated 1-year mortality risk according to the GRACE risk score were more likely to receive guideline-recommended in-hospital medication (defined as aspirin, P2Y12-inhibitors, ACE-inhibitors or ARBs, beta-blockers, statins and parenteral anticoagulants) and underwent coronary angiography more often than patients at intermediate or high risk. Importantly, Estonia has a relatively high cardiovascular mortality and almost half of patients were classified as high risk. Of note, Saar et al reported that only 70.2% of all patients underwent coronary angiography as compared with 94.7% in our cohort. This discrepancy might be explained in part by the inclusion of patients with STE-ACS in the FORCE-ACS registry, who practically always undergo coronary angiography, and the widespread coronary angiography capabilities in Dutch hospitals. There are also indications that the delivery of guideline-recommended care is associated with positive outcomes beyond 1 year. Hall et al showed that the differences in mortality between optimal and suboptimal-treated patients with NSTEMI increases over time and lasted up to 8 years, irrespective of risk category.7 31 Notably, Hall et al focused on patients with NSTEMI. The present study suggests that this effect was present across the ACS spectrum at least in the first year. Follow-up beyond 1 year is necessary to study the long-term effect of optimal guideline-recommended care.
It should be emphasised that there are important differences between patients receiving optimal and suboptimal guideline-recommended care even within risk strata. Differences in factors such as age and clinical presentation can significantly confound the association between guideline-recommended care and mortality. Furthermore, our results suggest that there might be sex disparities at play. Women were roughly 25% more likely to be classified as high risk, while women at low and high risk were less likely to receive optimal guideline-recommended care compared with their male counterparts even after considering relevant confounders. Moreover, there may be other unmeasured confounders (eg, frailty or medication compliance). Most studies do not report or correct for these differences and might therefore overestimate the potential of optimal guideline-recommended care.
Limitations
This study has several important limitations. First, 0.8% of patients were lost to follow-up before 1 year and the GRACE risk score could not be calculated in 2.5% of patients, because of missing values. In theory, this could have resulted in selection bias. However, this group only forms a small proportion of the total study population. Second, the association between guideline-recommended care and mortality as seen in this cohort study does not imply causality, especially since there were important differences between optimal-treated and suboptimal-treated patients within risk strata. Furthermore, drug-specific contraindications, patient refusals or allergies were not taken into account. Lastly, our study was conducted in the Netherlands and, as mentioned before, geographical differences in treatment and outcomes might have influenced the study results.
Conclusions
The GRACE risk score identified patients at higher risk for in-hospital and 1-year mortality, but overestimated absolute risk levels in contemporary patients. Optimal guideline-recommended care was associated with lower mortality in intermediate- and high-risk patients, but was less likely to be delivered with increasing predicted mortality risk.
Data availability statement
Data are available upon reasonable request.
Ethics statements
Patient consent for publication
Ethics approval
This study involves human participants and was approved by MEC-U (ref: ClinicalTrials.gov Identifier: NCT03823547) Participants gave informed consent to participate in the study before taking part.
References
Supplementary materials
Supplementary Data
This web only file has been produced by the BMJ Publishing Group from an electronic file supplied by the author(s) and has not been edited for content.
Footnotes
Twitter @NielsvdSangen
NMRvdS and JA contributed equally.
Contributors NMRvdS, JA and DCPY were responsible for data collection, statistical analysis and preparation of the original draft of the manuscript. Dr WK, Professor Dr JtB and Professor Dr JPSH were responsible for the supervision of the project. All other authors were involved in data collection and critically reviewed the original draft of the manuscript. NMRvdS is responsible for the overall content of the manuscript as a guarantor.
Funding The FORCE-ACS registry is supported by grants from ZonMw, the St. Antonius Research Fund and AstraZeneca. The authors are solely responsible for the design and conduct of this study, all study analyses, the drafting and editing of the manuscript and its final contents.
Competing interests Dr Wouter J Kikkert has received a research grant from AstraZeneca. Dr Georgios J Vlachojannis has research grants from MicroPort and Ferrer and personal fees from Terumo and AstraZeneca. Dr Yolande Appelman has received a research grant from the Dutch Heart Foundation. Professor Dr José PS Henriques has received research grants from Abbott Vascular, AstraZeneca, B. Braun, Getinge, Ferrer, Infraredx and ZonMw. Professor Dr Jurriën M ten Berg has received research grants from AstraZeneca and ZonMw and personal fees from AstraZeneca, Accu-Metrics, Bayer, Boehringer Ingelheim, Bristol-Myers Squibb, Daiichi Sankyo, Eli Lilly, Ferrer, Idorsia, Pfizer and The Medicines Company. All other authors have no relationships with industry to disclose.
Provenance and peer review Not commissioned; internally peer reviewed.
Supplemental material This content has been supplied by the author(s). It has not been vetted by BMJ Publishing Group Limited (BMJ) and may not have been peer-reviewed. Any opinions or recommendations discussed are solely those of the author(s) and are not endorsed by BMJ. BMJ disclaims all liability and responsibility arising from any reliance placed on the content. Where the content includes any translated material, BMJ does not warrant the accuracy and reliability of the translations (including but not limited to local regulations, clinical guidelines, terminology, drug names and drug dosages), and is not responsible for any error and/or omissions arising from translation and adaptation or otherwise.