Article Text

Abstract
Objective To assess the prevalence and long-term prognostic value of a dynamic (rise/fall) pattern of cardiac troponin T (hs-cTnT) elevation during acute exacerbation of chronic obstructive pulmonary disease (AECOPD) compared with a stable hs-cTnT elevation.
Methods Prospective cohort study of unselected patients admitted with AECOPD to the emergency room of a university hospital. Serial hs-cTnT measurements were made during admission. Survival after a median of 1.8 years was recorded.
Results 83 patients with a mean age of 72 years and a mean forced expiratory volume in 1 s (FEV1) of 0.9 L. The mortality rate was 62%. The median hs-cTnT at admission was 27 ng/L (IQR 13.4–51)). 65 patients (78%) had at least one hs-cTnT measurement ≥14 ng/L, and among these the median change in hs-cTnT was 50.7% (IQR 25.2–89.4). Of the patients with serial hs-cTnT measurements, 53 (82%) had a dynamic pattern (ie, ΔTnT ≥20%). In multivariate analysis, stable hs-cTnT elevation was associated with increasing age (OR per 5 years with 95% CI 1.9 (1.01 to 3.7), p=0.045) and low Hb (OR 7.3 (1.1 to 49), p=0.039). Stable hs-cTnT elevation was associated with increased mortality with an HR of 2.4 (95%CI 1.1 to 5.3, p=0.027) in the multivariate Cox regression analysis.
Conclusions Among the patients with at least one hs-cTnT above the 99th centile, 82% had a rise/fall pattern, as requested to make a diagnosis of myocardial infarction. Compared to a dynamic rise/fall pattern of hs-cTnT, a stable and moderately elevated hs-cTnT during AECOPD is associated with poor long-term prognosis.
This is an Open Access article distributed in accordance with the Creative Commons Attribution Non Commercial (CC BY-NC 3.0) license, which permits others to distribute, remix, adapt, build upon this work non-commercially, and license their derivative works on different terms, provided the original work is properly cited and the use is non-commercial. See: http://creativecommons.org/licenses/by-nc/3.0/
Statistics from Altmetric.com
Key messages
-
This is the first study to investigate serial measurements of cardiac troponin during severe COPD exacerbation.
-
Both cardiac biomarkers troponin T and NT-proBNP are analysed in the same model, demonstrating their independent prognostic information.
-
Echocardiograpy was not performed per protocol.
-
The number of subjects is relatively small.
Introduction
Patients with chronic obstructive pulmonary disease (COPD) may suffer from a range of comorbidities that affect mortality.1 ,2 Among these are cardiovascular diseases (CVDs), which are found to be more prevalent among patients with COPD than in the general population, even after adjustment for important confounders such as smoking habits.3 ,4 Heart failure (HF) and myocardial infarction (MI) are prevalent and often unrecognised in patients with COPD.5–11
In the diagnosis of CVD, two families of biomarkers are central: the cardiac troponins (cTn), and the natriuretic peptides, B-type natriuretic peptide (BNP) and the amino-terminal fragment of its precursor proBNP (NT-proBNP). These biomarkers have all been measured in patients with COPD, both in the stable phase and during acute exacerbations (acute exacerbation of chronic obstructive pulmonary disease; AECOPD).12–18 Owing to the different assays, cut-offs and patient populations, the results are not directly comparable, but there are some emerging patterns: concentrations above normal of cTn or NT-proBNP are relatively common among patients with COPD and are associated with increased mortality.14–16 ,19–23 It has not been established to what degree the release of these markers during AECOPD is attributable to MI (type 1 or 2), increased pressure in the left or right heart, myocardial remodelling or a combination of these mechanisms. Trying to elucidate this, we and other investigators have assessed the associations between cTn elevation and clinical features essential in the diagnosis of MI (ie, chest pain or electrocardiographic changes) among patients with AECOPD, but found none.13 ,24 ,25 Moreover, we have failed to demonstrate any association between hypoxaemia, which may cause a type 2 MI, and cTn. We have, however, shown that tachycardia during AECOPD is associated with increased cTnT concentrations, a finding that supports the type 2 MI theory.14 ,25
Detection of a cTn above the 99th centile is a conditio sine qua non in the diagnosis of MI, but a number of cardiac and non-cardiac conditions may also promote cardiomyocyte injury or death causing elevated cTn.26 Hence, additional criteria must be satisfied to establish the MI diagnosis. One important criterion is that cTn should show a characteristic rise and/or fall pattern indicating acute cardiomyocyte death rather than chronic cell death or injury. The guidelines do not specify how great the change in cTn should be, except in the setting of reinfarctions, but the topic is frequently discussed in the literature.27 The National Academy of Clinical Biochemistry and the European Society of Cardiology recommend that a 20% change should be considered clinically relevant.27 ,28 With more sensitive assays being introduced, intraindividual changes as well as analytical variations must be considered,29 calculating reference change values (RCVs) for each cTn assay. Using Roche's highly sensitive troponin T (hs-cTnT) assay, an RCV as high as 85% was found to be necessary to define a changing pattern during short-term serial testing in the low, normal range (0–6 ng/L).30
In an interesting paper, Patel et al31 recently reported serial cTnT measurements during light exacerbations of COPD. To the best of our knowledge, the prevalence of cTn rise/fall during severe AECOPD has not been assessed until now, so the proportion of cTn positive patients with AECOPD satisfying the MI definition remains unknown. McAllister found that 8.3% of 242 patients with AECOPD fulfilled the MI criteria, taking a thorough chest pain history and analysing serial ECGs. However, as we understand their paper, they did not perform serial measurements of cTn, but regarded a single measurement above the 99th centile as a rise from a presumably normal concentration. Since baseline hs-cTnT concentration in COPD may be elevated,12 the assumption that a single elevated measurement represents an MI may not hold true.
The aim of this study was to investigate the pattern of hs-cTnT in serial measurements in patients with at least one hs-cTnT measurement above the 99th centile during hospitalisation for AECOPD. We further wanted to identify demographic, historical and clinical determinants of different hs-cTnT patterns and to assess whether different hs-cTnT patterns were associated with long-term mortality.
Methods
From 3 January 2005 through 30 November 2006, 99 unselected patients hospitalised with AECOPD were included at admission and followed until 31 December 2008 or death. We recorded medical history including smoking history, body mass index (BMI) and spirometry, laboratory data, chest radiograph, admission ECG, medications on admission and discharge, discharge diagnoses and readmissions. Details regarding the patient inclusion, data collection, and description of procedures and analytical methods have been described in a previous paper,14 and are presented as online supplementary material. Blood was drawn in the emergency department on admission (day 0) and on the morning rounds on days 1, 2 and 4. Study-specific blood analyses were not performed until 2009, leaving the treating physicians blinded to the results.
Postbronchodilation spirometry data from a stable phase were recorded when available. ECG recordings were obtained on admission and subsequently analysed by two independent and blinded researchers. They recorded the heart rhythm, the QRS axis and signs of right or left ventricular hypertrophy, current ischaemia (ST segment depression or elevation) and prior MI (pathological Q waves, poor R wave progression, left bundle branch block, T wave inversion). The ruling of a third investigator was used in cases of disagreement. Chest radiographs were also read by two blinded investigators, who assessed the presence or the absence of pulmonary congestion, cardiomegaly, pleural effusions and infiltrates.
Statistical analyses
Baseline analyses
Only patients with at least one hs-cTnT measurement above the 99th centile (14 ng/L) were included in the analyses for this paper. ΔTnT was calculated by the formula (maximum cTnT−minimum cTnT)/minimum cTnT). A dynamic hs-cTnT pattern was defined as ΔTnT ≥20%. Differences in baseline characteristics for patients with stable vs dynamic hs-cTnT patterns were analysed using the χ², t test or Wilcoxon rank sum test. We analysed the following variables: age, gender, lung function (forced expiratory volume in 1 s (FEV1) in litres and per cent of predicted, and FEV1/forced vital capacity), BMI, medical history (coronary artery disease (CAD), left or right HF, arterial hypertension, diabetes mellitus, atrial fibrillation), biochemistry (haemoglobin (Hb), white blood cell and platelet counts, C reactive protein, serum creatinine, epidermal growth factor receptor (eGFR; MDRD formula), NT-proBNP) and ECGs and chest radiographs as described above. As eGFR by the MDRD formula has been validated only for values <60 mL/min/1.73 m2, we used the non-parametric test for comparison of eGFR.
Determinants of the hs-cTnT pattern
Variables that were different between patients with stable and dynamic hs-cTnT (p value <0.20) were included in a logistic regression model with the hs-cTnT pattern as the dependent variable. The full model was manually reduced by removing variables with p value >0.05 unless their removal increased the –2log likelihood statistic.
Survival analysis
For each of the variables that were different between patients with stable and dynamic hs-cTnT patterns, we also performed a survival analysis using an age-adjusted log-rank test. In these analyses, continuous covariables were categorised according to prespecified limits: age <65 years, 65–75 years and ≥75 years, Hb <13 g/L in males and <12 g/L in women, eGFR<60 and NT-proBNP in tertiles. The covariables that were associated with mortality (age-adjusted log-rank p value <0.20) as well as with the hs-cTnT pattern were investigated for confounding and effect modification by stratified analyses of mortality and comparison of mortality rates using the Mantel-Haentzel test. The variables were finally analysed in a multivariate Cox regression model that was manually reduced using backward elimination. Covariables were removed from the model one at a time if the p value in the multivariate model was >0.05 and its removal did not change the coefficient between the hs-cTnT pattern and mortality more than 10%.
The proportional hazards assumption was checked using the Martingale residuals. All analyses were performed using SAS V.9.2 (SAS Institute Inc, Cary, North Carolina, USA).
Results
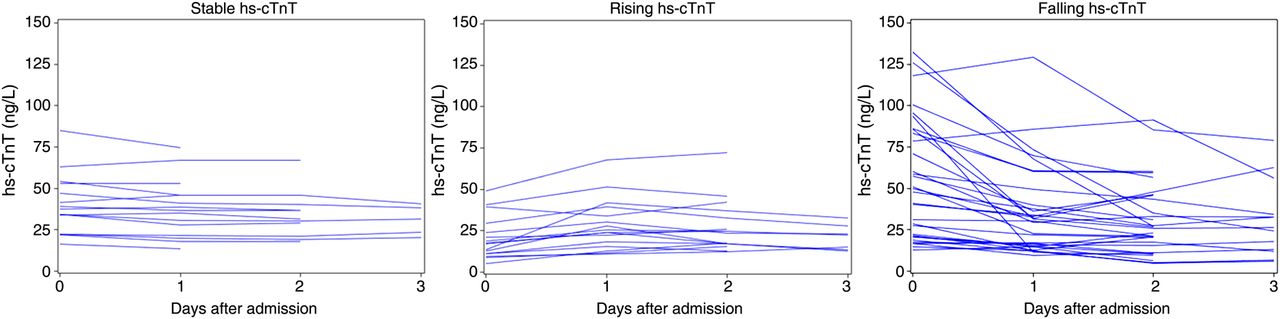
Of the initial cohort, 83 had repeated measures of hs-cTnT. The only variable that differed significantly (p<0.05) between patients with only one and more hs-cTnT measurements was age (mean 76.9 vs 70.4 years, p=0.007). Of the patients with repeated measurements, 65 (78%) had at least one measurement above 14 ng/L, and these 65 patients constitute the study population. Their mean age was 71.9 years (SD 8.9) and 28 (43%) of them were women. The mean FEV1 was 0.91 L (SD 0.45). The hs-cTnT concentrations, stratified by the hs-cTnT pattern, are shown in figure 1. The median baseline hs-cTnT was 34.3 (IQR 18.9–58.7) ng/L and the median ΔTnT was 50.7% (IQR 25.2–89.4). Fifty-three patients (82%) had a dynamic hs-cTnT pattern. It is evident from figure 1 that some patients experienced both a rise and a fall. (In the figure, patients are classified based on whatever occurred first for clarity, but no such distinction is made in the analyses.) Baseline characteristics of the two groups with different hs-cTnT patterns are shown in table 1 for relevant variables. Patients with a dynamic hs-cTnT pattern were significantly younger (mean 70.3 vs 78.9 years, p=0.002), and they had a higher Hb (mean 14.2 vs 12.9 g/dL, p=0.016). There were also trends towards lower NT-proBNP concentrations (pg/mL, median with IQR: 465 (183–1438) vs 1249 (561–2055), p=0.052) and less history of CAD (17% vs 42%, p=0.060). Of the 53 patients with a dynamic hs-cTnT pattern, 4 experienced chest pain, and 19 had signs of ischaemia in their ECG (none had both). Thus, 23 (43%) of the patients with a dynamic hs-cTnT pattern satisfied the universal MI criteria (corresponding to 35% of the patients with elevated hs-cTnT).
Baseline characteristics of 65 patients having elevated hs-cTnT concentrations (≥14 ng/L) on admission for AECOPD

hs-cTnT concentrations during admission for acute exacerbation of chronic obstructive pulmonary disease in patients with stable (A), rising (B) and falling (C) patterns of cTnT. Two outliers have been excluded for clarity. Their hs-cTnT concentrations were 256–387 pg/mL (B) and 192–124 (C).
As shown in table 1, kidney function, assessed by both serum creatinine and eGFR, did not differ between the hs-cTnT groups.
Determinants of the hs-cTnT pattern
In a logistic regression model, age and low Hb were significantly associated with the hs-cTnT pattern with ORs per 5 years (with 95% CIs) of 1.9 (1.01 to 3.07, p=0.045) and 7.3 (1.1–49, p=0.039), respectively. Neither creatinine nor eGFR showed p values <0.10 when added to the final model.
Survival analysis
During a median follow-up of 1.8 years, 40 patients (62%) died. The mortality rates per 100 patient-years among patients with stable and dynamic hs-cTnT patterns were 113 (95% CI 63 to 204) and 27 (19 to 39), respectively, corresponding to a mortality rate ratio of 4.2 favouring patients with a dynamic hs-cTnT pattern (log-rank p value 0.007, figure 2). For the variables that were associated with the hs-cTnT pattern and survival (age, history of CAD or LVHF, NT-proBNP and low Hb) we then performed stratified survival analyses (table 2).
Mortality (m), MR per 100 patient-years and mortality rate ratios after admission for AECOPD

Survival after acute exacerbation of chronic obstructive pulmonary disease with elevated hs-cTnT stratified by the hs-cTnT pattern: stable (red, n=12) or dynamic (blue, n=53).
These indicated that some confounding was present as the adjusted mortality rate ratios (table 2, rightmost column) differed from the crude value of 4.2 (table 2, last line). Additionally, the corresponding Mantel-Haentzel tests indicated effect modification between the hs-cTnT pattern and NT-proBNP, and between the hs-cTnT pattern and age (both p values <0.001). The corresponding interaction terms were therefore included in the initial multivariate model, but without being significant. In the multivariate analysis, a history of CAD did not remain significantly associated with mortality, leaving only NT-proBNP and the hs-cTnT pattern as significantly associated with mortality in the final model (table 3). Age and gender were kept in the model by convention. Adding the history of CAD or HF to the final model did not show significant associations, and the association between the hs-cTnT pattern and mortality remained statistically significant. Restricting the final analysis to patients without CAD or HF made only decimal changes in the estimates (data not shown).
Cox regression analysis showing HRs for long-term mortality after admission for AECOPD
Based on the discharge diagnoses, one female patient was diagnosed with MI. She had no history of CVD, but there was poor R wave progression in the precordial ECG leads. She did not have chest pain on admission. The hs-cTnT concentrations were 133–68-27 ng/L, NT-proBNP 104.3 pg/mL, and she survived the observation period. The remaining patients had discharge diagnoses of COPD with or without airway infection. With regard to the hs-cTnT concentrations, there was an outlier with hs-cTnT concentrations of 250–400 ng/L. This was an 80-year-old man with no known CVD and no chest pain. The ST segment was depressed, and NT-proBNP was 973 pg/mL. No heart disease was diagnosed or treated. He died 17 months later. Excluding one or both of the above from the final analyses widened the CIs somewhat, but made only decimal changes in the estimates.
The Cox models did not violate the proportional hazards assumption.
Discussion
To our knowledge, this is the first study to perform serial measurements of cardiac troponin in patients with COPD with acute exacerbation, and we found that a modestly and stably elevated hs-cTnT, as compared to a rise/fall pattern, was associated with increased mortality, even in multivariate analysis. This association is independent of NT-proBNP concentration and a history of HF, indicating that it is some other factor than HF that explains the stably elevated hs-cTnT.
Patients with a rising or falling cTn pattern may satisfy the MI criteria, and the appropriate therapy is readily available in widely published guidelines. Our main result, however, shows that it is important to also search for the underlying conditions available to treatment in patients with a stable cTn pattern. Based on our results, with the association between the hs-cTnT pattern and mortality being independent of NT-proBNP, the history of HF and eGFR, this underlying condition is some condition other than heart or kidney failure. There may still be residual confounding, however, of some unidentified underlying factor that connects these variables.
Reduced Hb was strongly associated with a stable hs-cTnT pattern. Parallel to a type 2 MI, there is a possibility that the myocardium suffers from a chronically reduced oxygen delivery. Moreover, anaemia is an established comorbidity in COPD, possibly resulting from chronic systemic inflammation,2 a process that also promotes CVD. It may be that patients susceptible to developing anaemia also suffer chronic cardiac injury, with a persistent leak of cTn. Occult gastrointestinal bleeding may also explain the low haemoglobin levels in some patients. How this should promote cTn leak is not obvious, apart from the reduced oxygen delivery.
The absence of any association between the hs-cTnT pattern and kidney function was somewhat surprising, as in clinical practice, moderately elevated cTn concentrations are often attributed to kidney failure. This lack of association may be due to the observation that most of the patients had relatively normal kidney function.
We found that only 10% of patients reported chest pain on admission. This is in contrast to 51%, as reported by McAllister et al,17 who performed a very thorough patient interview with particular focus on chest pain. We do admit that a more thorough examination may have resulted in a higher proportion of patients with chest pain or discomfort in our material, and the proportion of patients satisfying the MI criteria thus could have been higher. In contrast to McAllister, we did not retrieve serial ECG recordings. We did record the established ECG criteria of ischaemia, but the ST-T changes may be unspecific, resulting in false positive measures of ischaemia. On the other hand, the old ECG changes may mask current ischaemia, resulting in false negatives, and patients with no prior CVD may present with MI and a normal ECG.
Limitations
The study sample is small but unselected. As is evident from the supplementary figure, 49% of the preliminarily included in patients were not approached for consent. The primary reason was the research fellow's absence during weekends and holidays, which we believe to be independent of the individual patient's clinical status. Moreover, the demographics and clinical status of our cohort are comparable to those in other AECOPD studies.16 ,19 ,32 Hence, we believe our cohort may be considered a random sample from the source population. Not all (83 of 99) included patients had serial measurements of hs-cTnT. Failure to obtain blood on subsequent days was primarily for administrative reasons. Nevertheless, there was a difference in age (but no other investigated variables) among patients with one and more than one hs-cTnT sample. In what way it would influence our results had all patients had serial measurements, will remain unknown. That we, despite the relatively low number of patients, identified significant associations with mortality means that these are consistent in this material, and may also indicate that our results can be applicable and relevant in a clinical setting. Still, our findings should be verified in larger cohorts.
One might argue that the patients with a dynamic hs-cTnT pattern have a better prognosis because they were regarded as patients with MI and treated as such, whereas patients with stable hs-cTnT elevations received less treatment directed towards their cardiovascular system. Importantly, as the blood samples were not analysed until years after inclusion, the treating physicians were blinded to the hs-cTnT results. Although some patients did have fourth generation cTnT measured at the discretion of the physicians, the recorded diagnoses at discharge and medication use both at discharge and at subsequent admissions (data not shown) do not suggest any such bias in the analysis.
The intervals between the blood sampling were not standardised, and the time between the two first hs-cTnT measurements may vary several hours between patients. In most patients with a dynamic hs-cTnT pattern, the rise of fall occurred between the first and second measurements (figure 1). When the time between the first two measurements was long, a transient rise and fall may have been missed, misclassifying dynamic patterns as stable. It is unclear whether, and to what extent, this potential error has inflated or attenuated the difference between the groups.
We defined a dynamic hs-cTnT pattern as a ΔTnT ≥20%. With very low concentrations, a higher δ value may be needed for the measurements to reliably represent a change.29 Using a higher δ value to define a rise/fall, the estimated HR will move towards 1 (data not shown). We chose 20% as it is recommended in the literature,27 ,28 and patients with concentrations in the low levels, where higher δ values are recommended, were not included in this study.
At the baseline, there were no significant differences in smoking habits between the groups. We did not record smoking cessation during follow-up, however, and do not know to what extent that may have influenced the results.
Future studies investigating cardiac biomarkers in patients with COPD should include echocardiography, which may provide valuable haemodynamic data from both the right and left heart.
Conclusion
Among the patients with at least one hs-cTnT above the 99th centile, 82% had a rise/fall pattern, as requested to make a diagnosis of MI. Compared to a rise/fall pattern of hs-cTnT, a stable and moderately elevated hs-cTnT during AECOPD is associated with poor long-term prognosis, also after adjustment for medical history, kidney function and NT-proBNP.
Acknowledgments
The authors would like to thank Dr Lars Øivind Høiseth, Ullevål University Hospital, for analysing the ECGs and Dr Bo Daniel Karlsson, Akershus University Hospital, for analysing the chest radiographs.
References
Supplementary materials
Supplementary Data
This web only file has been produced by the BMJ Publishing Group from an electronic file supplied by the author(s) and has not been edited for content.
Files in this Data Supplement:
- Data supplement 1 - Online supplement
Footnotes
-
Funding The study was financed by The Norwegian Association of Heart and Lung Patients and EXTRA funds from the Norwegian Foundation for Health and Rehabilitation.
-
Competing interests TO has received speaker's honoraria from Abbott Diagnostics, Siemens Healthcare Diagnostics and Roche Diagnostics; and research grant support from Abbott Diagnostics and Roche Diagnostics through Akershus University Hospital.
-
Data sharing statement No additional data are available.