Article Text

Abstract
Background Cardiovascular disease (CVD) is the single largest contributor to global mortality. Premature mortality due to CVD results in a loss of productivity, with associated economic and policy implications that are often overlooked.
Methods A human capital approach was adopted to project the long-term impacts of Australian CVD deaths in 2003 on labour force participation and the present value of lifetime income (PVLI) forgone. Impacts were modelled to the year 2030 and accounted for individual characteristics at the time of death including age, sex and socioeconomic status.
Results Premature deaths due to CVD in 2003 accounted for 51 659 working years and $2.69 billion in PVLI forgone when modelled to 2030 (95% CI $2.63 billion to $2.75 billion). The labour force impacts were highest for individuals aged between 35 and 64 at the time of death, and male deaths accounted for 87% of the total PVLI loss. The most costly disease type was ischaemic heart disease, followed by stroke and inflammatory heart disease. Deaths occurring in individuals residing in the most socioeconomically disadvantaged areas at the time of death had a disproportionately large impact on the total PVLI loss.
Conclusions This study quantifies the relative productivity costs of CVD mortality across a range of disease types and socioeconomic groups. The magnitude of these costs highlights the scope for investments in effective healthcare interventions to provide positive economic returns and may assist decision makers in allocating resources among competing priorities.
- heart failure
- hypertensive heart disease
- myocardial ischaemia and infarction (IHD)
- peripheral vascular disease
- public health
This is an open access article distributed in accordance with the Creative Commons Attribution Non Commercial (CC BY-NC 4.0) license, which permits others to distribute, remix, adapt, build upon this work non-commercially, and license their derivative works on different terms, provided the original work is properly cited, appropriate credit is given, any changes made indicated, and the use is non-commercial. See: http://creativecommons.org/licenses/by-nc/4.0
Statistics from Altmetric.com
- heart failure
- hypertensive heart disease
- myocardial ischaemia and infarction (IHD)
- peripheral vascular disease
- public health
Key questions
What is already known about this subject?
Over the past decade, there has been an increasing recognition of the productivity-related costs of disease. In the context of cardiovascular disease (CVD), a small number of published studies have found these productivity costs to be significant, accounting for between 21% and 63% of the full economic burden of disease.
While differences in mortality from CVD between socioeconomic groups have been demonstrated in many countries, the methods applied in previous studies estimating the productivity costs of CVD have not accounted for these differences.
What does this study add?
This study estimates the productivity costs of CVD mortality across a range of socioeconomic groups, taking into account the inherent variation in wage rates, labour force participation rates and retirement ages.
We provide estimates of the productivity impacts of mortality for less prevalent types of CVD that have not been previously reported, including aortic aneurysm, inflammatory heart disease, non-rheumatic valvular disease, peripheral vascular disease and rheumatic heart disease.
This is also the first study to produce estimates of the productivity costs associated with CVD mortality in an Australian setting.
How might this impact on clinical practice?
Our results highlight the costs associated with CVD mortality within a context of economic productivity, and in doing so demonstrates the potential for investments in preventive health to yield positive economic returns.
The explicit recognition of productivity costs suggests that Governments could place an increased value on interventions that effectively treat or prevent CVD, as a means of improving both health and economic outcomes. This may in turn result in increased resources being diverted to policies and interventions aimed at CVD prevention and control.
Introduction
Cardiovascular disease (CVD) is the leading cause of death internationally, accounting for approximately one-third of deaths worldwide.1 Over the next decade, premature deaths from CVD, defined as deaths occurring before the average life expectancy, are expected to climb from 5.9 million in 2013 to 7.8 million in 2025.2 As a result, many United Nations member states will not meet targets set in 2013 as part of a global action plan to address non-communicable diseases, which includes reducing premature deaths from CVD by 25% by 2025.3
While CVD is one of the most costly diseases in terms of healthcare resource use, premature mortality due to CVD also has a significant impact on a nation’s productivity with associated economic and policy implications. Accounting for the full extent of societal costs, including productivity costs, is considered the gold standard in healthcare costing studies.4 However, productivity costs have been largely been excluded from previous cost of illness studies and as a result have not been able to influence healthcare decision making.
Three recent studies have estimated the full economic burden of CVD for the USA, UK and European Union (EU).5–7 These studies included productivity costs associated with both morbidity and mortality, as well as direct healthcare resource use and the costs of informal care. Productivity costs were estimated as accounting for between 21% and 63% of the full economic burden of disease across the studies. Costs were estimated for CVD in its entirety, with the UK and EU studies disaggregating results to coronary heart disease (CHD) and stroke,6 7 and the US study also reporting on hypertension and heart failure.5 However, the productivity impacts associated with mortality in less prevalent types of CVD have not been previously reported.
Differences in mortality from CVD between socioeconomic groups have been demonstrated in many countries.8 9 In Australia, death rates from CVD in the lowest socioeconomic group are 50% higher than those in the highest group.10 This is a potentially important factor in determining the productivity impacts, given the inherent variation in wage rates, labour force participation rates and retirement ages. However, due to a lack of individual data, the aggregate costing methods applied in previous studies estimating the productivity costs of CVD have not been able to account for these differences. Given the disproportionate mortality rates experienced by lower socioeconomic groups, the use of an average wage rate to estimate productivity costs may not be appropriate.
The aim of this study was to generate comprehensive and reliable estimates of the productivity costs of premature mortality due to CVD across a range of disease types and socioeconomic groups, to inform priorities for healthcare decision making. Using a microsimulation model of Australian mortality, we were able to project the long-term impacts of all CVD deaths that occurred in 2003. The use of microsimulation techniques allowed for impacts to be modelled on an individual basis, and therefore enabled the socioeconomic status of each individual at the time of their death to be explicitly accounted for. Outcomes were modelled to the year 2030 and are reported in terms of the working years lost and present value of lifetime income (PVLI) lost. We report on the impacts of CVD in aggregate as well as for the eight most prevalent disease types.
Methods
We adopted the human capital approach, where productivity losses are valued as the lifetime stream of income forgone due to a premature death.11 This method has its foundations in the early cost of illness methodology12 and it remains the dominant approach in the recent literature.5–7 13 We limited our perspective to the productivity costs associated with paid labour and excluded unpaid labour as well as costs that fall in other sectors including the healthcare system. Government transfer payments were also excluded to avoid double-counting these flows of income at the macroeconomic level, consistent with established methodology.14
CVD deaths were extracted from a population mortality dataset that contained information on the personal characteristics and underlying cause of death for every individual whose death was officially registered in 2003. For the purpose of this study, we determined a death to be premature if it occurred before average Australian life expectancy of 80 years.15 16 CVD was defined by the WHO International Classification of Diseases, 10th revision (ICD-10) codes I05–71.17 By applying the underlying cause of death, we were able to avoid double counting deaths that may have had multiple causes or associated causes.
To project the long-term productivity impacts of premature CVD deaths, we used a microsimulation model, LifeLossMOD, which was previously developed to estimate the productivity impacts of all cause premature mortality. The model was designed to assign an alternative lifespan to each death that occurred in 2003, taking into account an individual’s characteristics at the time of death. These alternative lifespans were assumed to represent a counterfactual scenario whereby deaths in 2003 were prevented. A detailed description of the methods used to develop the model can be found in Carter et al 18 and is summarised below.
Developing the model
LifeLossMOD was built around a population mortality dataset that contained information on the age, sex, area of usual residence and underlying cause of death for every individual whose death was officially registered in 2003. These data were obtained from the ‘Burden of Disease and Injury in Australia 2003’ study and was the most recent source of individual-level mortality data available.19 To extract further meaning from the area of usual residence information, this variable was converted to a socioeconomic index for areas (SEIFA) quintile. SEIFA is a metric that ranks areas in Australia according to relative socioeconomic advantage and disadvantage based on information from the 5 yearly Census.20
Counterfactual lifespans were then applied to the mortality records using data from a separate population microsimulation model, APPSIM. APPSIM was developed in collaboration with a number of Australian government departments in response to growing concerns about structural population ageing.21 The model uses a 1% representative sample of the 2001 Australian Census as its base population and then applies a series of probabilities to this cohort to annually update the population’s characteristics up to the year 2030. The transition probabilities applied are based on data from large longitudinal survey datasets22 23 as well as official demographic data and projections.24
The process of assigning counterfactual lifespans from APPSIM to each CVD death consisted of two steps. First, individuals in the 2003 mortality dataset and the 2003 APPSIM population were grouped into homogenous cells or ‘bins’, based on each available combination of age category, sex and SEIFA quintile. In the second step, each mortality record within a particular bin was matched at random with an individual from the APPSIM dataset that appeared in the same bin to reflect the likely similarities across individuals of the same age, sex and socioeconomic status. It was then assumed that each mortality record would adopt the same series of lifetime outcomes as the individual to which they had been matched, including their annual hours worked, income earned, age at retirement and age at death. This enabled us to avoid applying broad assumptions around average wages, traditional retirement ages and average life expectancy. Instead, these outcomes were projected based on an individual’s personal characteristics, taking into account expected population trends. Further detail on how these trends were modelled in APPSIM is available in online supplementary file 1.
Supplemental material
To allow for the effects of uncertainty in the matching of records, this process was replicated 100 times to create 100 uniquely linked datasets. These 100 simulated datasets are what comprises LifeLossMOD. The results contained throughout this paper report the mean of the 100 datasets. Where present, 95% CIs have been calculated using the percentile method.
Estimating the productivity impacts of premature mortality
The projected labour force participation forgone due to premature CVD mortality in 2003 was estimated by accumulating the total hours worked by each individual in the model over the period from 2003 to 2030. For each individual, a full time equivalent working year was derived by dividing the accumulated number of hours worked by the number of hours in a standard Australian working year (1976 hours).25
The productivity related impacts of premature CVD mortality were estimated by deriving the PVLI forgone. The PVLI represents the lifetime stream of private income an individual is expected to earn, valued in today’s currency. The estimate includes earnings from wages and salaries as well as private income generated from other sources including business profits and investments. The modelled income from APPSIM records in 2003 was adopted in the base year. Income was then recalculated on an annual basis for each individual and was assumed to grow at a rate of 1% per annum (in real terms).26 A discount rate of 3% was then applied, and the resulting PVLI estimates figures were inflated from AUD 2010 to AUD 2018 using the national Consumer Price Index.27
Results
There were a total of 18 450 premature deaths due to CVD in 2003, of which approximately two thirds were male (table 1). This translated to a total of 306 754 counterfactual years of life lost when modelled to 2030. Deaths in individuals aged 64–80 accounted for 73% of all premature deaths.
Age group, sex and years of life lost for the 2003 mortality cohort, modelled to 2030
The labour force analysis revealed that 51 659 full time working years were lost due to premature mortality, with female deaths accounting for just 16% of these (figure 1). While deaths occurring between the ages of 35 and 64 were responsible for the greatest labour force impact, deaths in individuals beyond the traditional retirement age of 65 accounted for 13% of the total working years lost.

Working years forgone due to premature mortality from cardiovascular disease in 2003, modelled to the year 2030. Blue bar, males; orange bar, females.
The accumulated lifetime income forgone due to premature mortality was estimated to be $2.69 billion (95% CI $2.63 billion to $2.75 billion) (table 2). Male deaths accounted for a significantly greater proportion of costs, which was driven by the higher number of male deaths (table 1) as well as higher levels of labour force participation, hours worked and wages among men.28 The ranking of PVLI losses across disease types were broadly consistent between men and women. Ischaemic heart disease, also known as CHD, accounted for 65% of the total PVLI loss, followed by stroke (15%) and inflammatory heart disease (7%). Across both men and women, inflammatory heart disease was found to be the most costly disease type per death. Income losses by individuals working beyond the traditional retirement age accounted for approximately 19% of the total PVLI.
Cumulative productivity costs of premature mortality due to cardiovascular diseases in 2003, modelled to 2030
An analysis of premature deaths by SEIFA quintile revealed that individuals classified as living in the 20% least socioeconomically disadvantaged areas at the time of their death accounted for just 8% of the total PVLI loss due to premature CVD mortality, despite these individuals having a median income almost three times that of the most disadvantaged quintile (table 3). Those living in the 40% most disadvantaged locations accounted for 52% of the total PVLI loss.
Analysis of premature deaths and their PVLI impact by socioeconomic index for areas (SEIFA) quintiles
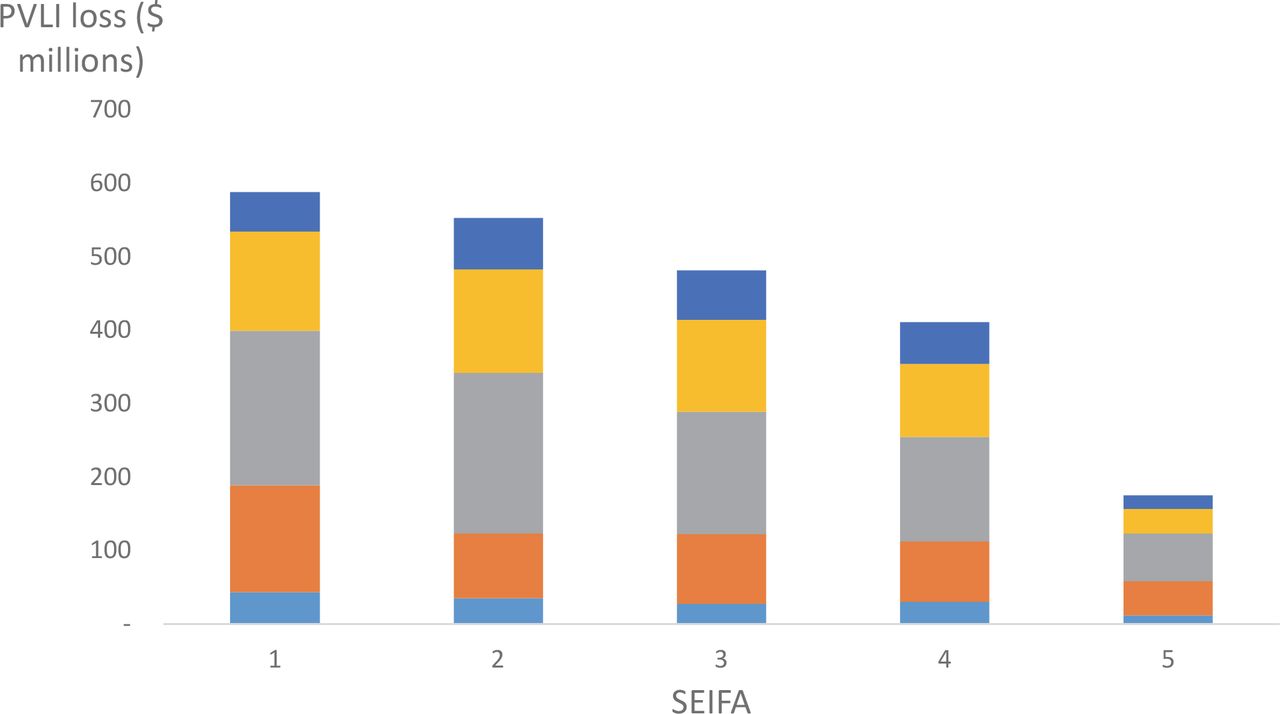
Figure 2 presents the distribution of PVLI losses across SEIFA groups, stratified by age categories. These distributions did not differ significantly between men and women.

Present value of lifetime income lost due to premature mortality: distribution across SEIFA quintiles and age categories. Age categories from bottom to top: 25-34, 35-44, 45-54, 55-64, 65-80. PVLI, present value of lifetime income; SEIFA, socioeconomic index for areas.
Discussion
This paper quantifies the productivity costs of premature CVD deaths in Australia and describes how these costs are distributed across various age, sex, socioeconomic status and disease categories. It is the first study to analyse the productivity impacts of CVD mortality across socioeconomic subgroups and for less prevalent types of CVD including aortic aneurysm, inflammatory heart disease, non-rheumatic valvular disease, peripheral vascular disease and rheumatic heart disease.
When projected to 2030, we found that premature CVD mortality in 2003 accounted for 51 659 working years lost and $2.69 billion in PVLI lost. For perspective, this translated to 2.9% of the health budget and 0.3% of total GDP in 2003 after adjusting for inflation.29 30 Ischaemic heart disease and stroke accounted for a combined 80% of the total PVLI loss, which was consistent with the proportion of deaths in these categories. However, when the average cost per death was considered, inflammatory heart disease and rheumatic heart disease were the most costly. This may be explained by younger age of death in these categories; relative to the average age of 64.8 across all premature CVD deaths, premature deaths from inflammatory heart disease occurred at an average age of 58.8 and rheumatic heart disease at 61.1.
There are relatively few studies evaluating the productivity costs of premature CVD mortality available for comparative purposes. A 2006 study estimated the economic burden of CVD across the European Union and found that CVD mortality accounted for 2.18 million working-years lost and €24.4 billion in lifetime earnings forgone.7 A similar study estimated the costs of CVD mortality in the UK to be 2 44 398 working years and £3.94 billion in earnings forgone.6 As the number of premature deaths included in these studies was not reported, it was not possible to compare an average cost per premature death. However, a comparison of the costs per national capita revealed that, when converted to 2015 Australian dollars, premature mortality due to CVD represented a cost of $80 per capita on average across the EU and $212 per capita in the UK. Given the consistent methodological approach applied in these studies, these results highlight the importance of accounting for country-specific factors in estimating the productivity costs of mortality including mortality rates, population age structure, labour force participation and wage rates.
Our estimate of PVLI loss for Australia converts to approximately $130 per capita. While our broad methodological approach was consistent with the EU and UK studies, there were also some differences which mean these figures cannot be directly compared. Specifically, our analysis was truncated at 2030 regardless of the age at death, we allowed for individuals to continue working beyond the traditional retirement age in line with projected trends and we accounted for private income from sources other than wages alone, including business profits and investments.
Another methodological difference in our study was the use of microsimulation methods to model the outcomes of premature mortality. This represents a key advance as, while previous studies have applied population wage and participation rates to aggregate age and sex categories, we were able to project impacts on an individual level. As a result, we were able to account for data on socioeconomic status, along with age and sex, as an individual dimension in estimating the number of hours worked and income earned. This is particularly important given the large body of evidence which demonstrates that lower socioeconomic groups have a higher prevalence of CVD risk factors as well as a higher incidence of disease and higher mortality rates.9
When analysing the impacts of CVD mortality across socioeconomic groups, we found that individuals who lived in the 20% least socioeconomically disadvantaged areas accounted for just 8% of the total PVLI loss (table 3). This was due to the lower proportion of CVD deaths in this group (14%) combined with a lower rate of labour force participation, most likely driven by a significantly higher age at death relative to the other SEIFA quintiles. Our analysis was consistent with data which indicates death rates from CVD disproportionately affect the lowest socioeconomic group, and our results highlight the flow-on affect this has in terms of productivity costs, even despite the lower average wage rates reported in this group. Interestingly, the inclusion of analysis by socioeconomic group does not in fact emphasise the need for prevention in more advantaged groups, a concern sometimes raised about using individual level incomes rather than average wages. Table 3 shows that the proportion of total PVLI lost was 27% from the lowest quintile and only 8% from the highest quintile. Although the median income at age of death is $47 000 in the highest quintile compared with $16 000 in the lowest quintile, this was more than counterbalanced by the mean age of death being 63 years in the lowest quintile compared with 69 years in the highest quintile.
Our analysis was limited by the accuracy with which individuals in the population mortality dataset were ‘matched’ to similar individuals in the APPSIM microsimulation model. The matching process could be further improved by accounting for other variables collected at the time of death including marital status and occupation; these variables were not available for release on an individual level at the time of publication. In order to address potential variance in the matching process, we replicated the process 100 times to create 100 unique simulations. The results presented here are the mean of the 100 simulations along with CIs where appropriate. The relatively narrow CIs produced indicate that our results are robust to the effects of uncertainty in the record matching process.
A further limitation is that the SEIFA index can only be viewed as a proxy for an individual’s socioeconomic status. While the index describes the socioeconomic status of the location where an individual resides, it does not account for the natural variation among the socioeconomic status of individuals and households within a given location. The truncation of our analysis at the year 2030 was necessary as this was the last available year of APPSIM projections. Our results may therefore underestimate the full extent of the productivity costs, particularly for individuals who died of CVD before the age of 35 and therefore would not have reached the traditional retirement age before this truncation. However, deaths occurring before the age of 35 represented less than 1% of all premature deaths which, combined with the annual discounting of future outcomes by 3%, is likely to have a negligible impact on the results we have reported. It is also important to note that our analysis only models the impact of deaths occurring in the year 2003; the productivity costs of deaths occurring in subsequent years are not captured.
By reducing the burden of disease, healthcare investment may stimulate economic growth and in turn further raise societies’ abilities to continue to invest in public health.31 Estimates have shown that over 70% of CVD deaths are attributable to a small number of known modifiable risk factors including tobacco use, unhealthy diet and obesity, physical inactivity and harmful use of alcohol.32 This suggests a significant potential for preventive healthcare interventions to reduce CVD incidence and mortality. Many such interventions are known to be effective and cost-effective.33 34 However, increasing CVD mortality rates in both developing and developed countries suggest that there is a disproportionate investment in sustainable health policies to address and curtail these risk factors.35
Our results contribute to a small but growing body of research highlighting the productivity costs associated with CVD mortality. This information is important as it highlights the potential for investments in preventive health to yield positive economic returns. For example, it can be determined from our results that a once-off 2% decrease in premature mortality from ischaemic heart disease would generate economic gains of $34.9 million per annum. If this decrease could be sustained, the effects of compounding would lead to an estimated $3.3 billion in productivity gains over 10 years. A greater awareness of these likely economic gains may in turn lead healthcare funders and policymakers to place an increased value on preventive CVD interventions as a means of improving the health and the productivity of a nation.
This study provides a comprehensive overview of the productivity costs associated with CVD mortality in Australia, and the first estimates of these costs for a number of less common types of CVD. The productivity losses we report are substantial and highlight the potential for effective healthcare interventions to generate positive economic outcomes. The distributional analyses we have presented across age, sex, disease and socioeconomic categories provide data that may assist decision makers in prioritising resource allocation.
Acknowledgments
The authors thank S. Kelly for the provision of data from the APPSIM microsimulation model and T. Vos for the provision of Australian mortality data.
References
Footnotes
Funding Work associated with this manuscript was funded by an Australian Research Council grant: Long term economic impacts of disease on older workers to 2030: Costs to government and individuals and opportunities for intervention; Schofield D, Passey M, Kelly S, Vos E, Tanton R; Australian Research Council (ARC)/Linkage Projects [(LP) 100100158]. The funding body had no influence over the study design, analysis, interpretation or reporting.
Competing interests None declared.
Patient consent for publication Not required.
Provenance and peer review Not commissioned; externally peer reviewed.
Data sharing statement The full deidentified dataset is available from the corresponding author on request.