Article Text

Abstract
Objective Left atrial (LA) maximum volume (LAVmax) is an indicator of left ventricular (LV) diastolic function. However, LAVmax is also influenced by systolic events, whereas the LA minimum volume (LAVmin) is directly exposed to LV pressure. The authors hypothesised that LAVmin may be a better correlate of LV diastolic function than LAVmax.
Design Cross-sectional.
Setting University hospital.
Patients 357 participants from a community-based cohort study.
Methods LA volumes and reservoir function, measured as total LA emptying volume (LAEV) and LA emptying fraction (LAEF), were assessed by real-time three-dimensional echocardiography. LV diastolic function was assessed by trans-mitral early (E) and late (A) Doppler velocities and mitral early diastolic velocity by tissue-Doppler (e'). LV systolic function was assessed by LV ejection fraction (LVEF) and global longitudinal strain (GLS) by speckle-tracking.
Results LAVmin significantly increased with worsening diastolic dysfunction (p<0.001), whereas the increase in LAVmax was less pronounced (p=0.07). LAEV and LAEF decreased with worsening diastolic dysfunction (both p<0.001). In linear regressions, LAVmin and LAVmax were significant predictors of E/e', with higher parameter estimates for LAVmin. In multivariate models, LAVmin resulted strongly associated with E/e' (β=0.45, p<0.001), whereas LAVmax was not (β=−0.16, p=0.08). LA reservoir function was better associated with GLS than LVEF. In multivariate analyses, GLS was significantly associated with LAVmax (β=−0.15, p=0.002), LAEV (β=−0.37, p<0.001) and LAEF (β=−0.28, p<0.001) but not with LAVmin.
Conclusions LAVmin is a better correlate of LV diastolic function than LAVmax. The impact of LV longitudinal systolic function on LA reservoir function might explain the weaker relation between LAVmax and LV diastolic function.
- Left atrium
- diastole
- systole
- three-dimensional echocardiography
- speckle-tracking echocardiography
- echocardiography
- cardiac function
- diastolic dysfunction
- systolic dysfunction
- three dimensional
- echocardiography (transoesophageal)
- cardiac ultrasound
- stroke
Statistics from Altmetric.com
- Left atrium
- diastole
- systole
- three-dimensional echocardiography
- speckle-tracking echocardiography
- echocardiography
- cardiac function
- diastolic dysfunction
- systolic dysfunction
- three dimensional
- echocardiography (transoesophageal)
- cardiac ultrasound
- stroke
Left atrial (LA) size is a predictor of adverse cardiovascular outcome both in the general population and in selected clinical conditions.1–7 The left atrium acts as a reservoir during systole, as a conduit during early diastole and diastasis, and as an active pump during late diastole. Since during diastole the LA is directly exposed to the left ventricular (LV) cavity pressure, the progressive impairment of LV diastolic function, and the consequent increase in LV end-diastolic pressure, determine an increase in LA size and a reduction of both the LA passive emptying and conduit functions, with a compensatory increase of the active LA emptying, at least in the first stages of LV diastolic dysfunction.8 9 For these reasons, LA size is considered a robust marker of LV filling pressure, not strongly dependent on short-term changes in preload.10 11
By general consensus, LA size is measured at the end-systolic phase of the cardiac cycle, when its dimension is greatest.12 However, this LA maximum volume (LAVmax) is also influenced by the mechanical traction of the LV longitudinal fibres, which causes the systolic descent towards the apex of the mitral valve plane and the subsequent stretching of the LA resulting in an active suction of blood in the atrium from the pulmonary veins.13 14 Hence, the LV longitudinal systolic function might have an impact on the LA reservoir function and be a determinant of the LA end-systolic dimension. We hypothesised, therefore, that the relationship between LA volume and LV diastolic function might be weaker in end-systole than in end-diastole, and that LA minimum volume (LAVmin) could be a stronger correlate of LV diastolic function than LAVmax. Accordingly, the aim of our study was to evaluate the relationship between LV diastolic function and LAVmin and LAVmax, assessed by real-time three-dimensional (3D) echocardiography. Additionally, we explored the impact of LV global and longitudinal systolic function on LA phasic volumes.
Methods
Study population
The study population of the present report derives from the Cardiac Abnormalities and Brain Lesion study, a community-based epidemiological study whose primary aim was to investigate the prevalence, risk factors and possible cardiac predictors of silent brain infarcts in the community. The Cardiac Abnormalities and Brain Lesion study based its recruitment on the Northern Manhattan Study. The study design and recruitment details regarding the Northern Manhattan Study have been described previously.15 Informed consent was obtained from all study participants. The study was approved by the Institutional Review Board of Columbia University Medical Center.
Risk factors assessment
Cardiovascular risk factors were ascertained through direct examination and interview by trained research assistants. Hypertension was defined as systolic blood pressure ≥140 mm Hg or diastolic blood pressure ≥90 mm Hg at the time of the visit (mean of two readings), or patient's self-reported history of hypertension or of anti-hypertensive medications. Diabetes mellitus was defined as fasting blood glucose ≥126 mg/dl or patient's self-reported history of diabetes or of diabetes medications. Hypercholesterolaemia was defined as total serum cholesterol >240 mg/dl, a patient's self-report of hypercholesterolaemia or of use of lipid-lowering treatment. Coronary artery disease was defined as a history of myocardial infarction, coronary artery bypass grafting, percutaneous coronary intervention, typical angina or use of anti-ischaemic medications. Non-sinus rhythm at the time of the echocardiogram, history of atrial fibrillation or atrial flutter, presence of cardiac valve prosthesis, more than mild mitral or aortic valve regurgitation and valve stenosis were considered exclusion criteria from the analysis.
Echocardiographic assessment
Two-dimensional echocardiography
Transthoracic echocardiography was performed using a commercially available system (iE 33, Philips, Andover, Massachusetts, USA) by a trained, registered cardiac sonographer according to a standardised protocol. LV end-diastolic diameter, inter-ventricular septum thickness and posterior wall thickness were measured according to the recommendations of the American Society of Echocardiography.12 LV mass was calculated with a validated method16 and indexed by body surface area. LV ejection fraction (LVEF) was calculated using the biplane modified Simpson's rule.
LV diastolic function assessment has been previously described in detail.17 18 Briefly, trans-mitral diastolic flow was obtained from an apical four-chamber view. Colour Doppler was used to visualise the trans-mitral flow; the pulsed Doppler sample volume was placed perpendicular to the inflow jet, at the level of mitral valve leaflet tips. Mitral annular velocities were evaluated by tissue-Doppler imaging and sampled on the longitudinal axis from the apical four-chamber view. Peak velocities of the early (E) and late (A) phases of the mitral inflow from Doppler recordings were measured and their ratio (E/A) was calculated; the peak early diastolic velocity (e') of the lateral and the septal mitral annulus by pulsed-tissue-Doppler imaging were measured and the average value was calculated and considered in all subsequent analyses. The E/e' ratio was calculated and used as an index of LV filling pressure.19 Diastolic dysfunction was graded as: E/A ≤0.7 (impaired relaxation, grade 1); E/A >0.7 and ≤1.5 and e' <7 cm/s (pseudo-normalised pattern, grade 2); or E/A >1.5 and e' <7 cm/s (restrictive pattern, grade 3).17 18
Three-dimensional echocardiography
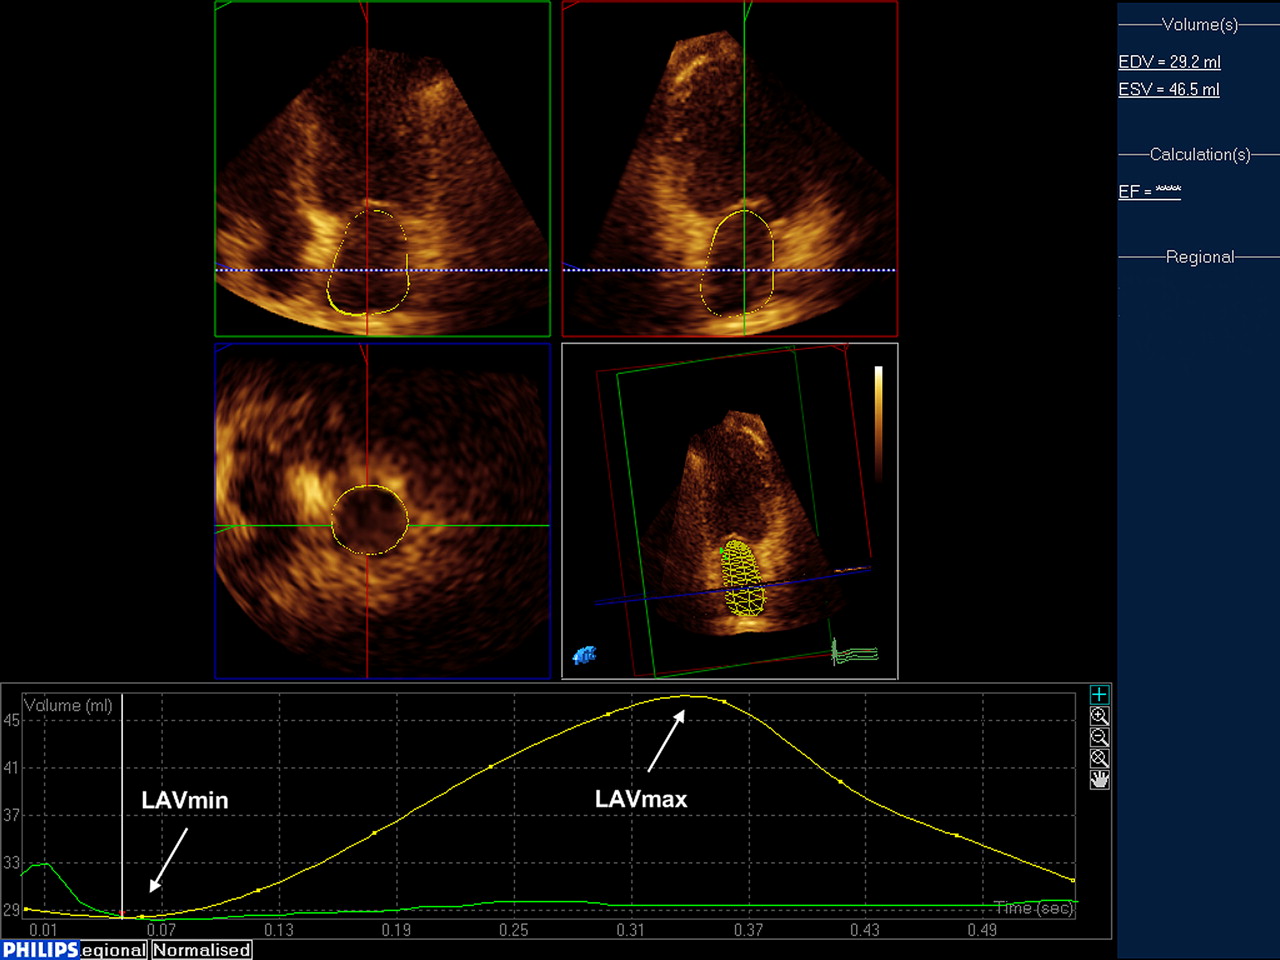
LA volume measurements were performed by real-time three-dimensional (3D) echocardiography. A full volume loop was acquired from an apical window using an X3-1 matrix array transducer over four cardiac cycles. Measurements of 3D LA volumes were performed offline using commercially available software (QLAB Advanced Quantification software, V.8.1, Philips). A detailed description of the technique has been reported previously.20 Briefly, five anatomical landmarks (septal, lateral, anterior and inferior mitral annulus, and posterior wall of the LA) were manually identified by the operator, semi-automated border detection was performed by the software, and LA borders were tracked throughout the entire cardiac cycle (figure 1). Manual correction on all possible 3D planes was performed by the reader in case of inaccurate endocardial automated detection. All LA volume measurements and subsequent derived parameters were indexed by body surface area. The parameters of LA size and function included in our analyses were:
LA minimum volume (LAVmin): LA end-diastolic volume at the first frame after mitral valve closure.
LA maximum volume (LAVmax): LA end-systolic volume right before mitral valve opening.
LA total emptying volume (LAEV): LAVmax − LAVmin.
LA total emptying fraction (LAEF): 100 × (LAVmax − LAVmin)/LAVmax.
LA conduit volume (LACV): LV stroke volume − LAEV.

Left atrial (LA) phasic volumes by real-time three-dimensional echocardiography. Arrows indicate LAVmax and LAVmin.
Speckle tracking imaging
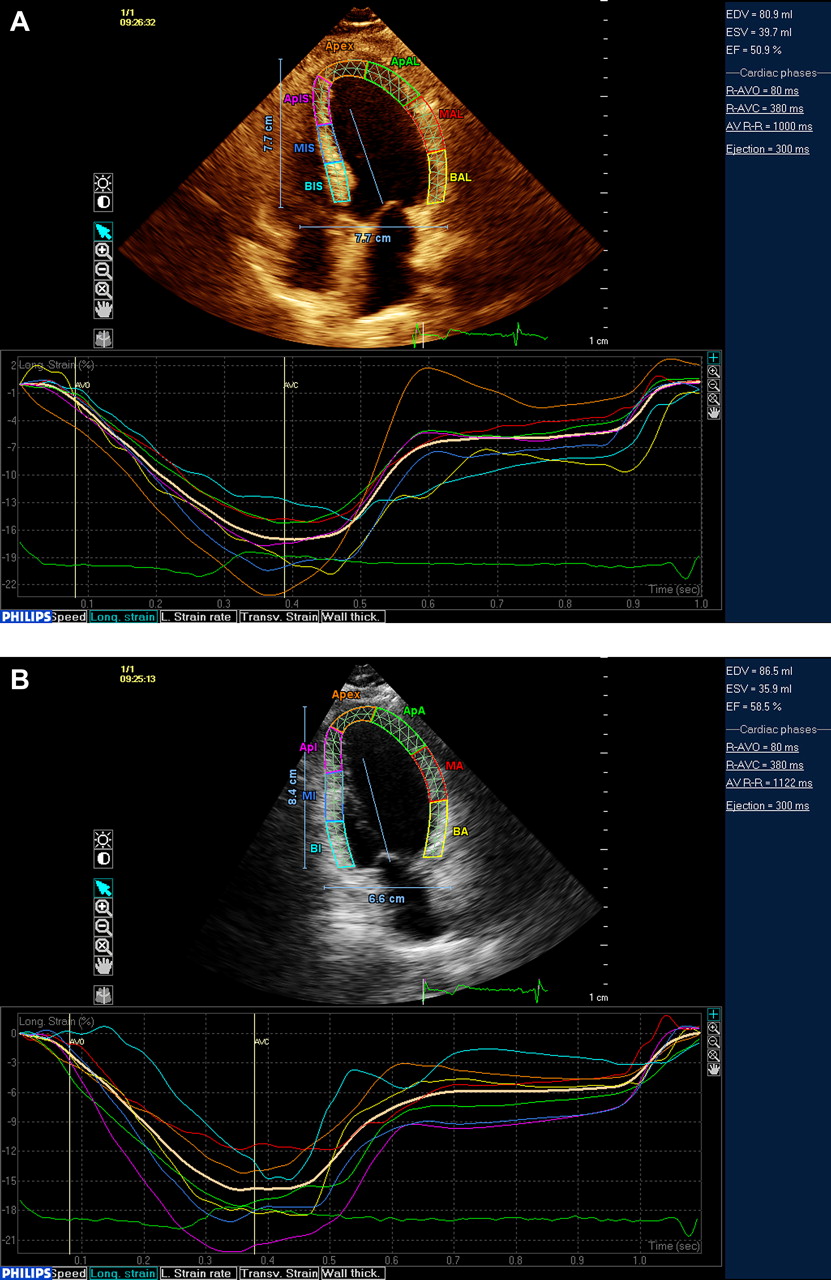
Speckle tracking analysis was performed offline using commercially available software (QLAB Advanced Quantification Software V.8.1, Philips). The software uses an image-processing algorithm to analyse myocardial motion by a frame-to-frame tracking of stable patterns of pixels (‘speckles’) in two-dimensional (2D) grey-scale image loops. From three manually selected landmark points (lateral and septal mitral annulus and LV apex) in apical views, endocardial borders are automatically detected by the software, and each wall is divided into three segments (basal, mid and apical). Manual correction was performed when LV wall was not correctly sampled. Subsequently, automatic tracking of myocardial speckles was performed throughout the whole cardiac cycle. Strain curves were visualised for each segment, and the average peak systolic strain was calculated. Systolic global longitudinal strain (GLS) was calculated averaging peak longitudinal strain of the 12 segments from the apical four-chamber and two-chamber views (figure 2A,B). Three cycles were recorded at a frame rate ≥45 fps, and were averaged for strain analysis. Aortic valve opening and closing times were measured from the LV outflow Doppler profile and were incorporated in the speckle-tracking strain profile in order to consider only peak systolic strains and to exclude post-systolic components.

Left ventricular (LV) systolic function assessment by speckle-tracking echocardiography. LV longitudinal strain was measured from the apical four-chamber (A) and two-chamber (B) views and averaged over 12 segments.
Statistical analysis
Data are presented as means ± SD for continuous variables and as proportions for categorical variables. Differences between groups in continuous variables were assessed by the Kruskal–Wallis test. Univariate correlations between variables were assessed by Pearson's correlation coefficients (r). Linear regression analyses were used to assess the independent association of LA volumes with LV diastolic function. Variables were log-transformed to confirm linear regressions when normality assumptions were not met. Reproducibility of the measurements was assessed by intra-class correlation coefficients and by calculating the mean and SD of the difference between two measurements. Overall performance of LA parameters in diagnosing diastolic dysfunction was assessed calculating for each parameter the area under the curves (AUC) of receiver operating characteristic. For all statistical analyses, a two-tailed p<0.05 was considered significant. Statistical analyses were performed using SPSS software V.17.0 (SPSS Inc.).
Reproducibility of LA volumes
Reproducibility of LA volume measurements was assessed in 15 randomly selected subjects. LAVmin and LAVmax were re-measured by the original reader blinded to the first measure. Intra-class correlation coefficients were 0.96 for LAVmin (95% CIs 0.88 to 0.99) and 0.94 for LAVmax (95% CIs 0.85 to 0.98). The mean difference between two measurements was 0.13±1.79 ml/m2 for LAVmin (p=0.78) and 0.42±2.29 ml/m2 for LAVmax (p=0.49).
Results
LA phasic volumes and LV diastolic function
Clinical and echocardiographic characteristics of the 357 study participants are shown in table 1. Diastolic dysfunction of any grade was present in 177 individuals (49.6% of the study sample). Among those with diastolic dysfunction, impaired relaxation (grade 1) was present in 113 (63.8%), a pseudo-normal pattern (grade 2) was present in 59 (33.3%), and a restrictive pattern (grade 3) was present in 5 (2.8%). LA volumetric parameters by diastolic dysfunction categories are presented in table 2. LAVmin showed a significant increase with worsening diastolic dysfunction (p<0.001), whereas the increase in LAVmax was less pronounced (p=0.07). In particular, LAVmin showed an increase even in mild diastolic dysfunction, whereas LAVmax increased in later stages of dysfunction. Both LAEV and LAEF showed a significant decrease with progressive impairment of diastolic function (both p<0.001), whereas LA conduit volume did not show significant changes with increasing diastolic dysfunction (p=0.85). GLS showed a gradual reduction with increasing diastolic dysfunction (−18.1±3.0% in normal, −16.8±3.3% in grade I, −16.8±3.5% in grade II, and −13.9±6.8% in grade III, p<0.01).
Clinical and echocardiographic characteristics of the study sample
Left atrial (LA) phasic volumes by categories of left ventricular (LV) diastolic dysfunction
The relationship between LA volumes and E/e' was tested in univariate and multivariate linear regression models. Both LAVmin and LAVmax were significantly and positively associated with E/e'; however, the global fit of the relationship and the parameter estimates were systematically higher for LAVmin (table 3, models 1 and 2; figure 3). In a linear model including both LA volumes, LAVmin was significantly and positively associated with E/e' (β=0.59, p<0.001), whereas LAVmax showed a negative association with E/e' (β=−0.19, p=0.04) (table 3, model 3). After adjusting for age, hypertension and LV mass, LAVmin remained strongly associated with E/e' (β=0.45, p<0.001), whereas LAVmax did not (β=−0.16, p=0.08). This last model was repeated in a sub-analysis including only subjects with LVEF>50% and without coronary artery disease (n=328), and the same results were observed: LAVmin confirmed its significant association with E/e' (β=0.22, p=0.03), whereas LAVmax did not show a significant correlation (β=−0.06, p=0.52).
Linear regressions of left atrial (LA) volumes with E/e'

Scatter plot illustrating the relationship between left atrial volumes and the ratio of peak early phase mitral inflow velocity to the peak early phase diastolic velocity (E/e').
Receiver operating characteristic curve analysis was performed to assess the accuracy of LA volumes in diagnosing diastolic dysfunction of any grade. AUC was 0.64 (95% CI 0.59 to 0.70) for LAVmin, 0.52 (95% CI 0.46 to 0.58) for LAVmax, 0.66 (95% CI 0.60 to 0.71) for LAEV, and 0.72 (95% CI 0.67 to 0.78) for LAEF. We tested whether LA parameters could be useful in differentiating a pseudonormal from a normal pattern, and found that LAVmin (AUC 0.68, 95% CI 0.60 to 0.76), LAEV (AUC 0.66, 95% CI 0.57 to 0.74) and LAEF (AUC 0.75, 95% CI 0.68 to 0.82) were superior to LAVmax (AUC 0.56, 95% CI 0.48 to 0.65) in this regard.
Impact of LV systolic function on LA phasic volumes
The impact of LV systolic function on LA volumetric parameters is shown in figure 4. LVEF showed a weak but significant correlation with LAVmin (r=−0.20, p<0.01), LAVmax (r=−0.12, p<0.05) and LAEF (r=0.16, p<0.01) but showed no correlation with LAEV (r=0.08, p=0.14). GLS, on the other hand, showed stronger correlations with LAEV (r=−0.34, p<0.001) and LAEF (p=−0.36, p<0.001). In partial correlations adjusted for LAVmin, GLS was strongly correlated with LAVmax (r=−0.36) in the sense of greater LAVmax with better (more negative) GLS, whereas LVEF did not show a correlation with LAVmax (r=0.09, p=0.09). In a multivariable linear regression model, GLS resulted to be a significant predictor of LAVmax (β=−0.15, p=0.002), LAEV (β=−0.37, p<0.001) and LAEF (β=−0.28, p<0.001) but not of LAVmin (table 4).

Left ventricular (LV) systolic function and left atrial (LA) three-dimensional volumes. The relationships of LV ejection fraction (LVEF) with LA phasic volumes are shown in a, b and c. The relationships of global longitudinal strain (GLS) with LA phasic volumes are shown in d, e, and f. LAEV, LA total emptying volume LAEF, LA total emptying fraction.
Linear regressions of global longitudinal strain (GLS) with left atrial (LA) phasic volumes
In a sub-analysis that included only subjects with LVEF>50% and without coronary artery disease, GLS confirmed to be significantly associated with LAVmax (β=−0.21, p<0.001), LAEV (β=−0.36, p<0.001) and LAEF (β=−0.27, p<0.001) but not with LAVmin (β=−0.01, p=0.79).
Discussion
LA volumes, reservoir function and LV diastolic function
LA enlargement is a robust marker of chronic elevation of LV filling pressures, less affected by instantaneous load conditions than trans-mitral flow.10 11 To date, most studies have focused on LA end-systolic volume as a surrogate marker of diastolic dysfunction and as a possible predictor of cardiovascular outcomes. In the present study, we assessed the relationship between LA phasic volumes measured by real-time 3D echocardiography and LV diastolic function in an unselected community-based cohort. We demonstrated that, although both LAVmax and LAVmin gradually increased with the progression of LV diastolic dysfunction, the increase in LAVmin with worsening diastolic function was more pronounced than that of LAVmax, and was already evident in the early stage of diastolic dysfunction. Our findings therefore suggest that LAVmin may be a more sensitive marker of diastolic dysfunction than LAVmax. We also demonstrated that LAVmin was better correlated with E/e' than LAVmax, this observation provides a possible explanation for the LAVmin increase observed in the initial stage of diastolic dysfunction. In fact, diastolic dysfunction is a dynamic entity, and grade 1 includes subjects with impaired myocardial relaxation, but may also include those who are transitioning towards a pseudonormal pattern, in which LA pressure, and therefore E/e', begins to rise. In line with this hypothesis, we found that in our study E/e' was significantly higher in subjects with grade 1 than in those without diastolic dysfunction (9.2±2.2 vs 10.2±3.2, p<0.05). In a study by Murata et al, an increased E/e' was also observed in mild diastolic dysfunction, further confirming this circumstance as a possible contributor to our findings.21
Another finding of our study is that longitudinal systolic function is a strong determinant of LA reservoir function (ie, given the same LAVmin, a higher GLS is associated with higher LAVmax). This observation, in line with a study in open-pericardium animal models,14 suggests that in advanced stages of diastolic dysfunction, when GLS is more likely to be reduced, the difference between LAVmin and LAVmax tends to become smaller, as shown in figure 4D. This also suggests that the advantage of measuring LAVmin over LAVmax may be present especially in early stages of diastolic dysfunction. The weaker relationship that we observed between LAVmax and diastolic function may be therefore in part ascribed to the influence of both diastolic load and systolic function on LAVmax. Since LAVmax is the sum of LAVmin plus the absolute LA reservoir function, and given the fact that LAEV is determined by the combined influence of the systolic longitudinal descent of the mitral plane and of LA chamber stiffness,14 the relationship between LAVmax and LV diastole may be confounded by the LV systolic function. On the other hand, the relationship between LAVmin and LV diastolic function appears to be more direct, as in end-diastole the mitral valve is open and the LA is directly exposed to the LV pressure.
Although the relationship between LA volume and diastolic function has been investigated in several studies, only few included the measurement of LAVmin. In a study by Appleton et al, LAVmin was related to the mean pulmonary wedge pressure in patients undergoing cardiac catheterisation.22 In a study by Murata et al, 3D-measured LA reservoir function decreased with worsening diastolic dysfunction grade, and was inversely related to E/e'. In that study, LAVmin and LAVmax both increased with worsening LV diastolic function, but the analyses were not adjusted for confounders, and no direct comparison between LA volumes was performed.21 Similar results were shown in another study using speckle-tracking derived LA volumes.23 LA phasic volumes have also been found dilated in patients with diastolic heart failure24 and untreated hypertension25 compared with controls. Our study brings several elements of novelty on the topic: (1) we are the first to establish superiority of LAVmin over LAVmax as correlate of diastolic function by building ad hoc statistical models to have LA volumes competing with each other for outcome prediction, (2) in addition to univariate analysis, we confirmed our results in multivariate models after adjusting for potential confounders, (3) we provided new insights in the interaction of LV systolic function with atrial mechanics and showed the role of LV longitudinal function on them using speckle-tracking strain imaging.
LA volume is associated with the development of atrial arrhythmias and is a predictor of cardiovascular events. Studies on this topic have so far focused on LAVmax as a marker of LV diastolic function and outcome predictor.2 5 10 The stronger relationship that we found between LAVmin and diastolic function might translate into a better prognostic value of LAVmin, than LVmax. Very limited data is available to date on the prognostic value of both LA volumes. In a study from the Mayo Clinic, a reduced LAEF was found to be a powerful predictor of incidence of atrial fibrillation and flutter, independent of LAVmax.26 A subsequent analysis in the same population revealed that such association was essentially driven by the increase in LAVmin, since for any given LAVmax a reduced LA emptying fraction is determined by an increased LAVmin.27 In a previous study, Caselli et al found that LAVmin correlated with E/e' better then LAVmax and LV mass, and that it was correlated with cardiovascular events.28 Recently, pre-operative LAEF and LAVmin were found to be significant predictors of development of atrial fibrillation after cardiac surgery, whereas LAVmax was not.29 Whether LAVmin may also have better prognostic value in predicting cardiovascular and cerebrovascular events than LAVmax requires further investigation.
LA phasic volumes and LV systolic mechanics
We assessed the LV systolic function by means of LVEF and of speckle tracking strain, which allowed us to evaluate the longitudinal LV systolic components. We found that LV longitudinal systolic function was the main predictor of LAEV. Most importantly, we showed that, independent of LAVmin and of E/e', a greater LAVmax is associated with a better systolic longitudinal function. This effect of systolic function on LAEV and LAVmax is also the factor that makes LAVmax a less precise indicator of LV diastolic function. LV longitudinal function, the effective determinant of the systolic downward motion of the LV base, is therefore an essential contributor to the LA reservoir function by acting as a suction pump. Longitudinally-oriented fibres in the myocardial wall are mostly located in the sub-endocardial region, and LV longitudinal function has been reported to be the first parameter to be affected during subendocardial ischaemia and in conditions of increased subendocardial stress, that is, arterial hypertension and presence of LV hypertrophy.30 31 In an animal study in open-pericardium models, the LV base descent during systole, measured as LV long axis shortening, was in fact associated with the LA reservoir function.14 In the same study, acute regional LV ischaemia reduced the LV longitudinal fibre shortening and caused a significant decrease (−23%) of the LA reservoir filling. In our multivariate analysis, we confirmed that the LV longitudinal strain was the strongest predictor of LA reservoir function, making the LAEV a possible marker of longitudinal systolic function.
Strengths and limitations
The strengths of our study include the large number of subjects studied, the minimal risk of selection bias as the study sample derives from a community-cohort study that employed random patients selection, the fact that a wide range of cardiovascular risk profiles were present in our study population making it the ideal setting to test our hypothesis, and the confirmation of our findings in multivariate models. Moreover, we used state-of-the-art techniques, such as 3D-echocardiography and speckle-tracking imaging. In particular, LA volume assessment by 3D echocardiography has been demonstrated to be more accurate than 2D assessment by comparison with non-echocardiographic gold standards, and has shown better reproducibility.28 32 33 However, our study has limitations. Since the study population included subjects >50 years of age, its mean age is rather high, and our results may not fully apply to younger subjects. Same applies to the high cardiovascular risk profile of the study participants, which might preclude the generalisation of our findings to populations with lower cardiovascular risk. The direct measurement of LV end-diastolic pressure requires invasive procedures, which were not performed in our study. We used Doppler-derived E/e' as an index of LV end-diastolic pressure, a method that has been clinically validated and routinely used in clinical studies. Finally, our study could only detect cross-sectional relationships between the studied variables; long-term outcome studies are needed to assess the prognostic value and clinical significance of LA phasic volumes assessment.
Conclusions
LAVmin measured by real-time 3D echocardiography is more strongly correlated to LV diastolic function and LV filling pressure than LAVmax. LV longitudinal systolic function is a strong determinant of the LA reservoir function. This implies that, given the same end-diastolic LA volume, a greater LAVmax may be expression of a better longitudinal systolic function. LA volume at end-diastole is therefore a more direct and stronger correlate of LV diastolic function. These findings, together with the greater ability to predict atrial arrhythmias observed in previous studies, suggest that LAVmin may be a better marker of LA remodelling than LAVmax.
Acknowledgments
The authors wish to thank Janet De Rosa, MPH (project manager); Rui Liu, MD, Rafi Cabral, MD, Michele Alegre, RDCS, and Palma Gervasi-Franklin (collection and management of the data).
References
Footnotes
Funding This work was supported by the National Institute of Neurological Disorders and Stroke (grant number R01 NS36286 to MDT and R37 NS29993 to RLS/MSE).
Competing interests None.
Ethics approval The ethics approval was provided by Columbia University Institutional Review Board.
Provenance and peer review Not commissioned; externally peer reviewed.