Article Text

Abstract
Objective Exercise intolerance is common in total cavopulmonary connection (TCPC) patients. It has been suggested that power loss (Ploss) inside the TCPC plays a role in reduced exercise performance. Our objective is to establish the role of Ploss inside the TCPC during increased flow, simulating exercise in a patient-specific way.
Methods Cardiac MRI (CMR) was used to obtain flow rates from the caval veins during rest and increased flow, simulating exercise with dobutamine. A 3D reconstruction of the TCPC was created using CMR data. Computational fluid dynamics (CFD) simulations were performed to calculate Ploss inside the TCPC structure for rest and stress conditions. To reflect the flow distribution during exercise, a condition where inferior caval vein (IVC) flow was increased twofold compared with rest was added.
29 TCPC patients (15 intra-atrial lateral tunnel (ILT) and 14 extracardiac conduit (ECC)) were included.
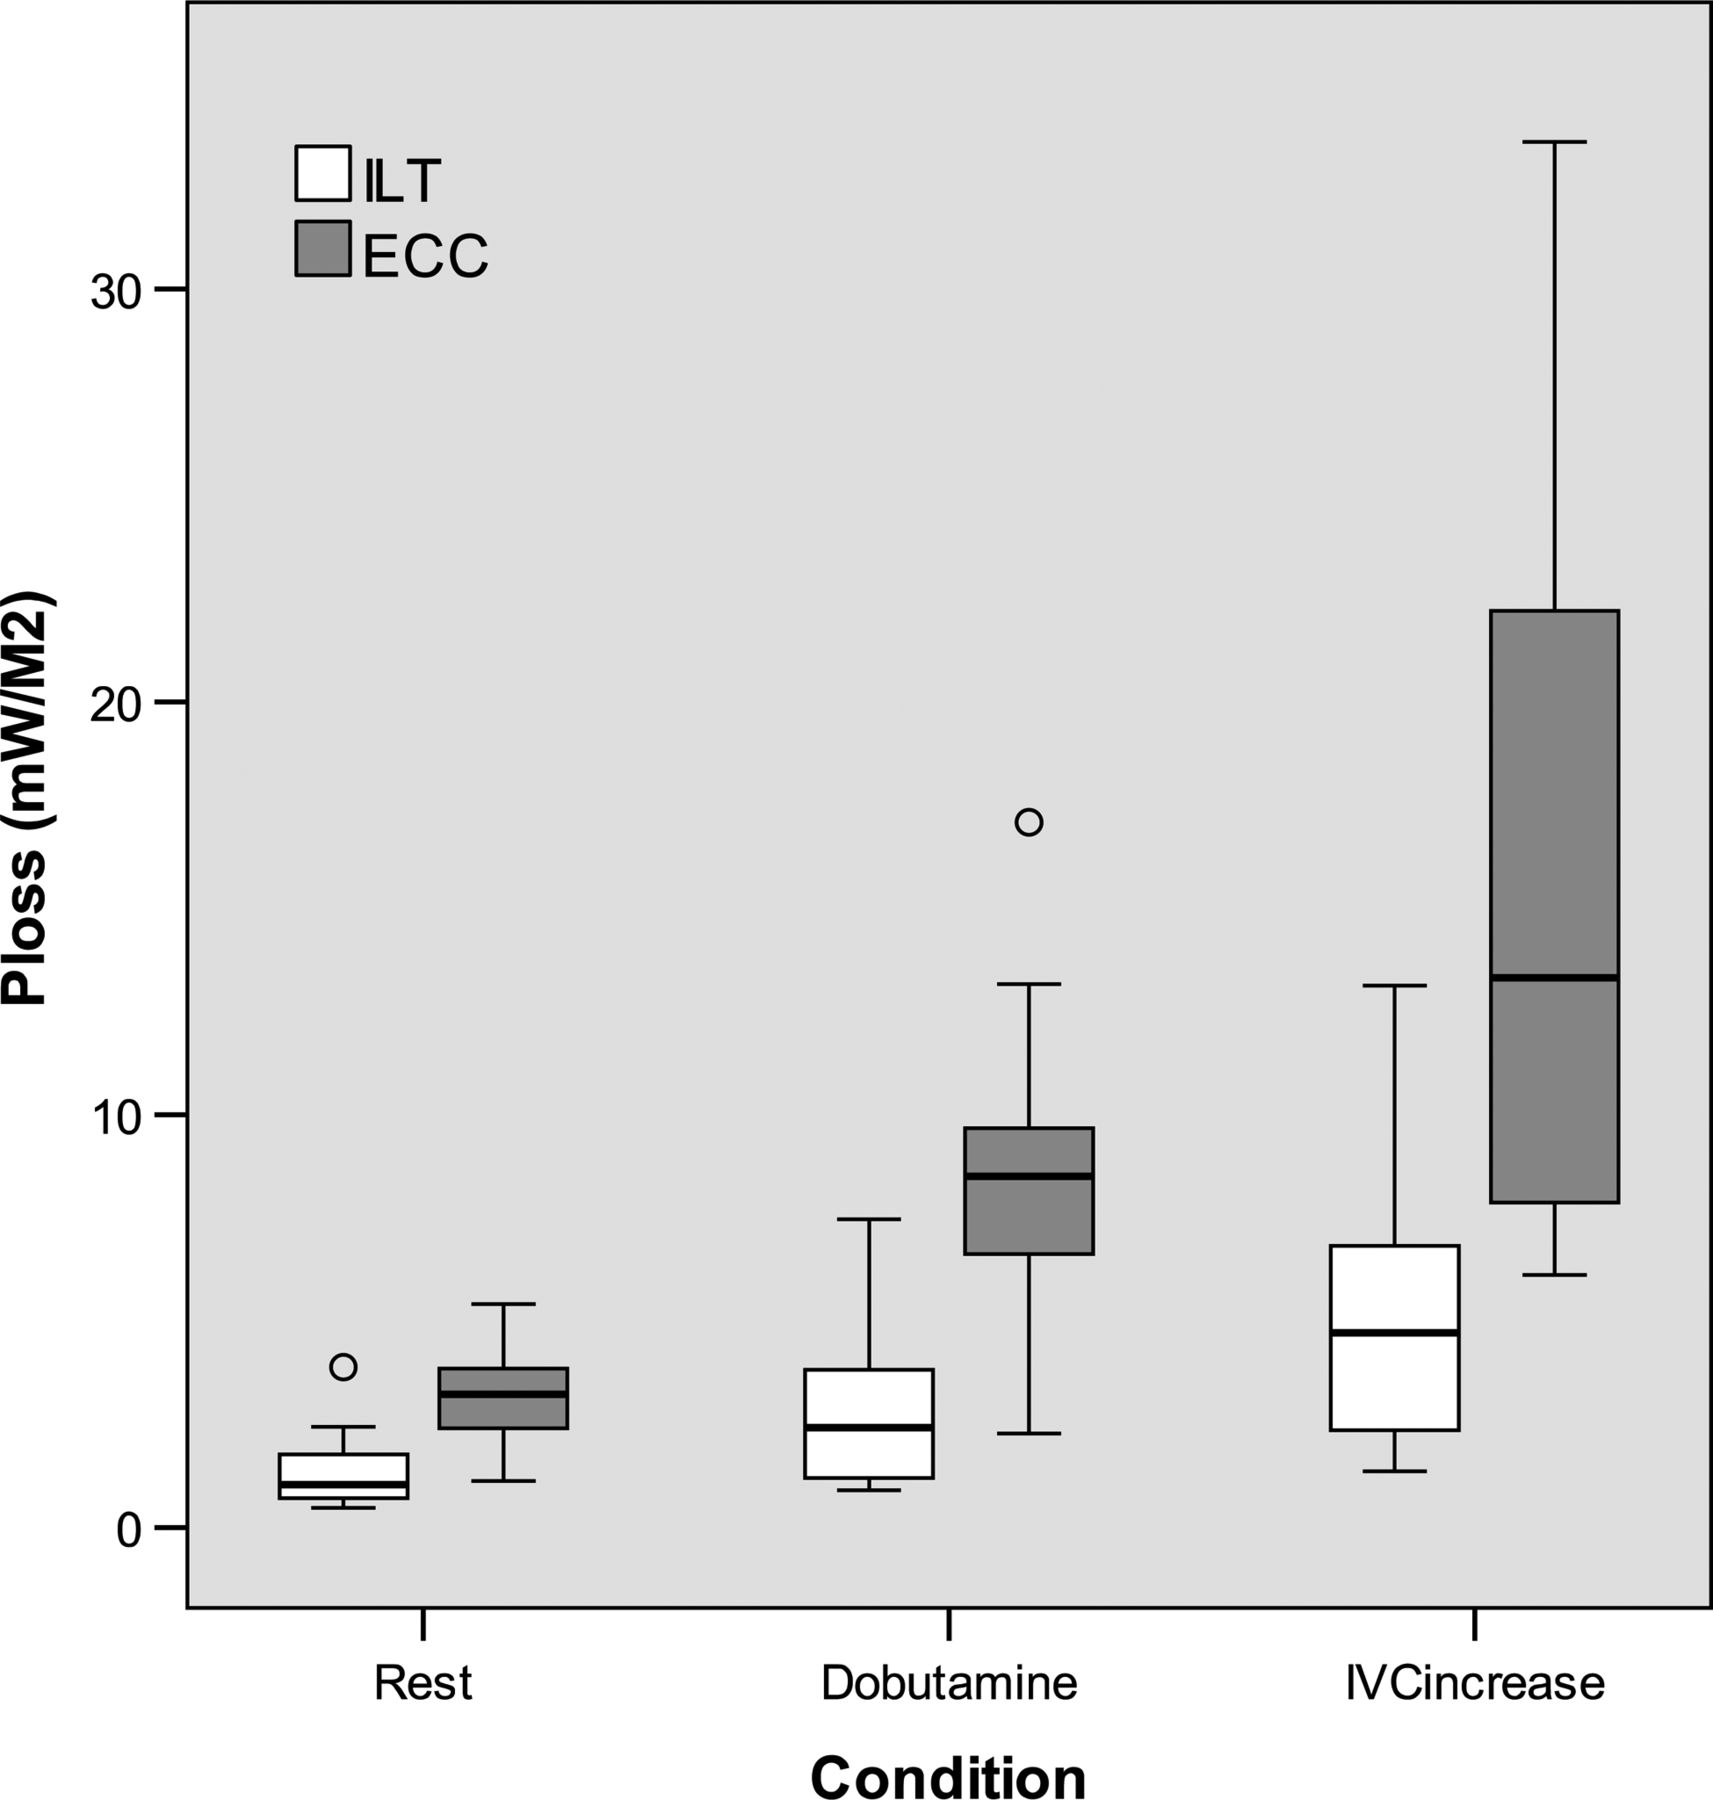
Results Mean Ploss at rest was 1.36±0.94 (ILT) and 3.20±1.26 (ECC) mW/m2 (p<0.001), 2.84±1.95 (ILT) and 8.41±3.77 (ECC) mW/m2 (p<0.001) during dobutamine and 5.21±3.50 (ILT) and 15.28±8.30 (ECC) mW/m2 (p=0.001) with twofold IVC flow. The correlation between cardiac index and Ploss was exponential (ILT: R2=0.811, p<0.001; ECC: R2=0.690, p<0.001).
Conclusions Ploss inside the TCPC structure is limited but increases with simulated exercise. This relates to the anatomy of TCPC and the surgical technique used. In all flow conditions, ILT patients have lower Ploss than ECC patients. We did not find a relationship between Ploss and exercise capacity.
- Fontan Procedure
- Total Cavopulmonary Connection
- Computational Fluid Dynamics
- Single Ventricle
- Congenital
Statistics from Altmetric.com
- Fontan Procedure
- Total Cavopulmonary Connection
- Computational Fluid Dynamics
- Single Ventricle
- Congenital
Introduction
In most patients with univentricular heart disease, treatment consists of creating a total cavopulmonary connection (TCPC) known as Fontan procedure. In this series of operations, the superior caval vein (SVC) and the inferior caval vein (IVC) are connected to the pulmonary arteries.1 The TCPC is usually performed using the intra-atrial lateral tunnel (ILT) or extracardiac conduit (ECC) technique.
Important reduction of mortality and morbidity of the Fontan operation has been obtained over the last 30 years. Despite improvements, deterioration of functional capacity and limited exercise tolerance remain well-known long-term problems after Fontan completion.2 ,3 While the mechanisms of exercise intolerance are not completely understood, it has been suggested that it may be related to power loss (Ploss) inside the TCPC baffle. Previous studies demonstrated that the anatomy of TCPC significantly affects Ploss.4 ,5 Furthermore, Ploss increases nonlinearly during exercise.4 Several studies have used computational fluid dynamics (CFD) to explore Ploss change with exercise. In these studies, flow conditions were measured at rest using cardiac MRI (CMR) and exercise was simulated in CFD by increasing the flows with a constant multiplier, not necessarily reflecting the patient-specific conditions.4 Other studies measured flows during exercise but used generalised TCPC geometries, not considering the individual geometric variations between patients.5
We aimed to study the extent of Ploss inside the TCPC baffle using patient-specific TCPC anatomy and flow at rest and during patient-specific flow increase with dobutamine, simulating exercise conditions. We also aimed to assess the relationship between Ploss and the exercise capacity of Fontan patients, comparing results of the ILT and ECC techniques.
Methods
Patients
The patients participated in an ongoing cross-sectional multicentre study in the Netherlands. The surgical technique used depended on the preference of the operating surgeon. In the Netherlands, referral patterns for congenital heart disease mainly follow a geographical pattern. Therefore, the ILT and the ECC groups may be considered ‘random samples’ of Fontan patients.
Inclusion criteria were TCPC, staged approach according to a current technique (ie, ILT and ECC); completion of the TCPC before the age of 6 years; inclusion in the study at an age of at least 8 years; and at least 4 years since completion of the TCPC. Patients with severe mental retardation and with significant shunting were excluded. Informed consent was obtained from all patients and/or their parents. The study was approved by the institutional review boards of the participating centres. For the current analysis, we selected the first consecutive 15 ILT and 14 ECC patients from a total of 70 patients that successfully underwent the complete CMR protocol.
CMR
All MRI scans were performed on 1.5-Tesla whole-body MRI systems (General Electric Signa 1.5T, Philips Achieva 1.5T and Siemens Avanto 1.5T). To obtain anatomical data, axial stacks of steady-state free precession were made. In-plane resolution was between 1.1 and 1.6 mm, depending on patient size. Slice thickness was 6 mm, and the gap between consecutive slices was −3 mm, resulting in a virtual slice thickness of 3 mm.
Flow rates for SVC, IVC and left pulmonary artery (LPA) were measured by through-plane phase-contrast MRI with at least 24 phases per cardiac cycle during free-breathing, with signal averages of 3. Views per segment was 5–6, repetition time was 1.99–5.62 ms and phase-field of view was 0.7–0.8, as a result temporal resolution was 16–45 ms. A standard velocity encoding of 60 cm/s was used, which was increased with small steps in case of aliasing. Flow was measured at rest and during increased flow simulating exercise by administering dobutamine-hydrochloride (Centrafarm Services, Etten-Leur, the Netherlands) intravenously at a rate of 7.5 μg/kg/min.6 After dobutamine administration, when a new steady state in heart rate was reached, flow measurements were repeated using the same parameters as in the rest conditions. Dobutamine is a synthetic catecholamine with a positive inotropic and, to lesser extent, chronotropic effect. Dobutamine increases oxygen demand in myocardial tissue. This increases cardiac output, thereby increasing flow in a similar fashion in all vessels.7 Flow data were analysed on an Advanced Workstation (General Electric Medical Systems). The images were quantitatively analysed with the Flow Analysis software (Medis Medical Imaging Systems). To adjust for phase-offset errors, flow measurements were corrected using a solid gel phantom.8
Segmentation and meshing
The TCPC geometry was extracted from the axial stacks of an MRI dataset by delineating the lumen contours manually using ITK-SNAP. The segmentations were performed by one researcher (MC) to avoid interobserver variations. We cut the segmentations before the main splitting branches in IVC, SVC and in right pulmonary artery (RPA). The LPA was cut at the same length as the RPA.
The segmented geometry was uniformly smoothed with a pass band of 0.1 in 30 iterations using VMTK. We added flow extensions with a length of one mean profile radius to the IVC and SVC inlets, and four mean profile radii to the LPA outlets. After carrying out a mesh independency study, the geometries were meshed with uniform tetrahedral elements of 0.75 mm using GAMBIT (ANSYS).
Computational fluid dynamics
The CFD simulations were performed on a standard desktop computer (Intel Xeon six core processor, 2.40 GHz CPU and 12 GB RAM) using the commercial finite element software FIDAP V.8.7.4 (Ansys).
We calculated the time-averaged IVC, SVC and LPA flow rates. The blood flow rates measured at IVC, SVC and LPA were prescribed with a parabolic velocity profile. The RPA outlet was set as stress free. The walls were assumed as rigid, and no-slip condition was prescribed. The blood flow was assumed to be laminar. The density of the blood was set to 1060 kg/m3. Carreau model was used to account for the non-Newtonian blood properties. For the simulations, we chose pressure-based segregated algorithm, backward Euler method for time integration and upwinding stabilisation scheme. The convergence criterion was set to 0.1%.
Simulations were performed at three flow conditions: (1) resting condition using the individual flows measured during rest, (2) stress condition using the flows measured during increased flow, simulating exercise, with dobutamine, (3) a condition where only IVC flow was twofold higher than at resting condition. We will refer to this condition as IVCincrease. IVCincrease was necessary because dobutamine increases blood flow equally between the upper and lower half of the body. However, during supine exercise on a bicycle ergometer, this increase is mainly in the lower half of the body.9 Some studies have shown this effect by using a supine bicycle ergometer during MRI flow measurements.9 ,10 IVCincrease condition was based on results reported by Hjortdal et al,9 where caval blood flow was measured by MRI in Fontan patients during supine exercise on a MRI-compatible ergometer. In their study, the exercise at a load of 1.0 W/kg caused a twofold flow increase in the IVC, while SVC flow remained constant.9 For the IVCincrease condition, flow split of the pulmonary arteries was kept as in the resting condition.
Reynolds numbers were calculated for each simulation using the following equation:
where ρ is the blood density, U is the mean velocity, D is the hydraulic diameter and μ is the dynamic viscosity.
Power loss
Power loss was calculated using the control volume approach as described by Liu et al11:
where CS is the control surface, p is the static pressure, ρ is the density, ui is the component of velocity vector in each element, ni is the component of the surface normal vector and dS is the area of the differential control surface.
Resistance index (RI) was also calculated by using the following equations:12

where ΔP is t he Ploss-based pressure drop, CO is the cardiac output and CI is the cardiac index
Bicycle ergometry
To assess exercise capacity, all patients performed bicycle ergometry according to a generalised study protocol within the framework of the aforementioned study.3 From this, maximum oxygen uptake (VO2 peak) and ventilation/carbon-dioxide slope (VE/VCO2-slope) were determined.
Statistical analysis
Statistical analysis was performed using SPSS V.21.0. Data were tested for normal distribution and expressed as mean±SD or median (IQR) as appropriate. Results were corrected for body surface area (BSA). Comparisons between ILT and ECC groups were made using independent t test or Mann–Whitney U test as appropriate. To compare flow measurements between rest and dobutamine paired samples t test was used. Repeated measures analysis of variance with Bonferroni adjustment was used to compare variables during the three different simulated conditions. The correlation between Ploss and CI was determined using ‘curve estimation’. p Values ≤0.05 were considered statistically significant.
Results
There were no significant differences between the ILT and ECC groups in terms of baseline parameters, age at study, age at partial cavopulmonary connection, age at Fontan completion and BSA (table 1).
Patient characteristics per group
Fontan circuit dimensions
Mean area of the SVC was comparable for both groups; 1.48±0.43 cm2/m2 for ILT and 1.27±0.29 cm2/m2 for ECC patients (p=0.130). The IVC area was larger in ILT patients; 5.64±1.82 cm2/m2 (ILT) versus 2.13±0.43 cm2/m2 (ECC) (p<0.001). ILT patients had also larger pulmonary arteries than ECC patients (LPA: 1.42±0.43cm2/m2 vs 1.01±0.45 cm2/m2, p=0.018; RPA: 1.82±0.50 cm2/m2 vs 1.15±0.36 cm2/m2, p<0.001).
MRI flow measurements
At rest, there was no significant difference between ILT and ECC flow rates (35±8 vs 32±6 mL/s/m2 at IVC and 18±6 vs 18±5 mL/s/m2 at SVC) and between CI of the ILT and ECC groups (3.2±0.7 vs 3.0±0.5 L/min/m2). Dobutamine infusion increased flow and cardiac index in ILT and ECC patient groups (p<0.001). In the ILT group, IVC flow increased to 43±8 mL/s/m2, SVC flow to 23±10 mL/s/m2 and CI to 4.0±0.9 L/min/m2. In the ECC group, IVC flow increased to 43±8 mL/s/m2, SVC flow to 25±6 mL/s/m2 and CI to 4.0±0.6 L/min/m2. There were no significant differences in flow rates and CI between both groups during dobutamine. Mean Reynolds number at IVC inlet was 636±195 at rest, 821±264 under dobutamine and 1273±390 at IVCincrease flow condition and at SVC inlet was 537±111 at rest and 701±191 under dobutamine.
Power loss
Overall in the 29 patients, Ploss increased from 2.25±1.43 mW/m2 during rest to 5.53±4.07 mW/m2 after dobutamine infusion (p<0.001 vs rest). Ploss increased further to 10.08±8.02 mW/m2 at IVCincrease condition (p<0.001 vs rest, p=0.001 vs dobutamine) (figure 1). For both groups, there was a strong exponential correlation between CI and Ploss (figure 2).

Power loss normalised for body surface area per condition per patient group.

Normalised power loss versus cardiac index for all patients during all conditions (crosses/dotted line= intra-atrial lateral tunnel (ILT), circles/solid line= extracardiac conduit (ECC)) (exponential correlation, ILT: R2=0.811, p<0.001, ECC: R2=0.690, p<0.001).
For all conditions, there was a linear correlation between Ploss and IVC area (R2=0.32–0.34, p=0.001) and Ploss and RPA area (R2=0.20–0.27, p<0.015). LPA area showed a significant correlation with Ploss during IVCincrease only (R2=0.15, p=0.036). SVC area did not correlate with Ploss.
Power loss ILT versus ECC
A summary of Ploss for ILT and ECC patients is presented in table 2. In all flow conditions, Ploss was significantly higher for ECC patients than for ILT patients. Ploss was significantly higher after dobutamine than at rest (ILT: p=0.001; ECC: p<0.001) for all patients and further increased with IVCincrease flow condition (ILT: p<0.001 vs rest, p=0.020 vs dobutamine; ECC: p<0.001 vs rest, p=0.013 vs dobutamine). The percentage of Ploss increase relative to rest was comparable between both patient groups under dobutamine and also for IVCincrease. RI was significantly higher for all conditions in the ECC group.
Results of the power loss calculations, per group
Exercise capacity versus power loss
Of the 29 patients, 18 had a maximal exercise test (peak respiratory exchange rate ≥1.00). VO2 peak was determined only for these 18 patients and was 78 (71–86)% of the predicted value. VE/VCO2-slope, a submaximal, effort-independent parameter, was determined in all 29 patients. Median VE/VCO2-slope was 125 (114–171)% of the predicted value.
Exercise capacity as assessed by VO2 peak did not correlate with Ploss in any flow condition. Furthermore, submaximal parameter VE/VCO2-slope did not correlate with Ploss. There was no correlation between RI and exercise capacity.
Discussion
Patients that underwent the Fontan procedure are among those with congenital heart disease that have the highest risk for poor clinical state and functional deterioration.1 Power loss as a result of the complex flow pattern in the Fontan baffle has been suggested to contribute to impaired clinical state, along with factors such as increased afterload, decreased preload and abnormal ventricular-arterial coupling.13 The role of Ploss in the Fontan pathway has been subject to debate. Factors contributing to power loss include geometric properties and flow splits.4 ,5 In this study, we created patient-specific models that reflect the variations in TCPC geometries and flow patterns. To the best of our knowledge, this is the first study that combines patient-specific geometries as well as patient-specific dobutamine-enhanced simulated exercise conditions in patients with a Fontan circulation. Our results confirm a strong, nonlinear correlation between Ploss and cardiac index during increased flow, simulating exercise and show a distinct difference between ILT and ECC patients. We observed a large spread in Ploss at the same level of cardiac index, which supports the theory that differences in Ploss relate to patient-specific geometry.
Between the ILT and ECC patient groups with comparable baseline characteristics, there were clear differences in Ploss at different flow conditions. At comparable flow volumes, the mean velocity at IVC was lower for ILT patients than the ECC patients. This was because blood flows through larger IVC surface areas in the ILT patients. Power loss is proportional to the square of the velocity (as shown in the equation for Ploss), resulting in lower Ploss in ILT patients. Additionally, the smaller pulmonary artery size in the ECC patients led to higher pressure drops and thus higher Plosses for this group.14
The significant difference in pulmonary artery size between both groups is an interesting finding. Considering the cardiac diagnoses, it could be advocated that ECC patients were at increased risk of compromised pulmonary blood flow before the partial (cavopulmonary connection) and total cavopulmonary connection. However, there was no difference in the proportion of procedures to increase pulmonary blood flow between both groups. Another option is that the relatively small amount of patients has caused a sampling artefact. Furthermore, the loss of pulsatility in the ECC might have resulted in less growth of the pulmonary arteries compared with those in the ILT patients.15
We could not establish a relationship between exercise capacity and Ploss or RI.
Whitehead et al4 found a non-significant negative trend between RI inside the TCPC and VO2 peak. In our study, with a larger sample size, we could not reproduce this finding. This indicates that other factors influence exercise capacity more than power loss inside the TCPC.
In comparison to other studies, we found a low Ploss inside the TCPC, especially for the ILT group. Several factors explain the wide range of Ploss in different studies including Fontan baffle geometry, the level of (simulated) exercise, respiratory effects and boundary conditions for CFD. Table 3 provides a comparison between our study and other studies in this field.
Comparison of CFD studies in Fontan patients
Whitehead et al and Marsden et al used patient-specific Fontan geometries for CFD simulations. In these studies, Ploss at rest was up to 5–10 times higher than our study at a similar cardiac index. An important difference between our study and the study of Marsden et al16 and others was that they included side branches of the pulmonary arteries. 17 Another difference between our study and that by Whitehead et al4 is that they assumed flow increased up to 300% during exercise.
The variation in reported Ploss may also be related to the differences in the flow cross-sectional areas. In some studies, flow rates for IVC and SVC were similar to ours, but the diameters of these vessels were smaller than in our study, resulting in higher power losses, as described earlier.11 ,18 ,19
In a more recent study, Baretta et al found power losses close to our findings. They simulated the total circulation of one patient using combined anatomical and flow data from echocardiography, catheterisation and CMR. In their study, the efficiency of several TCPC variants was investigated by performing virtual surgery in a pre-TCPC Fontan patient.17
The role of Ploss in the TCPC in the total circulation
It has been suggested that cardiac output in Fontan patients is more dependent on preload than on contractility, which is generally well preserved.13 ,20 Preload in the Fontan circulation is directly dependent on transpulmonary blood flow. Considering the generally higher pulmonary and systemic vascular resistance in Fontan patients compared with healthy controls, Ploss inside the TCPC may be clinically relevant.
Total circulatory power has been found to be lower in Fontan patients (0.71±0.25 W/m2) than in controls (1.06±0.21 W/m2).21 ,22 Compared with these values, power loss levels reported for the TCPC baffle have been considered to be nearly negligible. However, it has been shown that the percentage of the power lost inside the TCPC can be as high as 30–40% of input power for some patients under exercise conditions, which can be considered to be significant.23
Sundareswan et al showed a weak correlation (R=0.36) between cardiac output and TCPC resistance. They calculated that a 10% increase of TCPC resistance would reduce cardiac output with 8.6%.12 Ploss is directly dependent on TCPC resistance and the total flow, supporting the theory that Ploss inside the TCPC might have an effect on the circulation in Fontan patients. This could not be confirmed for clinical outcome parameters, such as measures of exercise capacity, in our study.
Recommendations for future research
A common limitation of CFD models of the Fontan circulation is that pulmonary and systemic circulation are not taken into account. In reality, the pulmonary arterial branches and the pulmonary vascular bed are connected to the TCPC baffle. Clearly, pulmonary vascular resistance contributes to Ploss and preferably should be included in calculations in the Fontan circulation. Nevertheless, pressure drop due to geometric features and the flow rates of IVC, SVC and pulmonary arteries are the main determinants of Ploss in Fontan baffle.
Respiration plays a key role in the Fontan circulation.24 An opportunity for improvement is the incorporation of respiration into CFD models. Although pulmonary artery pulsatility is decreased in Fontan patients, they may still have pulsatile function, especially in ILT patients.15 In the CFD simulations, we assumed that the vessel walls were rigid. Considering the limited pulsatility in the Fontan circulation, the common assumptions of rigid walls and steady flow are valid. Furthermore, Long et al25 showed in two patients that the time-averaged power efficiencies calculated with rigid walls were only 1.5% lower than that calculated with compliant walls.
Conclusion
Ploss inside the TCPC structure is limited but increases with (simulated) exercise. This relates to patient-specific TCPC anatomy and the surgical technique used. In all flow conditions, ILT patients have lower Ploss than ECC patients. We did not find a relationship between Ploss and exercise capacity.
Key messages
What is already known on this subject
-
Previous studies have suggested that the anatomy of the total cavopulmonary connection significantly affects power loss and that power loss increases during exercise.
How might this impact on clinical practice
-
There is still an ongoing debate on which of the current surgical strategies for the total cavopulmonary connection is superior with regard to long-term outcome and functional state of the patients, including circulatory load and exercise performance.
What this study adds
-
In this study, we have shown that power loss depends on the surgical technique used. Our study is one of the largest cohorts of actual patients that have been described so far. In our CFD models, we used actual, patient-specific flow measurements at rest and during increased flow condition, as obtained with a readily available clinical tool, dobutamine stress testing.
-
We are convinced that our study adds value to the ongoing discussion on the magnitude of power loss and the correlation between power loss and exercise capacity in the field Fontan patients. We found that the magnitude of power loss might be lower than was reported until now and we did not establish a relation between exercise capacity and power loss as was suggested previously.
Acknowledgments
For Julia and other children who died from a univentricular heart defect.
References
Footnotes
-
SSMB and MC contributed equally.
-
Contributors JJW and WAH designed the study. SSMB, MC and RFV collected the data. JJW, MC, FJG and RFV designed the software for CFD modelling. MC, FJG and RFV carried out the CFD modelling and simulations. SSMB and MC analysed the data and performed statistical tests. SSMB and MC drafted the manuscript. SSMB, WAH, MS, JLMS and AM implemented the study in the different cooperating centres. All authors revised the draft manuscript.
-
Funding This work was supported by Dutch Heart Foundation (grant number 2008T037) and Dutch Technology Foundation STW (Carisma 11629).
-
Competing interests None.
-
Ethics approval institutional review boards of the participating centres.
-
Provenance and peer review Not commissioned; externally peer reviewed.