Article Text

Abstract
Objective: To evaluate the cost of atrial fibrillation (AF) to health and social services in the UK in 1995 and, based on epidemiological trends, to project this estimate to 2000.
Design, setting, and main outcome measures: Contemporary estimates of health care activity related to AF were applied to the whole population of the UK on an age and sex specific basis for the year 1995. The activities considered (and costs calculated) were hospital admissions, outpatient consultations, general practice consultations, and drug treatment (including the cost of monitoring anticoagulant treatment). By adjusting for the progressive aging of the British population and related increases in hospital admissions, the cost of AF was also projected to the year 2000.
Results: There were 534 000 people with AF in the UK during 1995. The “direct” cost of health care for these patients was £244 million (~€350 million) or 0.62% of total National Health Service (NHS) expenditure. Hospitalisations and drug prescriptions accounted for 50% and 20% of this expenditure, respectively. Long term nursing home care after hospital admission cost an additional £46.4 million (~€66 million). The direct cost of AF rose to £459 million (~€655 million) in 2000, equivalent to 0.97% of total NHS expenditure based on 1995 figures. Nursing home costs rose to £111 million (~€160 million).
Conclusions: AF is an extremely costly public health problem.
- atrial fibrillation
- cost evaluation
- morbidity
- hospitalisation
Statistics from Altmetric.com
Atrial fibrillation (AF) is the most common of chronic cardiac arrhythmias.1,2 Approximately 1 in 100 of the population have AF, though the prevalence rises to more than 1 in 10 in the elderly.1–,4 The prevalence of AF is rising4 and will continue to rise for the foreseeable future.1–,4 The reason for this increase is twofold. Firstly, the population is aging rapidly, increasing the pool of people most at risk of developing AF.5 Secondly, survival from underlying conditions closely associated with AF, such as hypertension, coronary heart disease, and heart failure, is also increasing.6–,8
Most patients with AF require long term pharmacological treatment, often including warfarin.9 Monitoring anticoagulant treatment is expensive. AF also leads to hospitalisation10–,11 and is a cause of particularly costly cardiovascular morbidity—that is, stroke and heart failure.12–,14 The number (and rate) of AF related hospitalisations (both primary and secondary) has increased twofold to threefold in recent years.15–,18
Consequently, AF is likely to impose a substantial and growing economic burden on health care systems. This burden has never been quantified. The goal of this study was, therefore, to evaluate the direct cost of AF to the National Health Service (NHS) in the UK.
METHODS
A prevalence based approach was used to estimate the economic burden of AF. Contemporary data were obtained from epidemiological studies, government datasets, and other sources to estimate prevalence, health care utilisation, and costs. These data were applied, on an age and sex specific basis, to official mid year population estimates for the UK. The cost of AF was first calculated for 1995—the point in time when the most accurate data were available. The cost of AF in year 2000 was then calculated from a combination of contemporary and extrapolated data. To be consistent with previous analyses of this type,14,19 where a range of estimates was available, we have used the most conservative alternative.
Community based health care
Patient population
Age and sex specific population prevalences of AF, derived from three cross sectional studies in the UK, were applied to the whole population for the year 1995.3,20,21 These rates are approximately 10% lower than the 1994 prevalence reported by the British general practice research database.4
General practitioner consultations
Age and sex specific rates of general practitioner consultations per 1000 population were obtained from the Information and Statistics Division (ISD) of the NHS in Scotland.22 The ISD routinely collates and validates data from a number of general practices serving a representative sample of the Scottish population (51 practices at the time of this analysis). An age and sex specific adjustment was made to these data to take account of consultations in which AF was important but was not the recorded cause of consultation (only one was allowed). We used the same ratio as principal to secondary discharge diagnoses. We also assumed that 1 in 10 consultations took place in the patient’s home. This assumption is in keeping with a formal analysis of the pattern of general practitioner visits in the UK23 but is likely to be conservative given the typically older cohort of patients with AF.
General practice referrals to an outpatient clinic
We could find no information on hospital referral rates from primary care. However, as approximately one third of men and one quarter of women with AF are prescribed warfarin,4 we concluded that most of these patients would have had a specialist assessment at hospital—that is, 30% of patients with AF are referred to an outpatient clinic (average two visits a year).
Drug prescriptions
Prescribing data are available from the General Practice Research Database (211 practices in England and Wales) and smaller studies.4,24 Intercontinental Medical Statistics Ltd also monitor the prescribing patterns of 500 general practitioners from around the UK (P Stephens, personal communication, 2000/2001). We assumed a rate of seven prescriptions for each patient every year. On the basis of recent studies, we assumed that each of these patients would require eight visits to an anticoagulant clinic yearly.3,4,24
Hospital based health care
Hospital admissions
Hospitalisation rates for AF (principal and secondary discharge codings) were obtained from the ISD.16,25,26 Up to six discharge diagnoses are coded (according to the Manual of the international statistical classification of diseases, injuries and causes of death, 9th revision (ICD-9) in 1995). The ICD-9 code for AF was 427.3.27 The term “discharge” refers to live discharges and deaths. Subsequent hospitalisations for a patient can be identified on this linked database. These data are also linked through the General Register Office for Scotland to all deaths in the UK. Information on length of hospital stay (including ward speciality) and destination of live discharges (for example, to a nursing home) is also available.
These data were applied on a sex and age specific basis to the whole British population.
Post-discharge outpatient clinic visits
We assumed that after admission with a principal diagnosis of AF, each “live discharge” not requiring subsequent long term care would lead to an average of three follow up hospital outpatient visits.
Long term care
We estimated the total number of days of admission to nursing homes from the proportion of patients directly discharged to such facilities (principal discharge diagnosis of AF only). A rolling average of the number of patients discharged to nursing homes each month and their duration of stay there (adjusted for the number of days remaining in that year, subsequent days of hospitalisation, and death) was calculated for 1995.
Information on costs related to AF in 1995
Community based health care
The average cost of a general practitioner consultation was taken from an analysis of health care costs in the UK during 1995.28 Scottish health care costs for 1995/96 were used to obtain the cost of a visit to a hospital outpatient clinic (see below).19 The cost of drug specific prescriptions was obtained from Intercontinental Medical Statistics Ltd. A 10% dispensing cost was added. These costs were cross checked with government prescription data.28–,34 The average cost of a visit to an anticoagulation clinic was derived from official sources.28–,34 The additional cost of international normalised ratio monitoring for each visit was derived from a formal analysis of health care costs in the UK.28
Hospital based health care
The costs of hospital admission and post-discharge outpatient clinic visits during 1995/96 were obtained from an ISD report.34
Long term care
The average weekly cost of resident nursing home care was obtained from a contemporary British report.33
Projected cost of AF in 2000
The most contemporary prevalence estimate for AF in the UK comes from the general practice research database in 1998 (showing a rise from 1994).4 We applied the 1998 prevalences for AF to the British population in the year 2000 on an age and sex specific basis (with a 10% reduction to remain conservative).
For the largest component of health care expenditure (hospital stay), we assumed that the observed trends in hospitalisation rates between 1990 and 1995 (and their associated in-patient case fatality rates)16 would remain constant for the period 1995–2000. Updated costs were used where available28–,34 or adjustments made in keeping with changes in the rate of inflation.35 Table 1⇓ summarises the costs used for 1995 and 2000.
1995 and 2000 costs for atrial fibrillation in the UK
Sensitivity analyses (2000 cost estimates)
Because of uncertainties surrounding some of our estimates (for example, the number of hospital admissions), probable changes in treatment practice in the near future, and other factors (such as prevalence), one way sensitivity analyses were undertaken for the year 2000. Those having a significant effect on the “direct” cost of AF were as follows:
A higher prevalence of AF (10% greater)
A greater number of hospital of admissions where AF is listed as the principal diagnosis (10% more or less)
A higher rate of warfarin prescriptions (50%) with an associated increase in the number of anticoagulation monitoring visits
The additional cost of hospital admissions where stroke and heart failure are listed as the principal diagnosis but AF is listed as a secondary diagnosis. In these cases AF is likely to be a major contributor to the cause of that admission.16
RESULTS
Estimated cost of community based health care
General practitioner consultations
About 534 000 people (281 000 men and 253 000 women) were being treated for AF in the UK in 1995—that is, 0.9% of the whole population and 5% of those ⩾ 65 years. There were about 590 600 male and 984 800 female consultations with general practitioners for AF in 1995, costing £29.5 million.
General practitioner referrals to hospital outpatient clinics
We assumed that one quarter of patients with AF (about 134 000 people) attended for an average of two hospital outpatient visits in 1995, costing £28.8 million.
Drug prescriptions
Table 2⇓ shows the number and cost of prescriptions for AF. The total cost of the pharmacological management of AF (excluding anticoagulant treatment and monitoring) was £22.0 million. The additional cost of monitoring the 30% of patients prescribed warfarin was £26.9 million (this includes 1.28 million anticoagulant clinic visits). The total cost of drug treatment for AF in 1995 was, therefore, £48.9 million.
Estimated number and cost of prescriptions for atrial fibrillation in the UK during 1995 and 2000
Estimated cost of hospital based care
Hospital admissions (principal diagnosis)
There were about 31 000 hospitalisations in 1995, involving 26 000 men, associated with a principal diagnosis of AF (these accounted for a total of 193 000 bed-days). For women, the equivalent figures were 28 000 hospitalisations, 24 000 people, and 159 000 bed-days. Figure 1⇓ shows the outcome of the patients who were hospitalised. By stratifying costs according to the proportion of bed-days spent in different types of wards (general or specialty), we calculated that the total expenditure on AF hospitalisations was £121.7 million in 1995.

Profile of hospitalisations associated with a principal diagnosis of atrial fibrillation in 1995 and subsequent outcomes. AMI, acute myocardial infarction.
The greatest expenditure was for men aged 55–64 years (£20.6 million) and for women aged 75–84 years (£17.1 million).
Postdischarge outpatient visits
There were 29 000 and 24 000 discharges involving “live” men and women, respectively, associated with a principal diagnosis of AF not resulting in long term care in 1995. Assuming an average of three follow up visits for each admission, the total expenditure for this component of health care was calculated to be £15.0 million (£8.2 million for men and £6.8 million for women).
Additional hospital admissions (secondary diagnosis)
There were a further 60 000 hospitalisations for men (involving 46 000 men and 450 000 bed-days) associated with a secondary coding for AF in 1995. For women, the equivalent figures were 69 000 hospitalisations, 55 000 women, and 440 000 bed-days. The total cost of these admissions to the NHS was £240.9 million (£128.3 million for men and £112.6 million for women).
Long term nursing home care
About 1900 men and 2500 women were discharged to a nursing home after a hospital admission associated with a principal diagnosis of AF in 1995. These patients needed 1.2 million days of residential care in 1995, costing £18.9 million for men and £27.5 million for women.
Total AF related health care expenditure in 1995
AF cost the NHS a total of £243.9 million in 1995 (excluding hospitalisations with a secondary coding of AF and post-discharge nursing home care) (figs 2⇓ and 3⇓). In the same year, the total NHS expenditure was £39 118 million—AF accounted for about 0.62% of this expenditure. The major component of this expenditure was hospital admissions (50% of the total and 0.31% of the total NHS budget). This is an underestimate of the true cost of AF related hospitalisations because of the many other hospitalisations associated with a secondary coding of AF. These cost an additional £241 million or 0.62% of NHS expenditure. The second largest component of overall cost was drug treatment (accounting for 20%), particularly anticoagulant treatment and monitoring.

Components of health care expenditure related to atrial fibrillation in the UK in 1995 (excluding secondary admissions and long term nursing home care. GP, general practitioner; OPD, outpatient department.

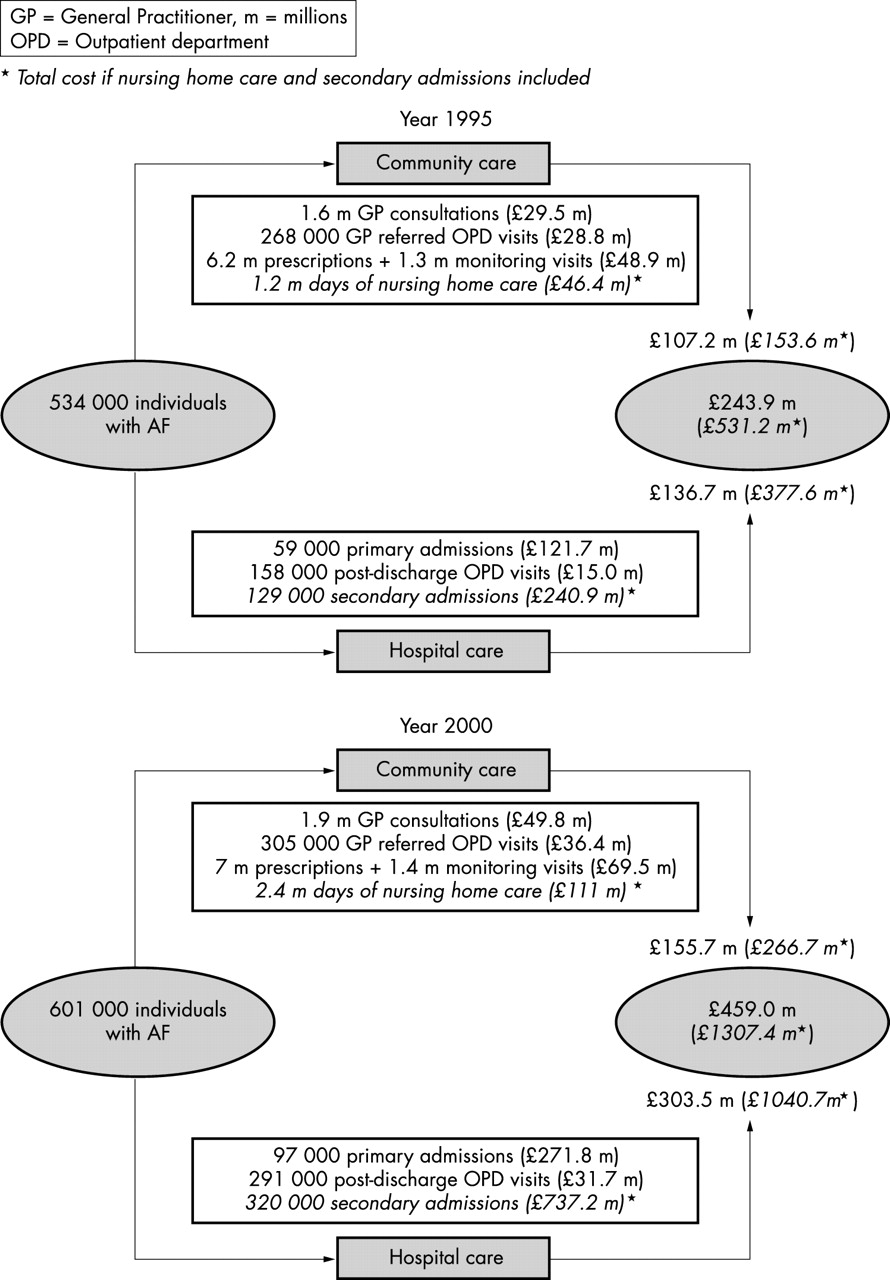
Comparison of the projected burden of atrial fibrillation (AF) in the UK in 1995 versus 2000. m, millions. *Total cost if nursing home care and secondary admissions included.
Projected cost of AF in 2000
Community based care
By 2000 an additional 67 000 people required treatment for AF—that is, a total of 601 149 people, over 1% of the population. Corresponding increases in the numbers of general practitioner consultations and general practitioner referrals to hospital outpatient clinics were estimated to cost £49.8 million and £36.4 million, respectively. The cost of drug prescriptions (including the cost anticoagulant clinic visits) increased to £69.5 million.
Hospital based care
There were about 109 000 admissions for men and women (for 663 000 hospital bed-days) associated with a principal diagnosis of AF during 2000. This cost increased by 123% from £121.7 million in 1995 to £271.6 million in 2000 (£152.1 million for men and £119.5 million for women admitted in 2000). The number of post-discharge outpatient visits increased to £31.7 million and the cost of nursing home care rose from £46.4 million in 1995 to £110.7 million in 2000. Because of the even greater rise in hospitalisations with a secondary diagnosis of AF, the cost of these admissions increased to £726.6 million in the year 2000.
Total AF related expenditure in 2000
The direct cost of AF during 2000 (excluding hospitalisations with a secondary AF coding and nursing home costs) was £459.0 million, a 56% increase above that of inflation, compared with 1995 and 0.88% of total NHS expenditure (fig 3⇑).
Sensitivity analyses
Figure 4⇓ summarises the results of the sensitivity analyses.

Summary of one way sensitivity analyses.
DISCUSSION
Although AF is the most common chronic cardiac arrhythmia,1–,4 a well recognised cause of cardiovascular morbidity,10–,12 and an increasingly common cause of hospital admission,12–,20 the cost of this condition to a health care system has never been quantified. The recent availability of large relevant datasets has now made this exercise feasible. We found that the direct cost of AF to the NHS in the UK was between £244 and £531 million (or 0.6–1.2% of overall health care expenditure in the UK) in 1995. We also found that the cost of AF rose greatly between 1995 and 2000. In 2000 the direct cost of AF was £459 million—almost double that in 1995. Overall, AF accounted for 0.9–2.4% of NHS expenditure in 2000 (or 1–2.7% of NHS expenditure on the basis of 1995 levels of funding). These are almost certainly conservative estimates since additional costs, such as those related to stroke rehabilitation, digoxin toxicity, and warfarin or aspirin related haemorrhage, have not been considered. A minimum of an additional £111 million was also spent on admission to nursing homes.
The range of the estimated cost of AF to the NHS may, at first sight, seem wide. This, however, reflects the difficulty in determining whether AF contributed directly to hospital admissions. The most conservative approach, counting only hospitalisations where AF was the principal discharge diagnosis, almost certainly underestimates the true cost of this condition. For example, in the case of heart failure or stroke caused by AF, AF would commonly be coded in a secondary position. Sensitivity analysis shows that these admissions cost an additional £221 and £228 million, respectively. Costing all hospitalisations where AF is coded at discharge provides an upper limit for the potential economic burden of this condition. The same considerations also apply to nursing home occupancy.
To provide a perspective, prior analyses that we have done using identical methods have estimated the direct costs of heart failure14 and angina19 to the NHS to be £1000 and £668 million, respectively. Other analyses, using similar approaches, have calculated the cost of health care expenditure in the UK for stroke (where a proportion of the cost must relate to AF), diabetes, and epilepsy. Up-rated to 2000, these are estimated to cost £1100 million,36 £900 million,37 and £190 million,38 respectively.
The pattern of expenditure for a given disease often indicates targets for therapeutic intervention aimed at reducing costs—that is, it identifies potentially cost effective treatment. As with other common, chronic cardiovascular problems, the majority of AF expenditure reflects frequent, recurrent, and often prolonged hospital admissions (indeed the rapid increase in cost of AF largely reflects rapidly increasing numbers of hospitalisations for this condition). Here, however, AF is less well understood than other cardiovascular problems. The factors leading to hospital admission related to AF have not been fully elucidated. Consequently, avoidance of hospital admission and cost containment are equally poorly understood. One relation is, however, well recognised—that of AF and stroke. The risk of stroke can be substantially reduced with warfarin, though this treatment is underused in practice.24,39 For example, even a modest 15% reduction in stroke related AF admissions would reduce the cost related to AF by £30 million a year. Clearly, a further reduction in AF related morbidity and costs requires a much better understanding of the relation between AF and heart failure,11 another major contributor to AF related hospital bed-days.
This study, like any other of its kind, has certain limitations. Some of these have been described above. One not discussed is the extrapolation of Scottish rates of general practitioner consultation and hospitalisation rates to the UK as a whole. The prevalence of heart disease is higher in Scotland than in some parts of England (a greater socioeconomic gradient in heart disease related events in Scotland being an important consideration); hence, our data may inflate the overall cost of AF marginally in the UK. Conversely, we could not calculate the cost of accident and emergency visits not leading to hospital admission. We know of no source of accurate data on such visits. We have also not been able to take account of new interventional (pacing and ablation) and surgical approaches to the treatment of AF, as reliable information is not available. Moreover, because reliable information is unavailable, we were also unable to calculate the indirect costs (for example, related to loss of employment) of AF, which are also likely to be substantial.
Despite these limitations, we have shown that this insidious and deadly arrhythmia imposes a substantial economic as well as a health burden on the NHS in the UK (this is also likely to be true of other countries, given that the morbidity related to AF and the treatment of AF are comparable and that these are the major drivers of cost). Moreover, it is clear that AF related costs are escalating rapidly and that AF is worthy of the attention directed towards heart failure when it became clear the latter was becoming a major public health problem.40 Most of the cost of AF relates to hospital admissions, and cost containment will require measures to reduce the risk of hospitalisation. At present, the factors leading to such hospitalisations are poorly understood.
Acknowledgments
SS is supported by the NHMRC and the NHF of Australia; NM is supported by the British Heart Foundation.
REFERENCES
Linked Articles
- Miscellanea