Article Text

Abstract
Background: The identification of viable myocardium in patients with impaired left ventricular contraction secondary to coronary heart disease is important clinically as such myocardium is likely to benefit from revascularisation. Blood oxygen level dependent (BOLD) magnetic resonance imaging (MRI) relies on changes in deoxyhaemoglobin concentration under stress for signal generation and could be used for the differentiation between scarred and viable myocardium.
Aim: To assess the signal change on BOLD MRI in viable and scarred myocardium as identified by positron emission tomography (PET).
Method: 19 patients with impaired left ventricular contraction and at least one akinetic area were enrolled. They underwent rest and dipyridamole stress MRI, using a double breath hold T2* weighted, ECG gated sequence to produce BOLD contrast images, and cine-MRI for wall thickening assessment. Dynamic perfusion and metabolic PET images followed the MRI. Signal change on BOLD MRI and the wall thickening were compared between rest and stress images in hibernating and scarred segments identified by PET on two short axis slices of mid ventricle, with eight segments each.
Results: Using PET, 68 segments were identified as hibernating and 42 as scarred. The hibernating segments were found on BOLD MRI to have an average signal change between rest and stress of −9.53%, compared with −2.15% in the scarred segments (p = 0.008). The average wall thickening was 8.7 mm in the hibernating segments compared with 5.9 mm in the scarred segments (p < 0.0001).
Conclusions: BOLD MRI with wall thickening may differentiate scarred and viable myocardium and help identify suitable patients for revascularisation. Further larger studies are needed to establish a threshold for detection, sensitivity, and specificity.
- blood oxygen level dependent magnetic resonance imaging
- heart failure
- ischaemic heart disease
- myocardium
- BOLD, blood oxygen level dependent
- FDG, fluorodeoxyglucose
- MRI, magnetic resonance imaging
- PET, positron emission tomography
- ROI, region of interest
Statistics from Altmetric.com
- blood oxygen level dependent magnetic resonance imaging
- heart failure
- ischaemic heart disease
- myocardium
- BOLD, blood oxygen level dependent
- FDG, fluorodeoxyglucose
- MRI, magnetic resonance imaging
- PET, positron emission tomography
- ROI, region of interest
Hibernation” of the myocardium refers to a state in which there is persistently impaired left ventricular contraction at rest which can be restored partially or completely to normal after revascularisation.1,2 Hibernation is a state of adaptation of the myocardium that acts as endogenous protection against ischaemia, preserving the structural integrity of the myocardium.3,4
In many patients with chronic coronary artery disease, impaired left ventricular contraction arises from regions of viable (ischaemic or hibernating) rather than scarred myocardium.5,6 The identification of this viable myocardium is of crucial clinical importance. It predicts not only improved regional and global function after revascularisation, but also improved prognosis and survival compared with patients treated by medical means alone.7–9 Viable myocardium can be identified using radionuclide imaging such as positron emission tomography (PET), thallium scintigraphy,10 and dobutamine echocardiography.11
Magnetic resonance imaging (MRI) is increasingly emerging as an important diagnostic tool in cardiac disease. It is well established for anatomical and functional evaluation of the heart, and more recently for perfusion imaging using exogenous contrast media. Oxyhaemoglobin and deoxyhaemoglobin are diamagnetic and paramagnetic, respectively. This magnetic property can be used as an endogenous contrast to visualise tissue oxygenation. This is the physical and physiological basis of blood oxygen level dependent (BOLD) MRI. The deoxygenation of haemoglobin to deoxhaemoglobin results in local magnetic field inhomogeneity,12,13 and in turn signal change in T2* weighted MRI images.14 In the myocardium, BOLD MRI is potentially sensitive to changes in deoxyhaemoglobin concentrations caused by changes in blood flow, volume, and oxygen consumption.
The myocardial BOLD MRI signal has been shown to increase significantly following the injection of dipyridamole,15–17 owing to an increase in coronary blood flow out of proportion to oxygen demand, resulting in a decrease in myocardial venous blood deoxyhaemoglobin concentration. In contrast, occlusion of the left anterior descending coronary artery results in signal decrease, reflecting an increase in myocardial venous deoxyhaemoglobin concentration as oxygen extraction is increased as a result of myocardial ischaemia.18–21
In the present study, we compared the results of metabolic fluorine-18 labelled fluorodeoxyglucose (FDG) PET imaging and those of BOLD MRI in patients with chronic coronary artery disease and left ventricular systolic impairment, with an area of akinesis on contrast ventriculography. Our aim was to assess the signal intensity change between rest and stress in viable and scarred myocardium on BOLD MRI as identified on PET (which was used as our gold standard), and to evaluate the use of this form of MRI for differentiating between viable and scarred myocardium.
METHODS
Twenty four patients on the waiting list for coronary bypass graft surgery were recruited to the study. All had angiographically proven three vessel coronary artery disease and impaired left ventricular contraction, with an identified area of akinesis. There were 22 men and two women, mean (SD) age 68 (5) years (range 63–77 years). Patients were selected on the basis of impaired left ventricular contraction and at least one area of akinesis on contrast ventriculography. Coronary arteriography showed significant stenosis (more than 50% reduction in luminal diameter) of all three major coronary arteries in all patients. They all had at least one totally occluded epicardial coronary artery. Patients who had a contraindication to MRI, or a cardiac arrhythmia that would not permit ECG gating, were excluded.
The local ethics committee approved the research protocol, and all patients gave written informed consent before undergoing the scans.
Two weeks preoperatively, patients underwent rest and dipyridamole stress BOLD MRI and cine MRI for wall motion assessment, 13N-NH3 rest perfusion, and metabolic FDG PET scans. Nineteen patients had complete MRI and PET scans which were suitable for interpretation and these were included in the final analysis.
Three months postoperatively, the patients underwent a repeat cine-MRI for assessment of wall motion and thickening.
Positron emission tomography
Patients underwent PET studies to assess regional myocardial perfusion with 13N-NH3 ammonia22–26 and exogenous glucose utilisation with 18F-FDG.27,28 Imaging was done with a Siemens Exact 31 PET scanner (CTI PET System Inc, Knoxville, Tennessee, USA). The imager produces 31 slices with a slice separation of 3 mm, resulting in a volume image 10.6 cm deep. Reconstructed image resolution is 10 mm. Before imaging, patients ingested a solution containing 50 g glucose and then underwent a 20 minute transmission scan using three revolving rod sources to correct for attenuation. An injection of 370 MBq (1.5 mSv) 13NH3 was given intravenously and dynamic PET data were acquired continuously, beginning at the time of injection and continuing over the next 15 minutes. A dose of 185 MBq (0.5 mSv) of FDG was injected intravenously one hour after the ingestion of oral glucose. Diabetic patients (n = 2) received intravenous soluble insulin at a dose of 4–10 units according to their serum glucose concentration. ECG gated data acquisition was started 50–60 minutes after the FDG injection. These data were reconstructed to create tomographic images of regional myocardial FDG uptake.
Careful attention was paid to maintaining the patient in a constant position within the scanner for the duration of both parts of the study, using a marker on the chest wall.
BOLD MRI scans
Subjects underwent MR imaging using a 0.95 Tesla Siemens Impact imager (Siemens Inc, Erlangen, Germany), with 15 mT/m gradients and a 15 T/m/s slew rate, using the system’s standard body RF coil. Multiple temporal cine-MR images were obtained in the short axis, positioned with the end systolic long axis view as the frame of reference, using an ECG gated breath held segmented k space FLASH sequence (seven lines per RR interval), with a frame separation of 80 ms. Seven cardiac phases were obtained. The field of view was 400 × 400 mm with time of repetition (TR) = 11.9 ms between readout pulses, a flip angle of 30°, slice thickness 8 mm, one signal average, and matrix size 140 × 256. The raw data were reconstructed using the standard cross sectional (2D) Fourier transformation algorithm. Four non-contiguous slices were imaged sequentially to cover the length of the left ventricle.
T2* weighted images were acquired in two central short axis positions by a multiple breath held, ECG gated, quadrature combination technique.29 Two successive acquisitions with 90°–τ–90° preparation schemes were acquired, with the second 90° preparation pulse’s phase shifted by 90° in the second acquisition. The first acquisition results in an image modulated by cosϕ and the second modulated by sinϕ (where ϕ is the off-resonance phase shift which occurs during τ30). The two images obtained are then combined in quadrature to give a T2* weighted image (fig 1). Some residual banding is still expected on the combined image owing to evolution of longitudinal z magnetisation following the preparation scheme. A full explanation of this effect is beyond the scope of this article but it is discussed elsewhere.30

Magnetic resonance images of BOLD (blood oxygen level dependent) sequence. (A) Resting 90 x image. (B) Resting 90 y image. (C) Quadrature combination of images A and B. (D) Stress quadrature combination.
The quadrature combination acquisitions were done with τ = 28 ms and time of echo (TE) = 7 ms, such that fat and water signals were in phase. The TR between readout pulses was 11.9 ms, with flip angle 30°, matrix size 126 × 256, slice thickness 8 mm, and field of view 400 × 400 mm. Nine lines of k space were acquired per heart beat, resulting in a breath hold time of approximately 14 seconds depending on heart rate.
The ECG was monitored continuously and blood pressure measured before and after the dipyridamole infusion. ECG gated images were acquired at rest and three minutes after dipyridamole induced stress (0.56 mg/kg, infused over four minutes through an antecubital vein).
Data analysis
The PET images were reconstructed,31,32 rotated, and resliced to generate short axis sections of the myocardium, which were subsequently analysed using circumference profile analysis to produce polar maps diagrammatically showing the myocardial distribution of the tracers (fig 2). The middle two short axis slices corresponding to the MRI slices were divided into eight segments and analysed for the presence of hibernation or scarring.

Positron emission tomography in a patient with three vessel disease. Row A: the 18F-FDG metabolic images. Row B: the 13 N-NH3 perfusion images. Row C: the perfusion polar map (left), and metabolic polar map (right). Row D: the mismatch polar map (left) and viability (right). This figure shows an area of perfusion metabolism mismatch (hibernating myocardium) in the inferolateral wall.
Regional myocardial blood flow and FDG uptake
The analysis of PET imaging for blood flow and glucose uptake has been described in detail previously.31 In brief, the myocardial region with the highest uptake of 13NH3 was taken as the reference 13NH3 concentration for that patient. The abnormally perfused areas were compared semiquantitatively with the reference area. The glucose uptake in the reference area was regarded as the reference FDG uptake, to which the rest of the myocardium was compared.
Regional FDG uptake relative to blood flow
The two mid-ventricular short axis slices corresponding to the MRI were divided into eight segments, and the regional FDG data were interpreted in relation to regional myocardial blood flow. Areas of the myocardium were defined as suggestive of hibernation if 13N-NH3 was reduced, FDG uptake was increased, and contraction reduced (mismatched defect).33 The assessment of mismatch was carried out qualitatively by simultaneous inspection of perfusion and metabolism images.2218F-FDG activity in each region of interest was classified as normal (> 50% of activity in the reference region associated with normal blood flow), absent (< 50% of reference activity), or viable but ischaemic (> 50% of reference FDG activity associated with reduced myocardial blood flow34–38). All regions with absent FDG activity were considered to indicate myocardial fibrosis (fig 2).
MRI analysis
MR images were transferred to an off-line workstation and processed using a home written package.39 In each patient, corresponding short axis tomograms from mid-left ventricle at rest and stress were analysed for signal change on BOLD MRI. The myocardium in each of the slices was identified using a semi-automated edge detection method.39 These slices, in turn, were then aligned with the corresponding short axis tomographic images of myocardial FDG uptake. Thus corresponding myocardial slices from the PET and MRI data were analysed for each patient, with two short axis tomographic planes evaluated per patient.
The mean and standard deviation of the signal intensity within each region of interest (ROI) were then calculated. The signal intensity change from pre- to post-dipyridamole stress was defined as either percentage change in mean ROI intensity or as a z score, calculated using the standard formula. A positive change—that is, an increase in signal intensity related to an increase in T2* relaxation time—is the result of a decrease in paramagnetic deoxyhaemoglobin concentration caused by vasodilatation and an increase in blood flow, as seen in normally perfused areas of the myocardium. A decrease or no significant change in signal intensity is caused by an increase in deoxyhaemoglobin concentration related to the stress on the myocardium without a concomitant dilatation of the coronary artery, indicating reduced perfusion caused by a narrowing in the corresponding coronary artery.
A z score greater than 1.96 is taken as representing a significant increase in intensity with stress, which implies a decrease in deoxyhaemoglobin concentration and therefore normal vasodilatation. A z score between +1.96 and −1.96 means no significant change in signal intensity with stress, implying no vasodilatation. A z score of less than −1.96 represents a significant decrease in signal intensity with stress, indicating an increase in deoxyhaemoglobin concentration. The equivalent percentage change is approximately ±4.5%.
The regional FDG activities were analysed and areas of hibernation or scarring identified, based on the presence of mismatch between perfusion and FDG uptake. To facilitate the comparison of relative regional FDG and signal change on MRI, eight regions of interest were constructed on each FDG and MRI tomogram (fig 3).

Bull’s eye projection of signal change in two mid-ventricular slices, with corresponding scale.
The signal change between rest and stress on BOLD MRI and the wall thickening were determined and compared in hibernating and scarred segments as identified by PET.
Statistics
Data are presented as mean (SD). Hibernating and scarred segments were compared using Student’s t test. A probability value of p < 0.05 indicates a significant difference between the mean values.
RESULTS
We undertook MRI imaging on 22 patients. However, three of these did not have satisfactory image quality. This was because of a poor ECG trace that prevented gating in two patients, and because of the inability of one patient to hold his breath long enough for image acquisition.
Nineteen patients had both PET and BOLD MRI, of whom 17 (90%) showed at least one area of hibernation, and 10 (53%) at least one area of myocardial scarring.
Using PET, 68 segments were identified as hibernating, based on the presence of perfusion/metabolism mismatch, and 42 segments were identified as scarred, based on the absence of metabolic activity. The average BOLD MRI percentage signal intensity change was −9.53 (15.9)% in the hibernating segments, while it was −2.15 (15.2)% in the scarred segments (fig 4).

Box and whisker plot of BOLD (blood oxygen level dependent) percentage signal change between rest and dipyridamole stress. Hyb, hibernating; Others, rest of myocardium.
Comparing the hibernating with the scarred segments produced a t value of −2.42 (p = 0.008). The average percentage signal change in the rest of the myocardium was −8.2 (13.2)% and was significantly different from the scarred areas (p = 0.009), but not from the hibernating segments (p = 0.2) (table 1).
Comparison of percentage BOLD signal intensity change between scarred myocardium, hibernating myocardium, and the rest of the myocardium
The average wall thickening in the hibernating segments was 8.7 (4) mm compared with 5.9 (2) mm in the scarred segments, with a t value of 4.2 (p < 0.0001) (fig 5). Again, no difference in wall thickening was found between hibernating segments and the rest of the myocardium (p = 0.1) (table 2).
Comparison of average wall thickness between scarred myocardium, hibernating myocardium, and the rest of the myocardium

Box and whisker plot of wall thickening on cine-MRI. Hyb, hibernating; Others, rest of myocardium.
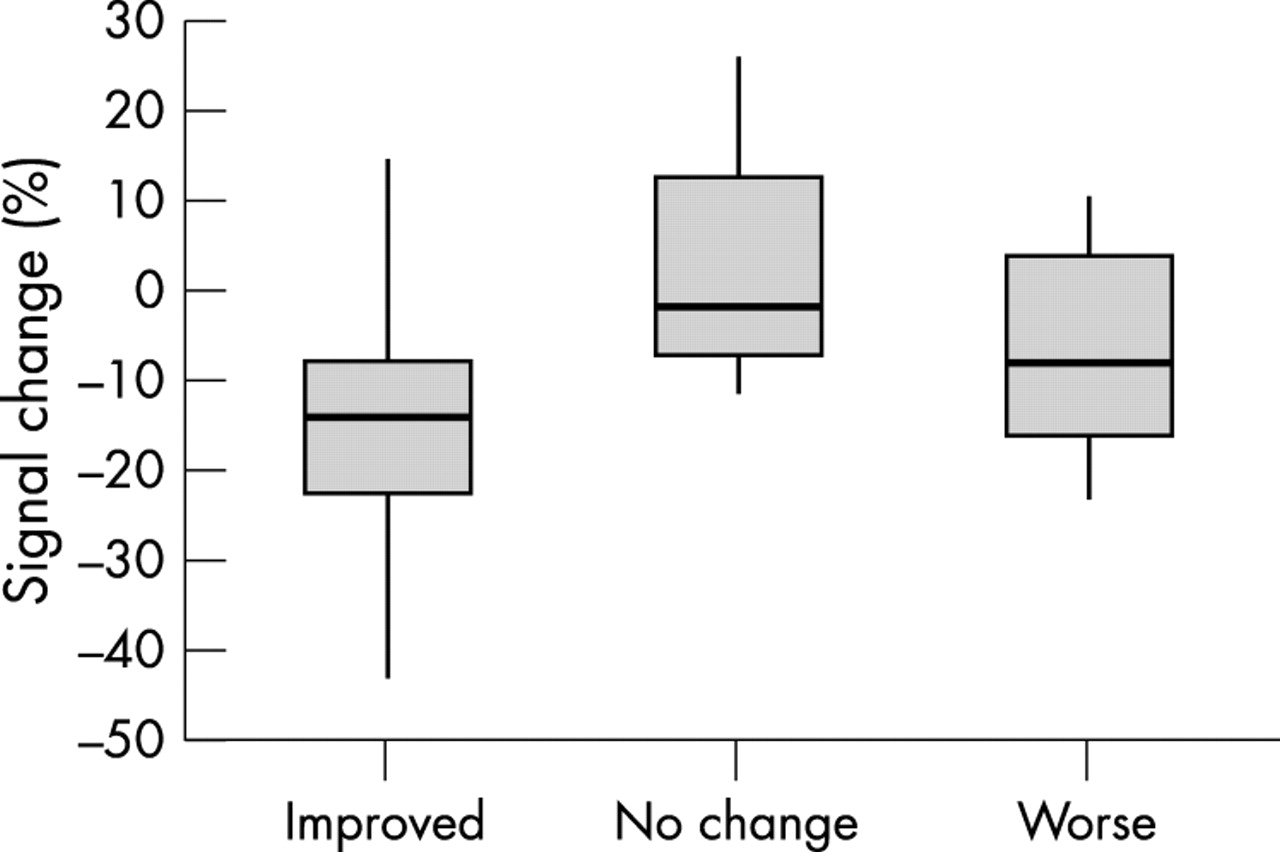
Three months postoperatively, 15 of the 19 patients had a cine-MRI for wall motion assessment. Of four patients who did not have a cine-MRI, one refused to undergo the scan again, while three did not have good quality images for interpretation owing to poor gating in two and susceptibility artefact in one. The total number of hibernating segments analysed postoperatively was 52. Of these 52 segments, 28 (54%) showed improved wall thickening (average 1.5 mm), 14 (27%) showed no change in wall thickening, while the other 10 segments (19%) showed worsening wall thickening (average −1 mm).
The BOLD percentage signal change in the hibernating segments which improved postoperatively was −15.5 (12.9)%, with a signal change of −2.27 (13.3)% in segments that showed no change, and a change of −7.22 (10.6)% in segments that worsened (fig 6 and table 3).
Comparison of percentage BOLD magnetic resonance imaging signal intensity change in hibernating segments where the postoperative wall thickness improved, worsened, or showed no change

Box and whisker plot of BOLD (blood oxygen level dependent) percentage signal change between rest and dipyridamole stress in hibernating myocardium, based on postoperative wall thickening change.
DISCUSSION
Assessment of myocardial viability in chronic coronary artery disease with impaired left ventricular contraction is crucial to making clinical decisions about further management.7–9 The presence of regional akinesia in the left ventricle does not necessarily indicate the absence of salvageable myocardium, as the myocardium in some of these regions contains viable rather than scarred tissue.5,6,31 Current non-invasive imaging methods have inherent limitations and disadvantages. PET is expensive, with limited availability, and it has the disadvantage of radiation exposure, as do thallium nuclear scans, which suffer from poor spatial resolution. Dobutamine stress echocardiography, while specific for viable myocardium, is not possible in the presence of a poor echocardiographic window (found in 5–20% of patients). Recent technical advances in MRI and the advent of fast MRI acquisition methods during breath hold have led to significant improvements in image performance and quality. This allows the study of the influence of paramagnetic contrast agents on myocardial signal intensity with much greater temporal resolution and accuracy. MRI is emerging as an important tool in cardiac diagnosis, with its ability to provide simultaneous information on function, anatomy, and perfusion.
MRI assessment of myocardial viability
MRI studies in acute myocardial ischaemia and infarction have been reviewed previously.40 It has been suggested that prolongation of T1 and T2 relaxation times without contrast infusion indicate loss of viability after myocardial infarction. Because of the excellent spatial resolution of MRI, measurements of regional wall thickening have also been of interest in assessing myocardial viability in chronic ischaemic heart disease. Concordance has been found between segment viability graded by end diastolic wall thickening and SPECT 99mTc-methoxyisobutyl-isonitrile uptake.41 Although thin, akinetic myocardium can represent irreversibly scarred tissue, many of these thin akinetic segments, identified on spin echo gated MRI, were found to be metabolically active by FDG-PET imaging.42 This finding underscores the need for further refinement of MRI techniques for predicting myocardial viability. The use of contrast agents has enhanced the ability of MRI to distinguish infarcted from viable myocardium.43,44 Intravenous Gd-DTPA and other paramagnetic compounds result in a shortening of both T1 and T2 relaxation times. The signal enhancement caused by these agents is proportional to the tissue concentration.45 Tissue contrast depends on difference in tissue perfusion, blood content, size of extracellular space, and myocardial contrast distribution.
The use of T2* MRI and deoxyhaemoglobin as endogenous contrast has not previously been evaluated in the detection and differentiation of viable and scarred myocardium.
In our study, we assessed T2* BOLD MRI signal changes and wall thickening difference in scarred and hibernating myocardial segments in patients with impaired left ventricles and areas of akinesis. Scarred myocardial segments have significantly reduced signal changes and wall thickening between rest and pharmacological stress when compared with viable myocardium. Scarred segments could be differentiated from viable segments using BOLD MRI signal change and wall thickening measurement.
The development of navigator techniques may help to overcome the breath hold problem and improve patient compliance, particularly in patients with inadequate respiratory reserve. By careful patient instruction in breath holding techniques, and by acquiring all breath hold images at expiration, the reproducibility of the breath holds was improved, such that no image misregistration was noted between subsequent T2* weighted breath hold images on image quadrature combination.
We adopted a novel T2* BOLD acquisition method different from that used in previous studies,15–21 and used the “snapshot method” to reduce the time of breath holding to a minimum.29 Although the approach adopted resulted in the need for multiple breath holds per T2* weighted image, various strategies could be employed to reduce the acquisition times to a single breath hold on a more modern high performance 1.5 T scanner with phased array RF coil technology. These include the use of hybrid EPI and segmented k space techniques46 to maximise the number of k space lines collected per cardiac cycle after each preparation sequence. It may also be possible to minimise the number of k space lines required to form the image using MRI acquisition techniques such as SMASH47 or SENSE,48 but at the cost of signal to noise ratio.
A recognised difficulty in studies of this type—in patients with ischaemic myocardium and severe three vessel coronary artery disease—is the inhomogeneity of the myocardium, with overlapping viable, scarred, and ischaemic areas and no sharp distinction between these areas. We believe that the inhomogeneity of the myocardium in this group of patients may have led to the similarity in signal change between hibernating and ischaemic but normally contracting segments, as we calculated the average for the whole segments. Limiting the patients studied to this group (with at least one akinetic segment) was necessary to examine the scarred myocardium, but was likely to have minimised the chances of detecting any difference between hibernating myocardium and the rest of the myocardium, which contains both normal and ischaemic areas.
The inhomogeneity could also explain the fact that few of the scarred segments showed a positive wall thickening and a change of the signal similar to other segments. It has been shown with FDG studies that scarred myocardium still has some metabolic activity41 and the scars do not span the full thickening on contrast MRI.43 It is likely that these scarred areas represent a mixture of akinetic and partially contracting portions and have some thickening when evaluated by a high resolution method such as MRI.
To assess how well BOLD MRI distinguishes between hibernating and ischaemic myocardium, it would be interesting to try and study a more defined group of patients with a single occluded vessel and one area of akinesia, the rest of the ventricle being normal. The expected response of the hibernating segments is to show an improvement in contractility after revascularisation. However, the time frame of the contractile recovery of the myocardium is not known, and the lack of improvement in some of the segments could represent a delayed recovery, or a problem with graft flow and patency. Previous studies have found that only 62–88% of the myocardial regions with normal uptake of FDG had improved function after revascularisation.34,49
Several other factors may account for the lack of functional improvement in some regions deemed viable—for example, the use of a single evaluation of left ventricular function, tethering of regions with extensive scarring to viable regions, and incompleteness of coronary revascularisation, even if technically successful, in patients with extensive and diffuse coronary disease. The evaluation of wall motion and thickening recovery will be the subject of a forthcoming study in this group of patients at six and 12 months, and to evaluate any delayed recovery. Repeat 13NH3 perfusion images with comparison to the preoperative ones would help assess graft flow and patency.
In previous publication where BOLD MRI was used for the detection of ischaemic rather than scarred or viable myocardium, there was some difficulty in assessing the inferolateral borders of the heart and the areas supplied by the right and circumflex coronary arteries because of susceptibility artefacts.15 Our present study offers a new way of overcoming this problem using the snapshot method in image acquisition with quadrature combination, and data analysis by the semi-automated edge detection method.
Our findings indicate that scarred myocardium could be differentiated from viable myocardium using T2* BOLD MRI and wall thickening. As a result, the use of BOLD MRI could be a valuable tool for identifying patients who would be suitable or unsuitable for referral for surgical revascularisation. This would be done without the use of exogenous contrast or radiation, and would offer a simultaneous accurate assessment of the cardiac function and anatomy, all in one setting.
Limitations of the study
This pilot study was done using a moderate gradient performance 0.95 T clinical MRI scanner without the use of phased array technology and a higher field scanner, which were not available to us at the time. The significance of our results suggest that further studies should be performed at higher field strengths (where the BOLD effect causes larger variations in T2*50), using dedicated cardiac phased arrays coils to optimise image quality and T2* weighted contrast. This would also help improve image resolution and the detection of signal changes that are small but significantly different between scarred myocardium and other areas.
The information obtained from BOLD images is not anatomical, but the quantitative data suggest a difference between viable and scarred myocardial signal despite the overlap. Every effort was taken to ensure that the same slices were being imaged with MRI and PET studies to help minimise any misregistration.
Although we are encouraged by these results, further larger prospective studies—done at higher field strength with cardiac coils—are needed to establish a threshold for detection and a value for the level of signal change for identification and differentiation of scarred and viable myocardium. In addition, the sensitivity and specificity of this MRI technique need to be established.
Conclusions
In patients with chronic coronary artery disease and impaired left ventricular contraction, scarred myocardium (as identified by PET, which was taken as the gold standard) showed a different signal intensity change on T2* weighted BOLD MRI. The BOLD MRI technique may prove useful in evaluating such patients and may help in selecting suitable referrals for revascularisation. Further prospective studies are needed.
Acknowledgments
Chest, Heart & Stroke Scotland (CHSS), grant number R98/4, Dr James Alexander Mearns Trust for Financial support during this project. We also thank MRI and PET technicians for their efforts and help.