Article Text

Abstract
Objective This study aims to determine the relationship between door-to-balloon delay in primary percutaneous coronary intervention and ST-elevation myocardial infarction (MI) outcomes and examine for potential effect modifiers.
Methods We conducted a systematic review and meta-analysis of prospective observational studies that have investigated the relationship of door-to-balloon delay and clinical outcomes. The main outcomes include mortality and heart failure.
Results 32 studies involving 299 320 patients contained adequate data for quantitative reporting. Patients with ST-elevation MI who experienced longer (>90 min) door-to-balloon delay had a higher risk of short-term mortality (pooled OR 1.52, 95% CI 1.40 to 1.65) and medium-term to long-term mortality (pooled OR 1.53, 95% CI 1.13 to 2.06). A non-linear time–risk relation was observed (P=0.004 for non-linearity). The association between longer door-to-balloon delay and short-term mortality differed between those presented early and late after symptom onset (Cochran’s Q 3.88, P value 0.049) with a stronger relationship among those with shorter prehospital delays.
Conclusion Longer door-to-balloon delay in primary percutaneous coronary intervention for ST-elevation MI is related to higher risk of adverse outcomes. Prehospital delays modified this effect. The non-linearity of the time–risk relation might explain the lack of population effect despite an improved door-to-balloon time in the USA.
Clinical trial registration PROSPERO (CRD42015026069).
- reperfusion timeliness
- door-to-balloon time
- pre-hospital delays
- primary percutaneous coronary intervention
- myocardial infarction
- meta-analysis
Statistics from Altmetric.com
- reperfusion timeliness
- door-to-balloon time
- pre-hospital delays
- primary percutaneous coronary intervention
- myocardial infarction
- meta-analysis
Introduction
Primary percutaneous coronary intervention (pPCI), a mechanical means of reopening the occluded artery,1 is the preferred treatment option for acute myocardial infarction (MI) with ST-segment elevation (STEMI). Door-to-balloon (D2B) time of greater than 90 min is generally considered a modifiable system delay and target for quality efforts. The focus of improvement has recently shifted from the measure of ‘D2B delay’ to the ‘first medical contact-to-device activation (C2D) delay’, where a wider continuum of care is considered.1 Yet, D2B time still remains a relevant quality indicator for many health systems today, particularly in settings where various in-hospital delays continued to pose a challenge.
Despite the significant improvement in D2B delay across many healthcare systems over the past decade,2 recent studies in the USA have shown that the overall mortality of patients undergoing pPCI at a population level remains unchanged.3 4 Because D2B time represents only a small fraction of the total ischaemic time in reality, it has been postulated that its improvement might not have a significant effect on the reduction of the total ischaemic time, especially in those with substantial prehospital delays. An opposing view has suggested that the increasing use of pPCI among the higher risk patients over time as pPCI use in STEMI has expanded is the primary contributor to explain the lack of impact.4
Despite many studies evaluating the D2B delay–outcomes relationship and this recent controversy,5–13 there has been a lack of high-quality systematic review and meta-analysis assessing such relationship, making an overall assessment of the value of this quality indicator difficult. Previously published reviews5 6 neither assessed the quality nor performed a quantitative synthesis on the evidence. Furthermore, the effects of patient risk level and the extent of prehospital delay on the D2B delay–outcomes relationship have not yet been explored above the level of individual studies. Thus, we perform a systematic review and meta-analysis to determine the relationship between D2B delay and mortality and other STEMI outcomes. We also examine the effect of potential effect modifiers such as prehospital delay and patients’ risk profile on the relationship.
Methods
Data sources and search strategy
We searched PubMed, EMBASE, ClinicalTrials.gov, WHO International Clinical Trials Registry, CINAHL Database and The Cochrane Library from 1977 (the year the first angioplasty was performed) to December 2016. We also have sourced proceedings and theses for the past 20 years from various sites (details in online supplementary appendix 3). No language restriction was applied. The search strategy is provided in online supplementary appendix 3.
Supplementary file 1
Study selection
Inclusion criteria are a prospective observational study that has investigated the relationship of D2B time and at least one of the clinical outcomes specified below in adult (older than 18) patients with STEMI.
Exposure variable
D2B time refers to the length of time from arrival of a patient with STEMI at the hospital to either needle entry, balloon inflation or any other device deployment (indicating the time he/she receives the intervention). We used hospital arrival to balloon inflation time when a study provided multiple time points. Studies that use different time lengths, such as door-to-Thrombolysis in Myocardial Infarction (TIMI) 3 (re-establishment of normal blood flow in the infarct-related artery) and enrolment-to-balloon time, and studies without an explicit definition of D2B time were included for pooling in our sensitivity analyses.
D2B delay is generally defined as the D2B time of 90 min or longer. We categorised the included studies per the cut-off points used and the comparison made. Studies that compared between D2B time <90 min and >90 min in a dichotomous fashion were considered for primary analysis. Studies that used different dichotomous cut-off points, such as <30 min versus >30 min, and studies that compared a different reference time range with several time ranges (eg, <30 min vs 31–60 min and >60 min) were considered for pooling in sensitivity analyses. For the latter group of studies, we used the effect estimates of the nearest reported comparison, for example, <30 min versus 31–60 min, for pooled analysis. Studies that treated the D2B time as a continuous variable were pooled separately. The effect sizes were rescaled to approximate the effect size of a per 30 min’ increment of D2B time.
Outcomes of interest
Mortality and incident heart failure were the predetermined primary outcomes of interest. Eligible mortality outcomes included all-cause mortality of any follow-up length.
Secondary endpoints included cardiac arrest (not resulting in death), tachycardia and bradycardia, cardiac wall aneurysm and ejection fraction (EF). We categorised these outcomes into short-term (in-hospital and 30-day endpoints) and moderate-term to long-term (>30-day endpoints) and reported them accordingly. Other endpoints include in-hospital shock, reinfarction and combined endpoints (major adverse cardiac events, MACEs).
Quality assessment
Methodological quality was assessed using the Newcastle-Ottawa Scale (NOS). Comparability between the two exposure groups (ie, short vs long D2B delay group) was further scrutinised by comparing the confounding factors adjusted in each study against a list of predefined confounding domains (see online supplementary appendix eTable 6.2) identified using subject matter knowledge and a review of the literature.7–13 The Grading of Recommendations, Assessment, and Evaluation framework was used to evaluate the quality of evidence and strength of recommendations.
Data synthesis and sensitivity analysis
We use a random-effects model to pool the relative effects from each study (ie, OR, HR) either based on the unadjusted or the most adjusted analyses for each outcome where data are available. Statistical heterogeneity was assessed using I2 statistics. We evaluated the presence of small-study effects visually using funnel plot. When the number of studies for an outcome of interest was larger than 10, we also tested for funnel plot asymmetry and its potential effect using the Begg rank correlation test.
We assessed if the estimates were sensitive to variance of D2B delay cut-off point and time length definition used as stated above. Other sensitivity assessments include restricting the analyses to (1) studies of low risk of bias (NOS >7), (2) studies that reported adjusted relative effect (excluded crude estimates) and (3) studies that reported OR (excluded HR). Meta-regression was used to explore the impact of the study-level quality score on outcomes that contain more than 10 studies.
Subgroup analyses and dose–response analysis
We conducted the subgroup analyses based on the following variables: (1) risk level (high risk vs low risk, see online supplementary appendix eTable 11.1 for summary of definition); (2) data source (data from clinical trials vs data of clinical registry or hospital database); (3) early versus late presenter (delay between symptom onset to hospital arrival, see online supplementary appendix eTable 11.2 for summary of definition and cut-off points used); (4) study setting (high-income country vs non-high-income country) and (5) geographical region (Asia, North America and the UK and Europe).
In addition, we performed a dose–response meta-analysis using the method formalised by Greenland and Longnecker.14 A non-linear relationship between D2B time and mortality risk was modelled using the random-effects restricted cubic splines regression approach15 with 3 knots at fixed centiles (30%, 60% and 90%). A log-linear model was also explored. A Wald test was used to compare the non-linear model with the log-linear model for the probability of non-linearity (further details of the method are provided in online supplementary appendix 9).
We used R version 3.3.1, the meta-package and the dosresmeta package for the statistical analysis. All P values are two-tailed and we considered P<0.05 as the threshold for statistical significance. Further study details are provided in online supplementary appendix 1 (study protocol), online supplementary appendix 2 (Meta-analysis Of Observational Studies in Epidemiology (MOOSE) checklist), online supplementary appendix 4 (data extraction) and online supplementary appendix 13 (data).
Results
Study selection
Databases and handsearching yielded 8323 citations. Eight thousand one hundred and sixteen studies were excluded based on our initial abstract screening and a further 172 were excluded after full-text assessment. Thirty-five studies16–50 met the inclusion criteria (online supplementary appendix eFigure 5.1), Thirty-two studies involving 299 320 patients16–24 26 28–31 33–50 contained adequate data for quantitative reporting. Two studies46 47 involve an overlapped study cohort. We reported the results of both studies46 47 but pooled only the larger study in the subsequent meta-analysis. Hence, only 31 studies16–24 26 28–31 33–45 47–50 entered the quantitative synthesis. Description of each included study and the outcomes reported are shown in online supplementary appendix eTables 5.1–5.3.
Assessment of methodological quality
Eight17 19–22 26 35 42 out of the 35 included studies were of fair quality (low to moderate risk of bias), with 8 or more points on the NOS Quality Scale (online supplementary appendix eTable 6.1). ‘Comparability’ was the domain of quality that appeared to be most lacking. Twelve studies16 25 27 30 36–39 41 44 48 50 provided only crude estimates of the D2BT–outcome relationship (online supplementary appendix eTable 6.3).
Among the 23 studies17–24 26 28 29 31–35 40 42 43 45–47 49 that performed at least some degree of statistical adjustment, only 1217–22 26 28 33–35 42 included at least some potential confounding factors beyond those related to individual clinical risk factors, such as the processes of care, daytime and institutional factors. Domains of confounding that were most commonly adjusted were patients’ demographics, comorbidities and clinical state on presentation (online supplementary appendix eTable 6.3). Only 14.3% (five studies19 21 22 26 28) and 8.6% (three studies20 21 33) of the included studies considered at least some degree of daytime and hospital factors, respectively. Only one21 study considered at least one factor across all eight confounding domains.
Primary outcomes
Mortality
The primary analyses for mortality outcomes include pooling 10 studies18 20 21 37–39 41 47 48 50 (57 136 patients) for short-term (in-hospital or 30-day) mortality and 8 studies (14 261 patients)18 20 25 34 44 46 48 50 for medium-term to long-term (6-month to 12-month) mortality. Overall, longer D2B delay (>90 min) when compared with shorter delay (<90 min) was associated with significantly higher short-term mortality (pooled OR 1.52, 95% CI 1.40 to 1.65, I2=16.2%) and medium-term to long-term mortality (pooled OR 1.53, 95% CI 1.13 to 2.06, I2=55.0%) (table 1). Statistical heterogeneity between studies was negligible for short-term mortality (<30%) but was moderate for medium-term to long-term mortality. The crude and adjusted effect estimates did not differ significantly (interaction P value =0.43 for short-term mortality and 0.22 for medium-term to long-term mortality).
Relative effects of longer (>90 min) versus shorter (≤90 min) door-to-balloon delay on various clinical outcomes*
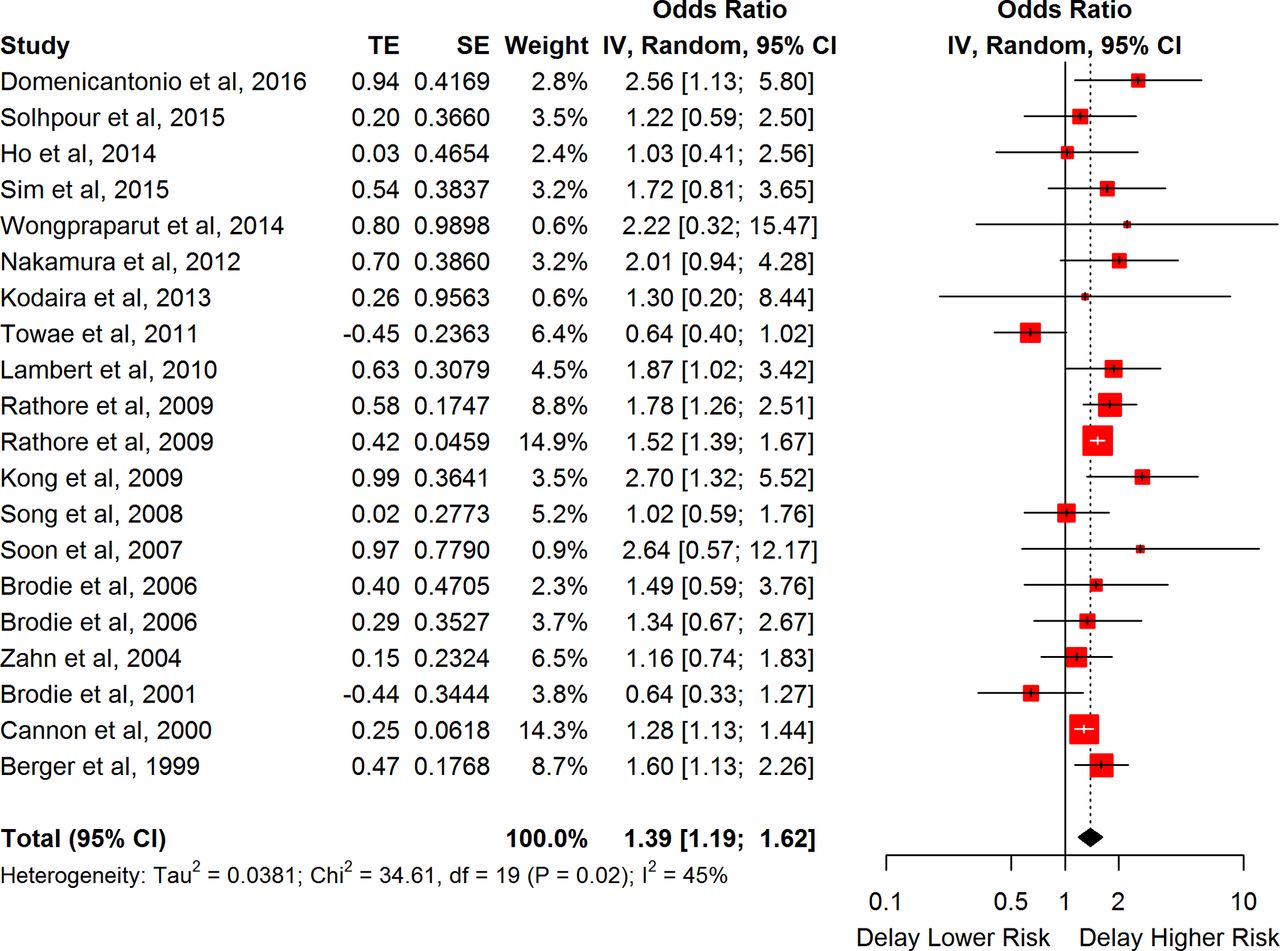
In sensitivity analyses, we found no discernible differences for the estimates compared with the primary analyses (figure 1 and online supplementary appendix eFigure 7.2). These findings were also insensitive to analyses that restricted to pooling only studies that reported adjusted effect, studies that reported OR and studies of low risk of bias (NOS >7) (table 1 and online supplementary appendix eFigures 7.1–7.3).

Relative effects of longer versus shorter door-to-balloon times on short-term myocardial infarction with ST-segment elevation mortality (sensitivity analysis—pooling all studies that estimated the effect of D2B delay on mortality regardless of D2B time definition and cut-off point used). TE, treatment effect; D2B, door-to-balloon.
In subgroup analyses, longer D2B delay was found to be associated with higher mortality among those who presented early (pooled HR 1.48, 95% CI 1.25 to 1.76, I2=0.0) but not among those who presented late (pooled HR 1.06, 95% CI 0.79 to 1.41, I2=0.0) (table 2 and figure 2). There was a statistically significant difference in the effect estimates in between the two subgroups (Cochran’s Q 3.88, P value 0.049). Other subgroup analyses otherwise showed no significant differences (table 2 and online supplementary appendix 8).

The association between door-to-balloon times and short-term mortality for those with longer and shorter prehospital delays. TE, treatment effect.
Relative effects of longer door-to-balloon delay (vs shorter) on myocardial infarction with ST-segment elevation mortality by subgroup factors
Visual inspection of the funnel plots for studies of mortality revealed no obvious asymmetry (online supplementary appendix eFigures 7.10, 7.11). Rank correlation test for funnel plot asymmetry for studies of short-term mortality was not statistically significant (t=0.26, P value=0.80). An exploratory meta-regression analysis of the effect of study-level quality on short-term mortality suggested that studies with higher quality score were associated with a stronger effect estimate (beta 0.07, 95% CI 0.02 to 0.12, P=0.01) (figure 3 and online supplementary appendix 10).

Meta-regression of log OR (studies of short-term mortality) per study-level quality score. NOS, Newcastle-Ottawa Scale.
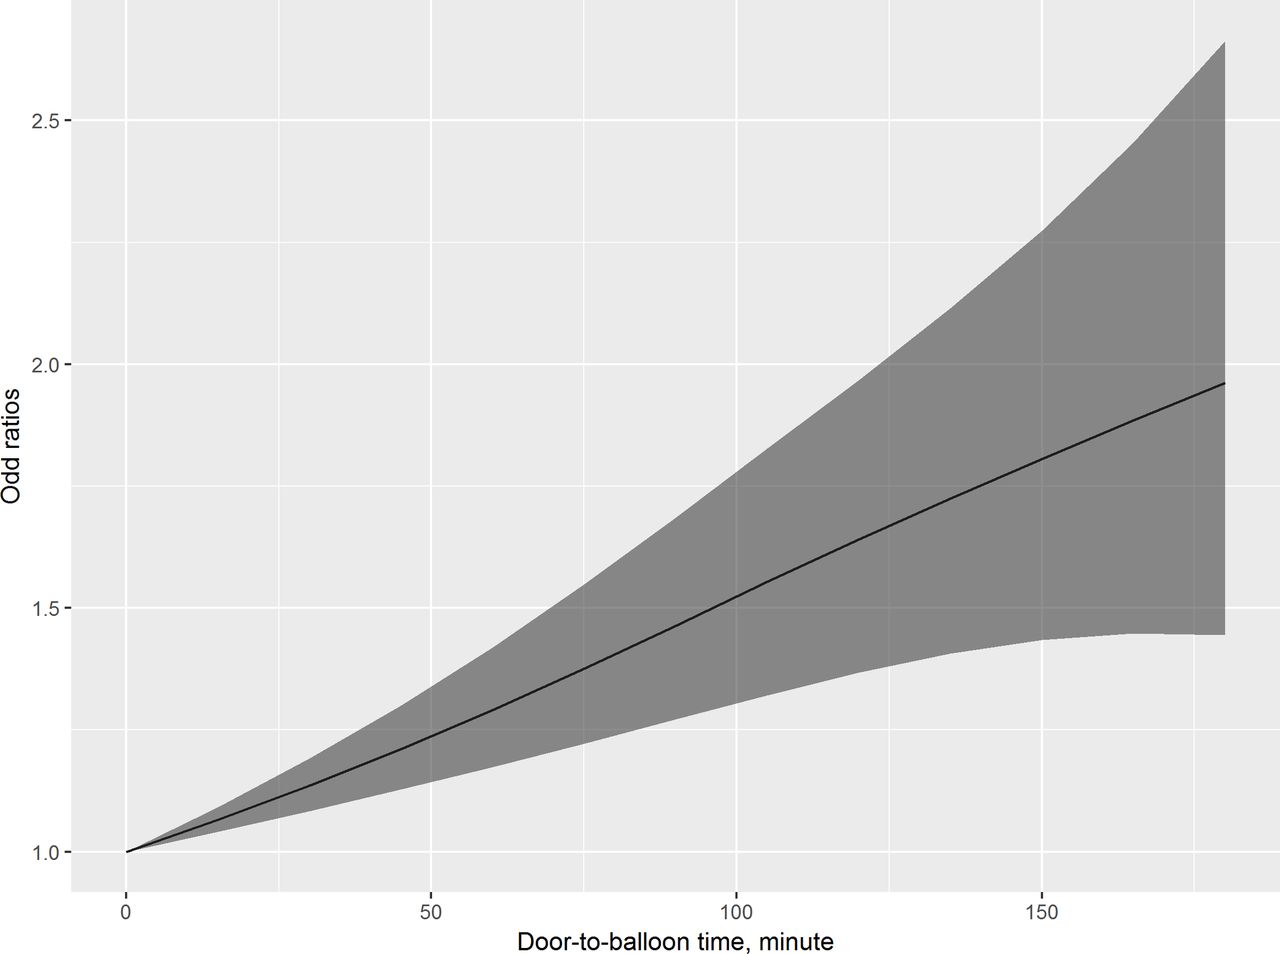
Eight studies16 20 23 24 33 43 47 48 were included in the dose–response analysis, with 4455 cases among the 82 356 subjects. Using the splines model, a non-linear dose–response relation was observed in between D2B time exposure and short-term mortality risk (figure 4 and online supplementary appendix eFigure 9.1) with considerable level of heterogeneity across studies (P=0.004 for non-linearity, I2=72.2%). Compared with D2B time of 30 min, the estimated ORs with 95% CIs were 1.14 (1.08 to 1.19), 1.29 (1.17 to 1.42), 1.44 (1.26 to 1.65) and 1.59 (1.31 to 1.92) for D2B time of 60 min, 90 min, 120 min and 150 min, respectively. Details of the dose–response analysis are provided in online supplementary appendix 9.

Dose–response meta-analysis of D2B time and risk of short-term mortality.
Three studies17 22 33 (n=184 153) with D2B time treated as a continuous variable for short-term mortality were pooled separately. In this pooled analysis, we found that every 30 min’ increase in D2B delay was associated with a 17% increase in the odds of short-term mortality (pooled OR 1.17, 95% CI 1.05 to 1.30) (table 1). Yet considerable statistical heterogeneity (I2=96.9%, P value<0.01, CI 94.0% to 98.5%) was observed among these estimates (online supplementary appendix eFigure 7.5).
Heart failure
One study18 (2356 patients) reported a statistically insignificant effect of D2B delay on clinical heart failure, which was defined as readmission for heart failure in 1 year (OR 2.02, 95% CI 0.92 to 4.40).
Secondary outcomes
Two studies24 47 reported statistically insignificant (crude) effect of D2B delay on EF at 7-month follow-up (unpooled due to differing D2B delay definition). We did not find any study for the other prespecified secondary outcomes we set out to search for.
No significant effect was observed when the two studies37 41 (375 patients) for in-hospital shock were pooled (pooled OR 4.51, 95% CI 0.56 to 36.06, I2=0.0) (table 1, also online supplementary appendix eFigure 7.6). Only medium-term to long-term recurrent MI (five analyses based on four studies,18 34 42 47 8730 patients, pooled OR 1.54, 95% CI 1.18 to 2.01, I2=0.0) and MACE (five studies,18 34 35 44 50 8322 patients, pooled OR 1.47, 95% CI 1.16 to 1.86, I2=75.5%) were found to be related to longer D2B delay (online supplementary appendix eFigure 7.7–7.9).
Quality of evidence
The quality of evidence for all outcomes was generally rated as low in most comparisons. More details of the quality of evidence are presented in online supplementary appendix 12.
Discussion
Patients with STEMI who experienced longer D2B delay are at higher risk of short-term mortality and medium-term to long-term mortality, MACE and reinfarction. An exponential-like non-linear time–mortality relationship is also demonstrated using a dose–response model. This non-linearity indicates that the impact of D2B time reduction is likely to be more significant when the baseline delay is longer than when it is shorter. The recently reported D2B time improvement in the USA was based on an already short baseline delay (83 min). Moreover, the magnitude of improvement was also small (16 min). Along with the possibility of an increased risk profile for those who received the intervention over time,4 the unchanged overall mortality rate is likely explained.
In addition, our analyses provided some evidence to suggest that the association between longer D2B delay and short-term mortality differed between those presented early and late. This signifies that the consideration of reperfusion timeliness should be extended beyond the hospital doors to the prehospital processes, supporting the paradigm shift of D2B time to C2D time. We were also able to demonstrate that studies exhibiting a higher level of methodological quality derived a stronger association with mortality—although all the studies were observational given the nature of the research question. This highlights the importance of basing policy decisions on the best available data when considering quality of care interventions.
Almost all related papers raised the concern of possible unmeasured or even unknown confounding factors as one important limitation to their conclusion. Previous reviews5 6 failed to consider this important aspect. Our quality assessment explicitly examined the extent of confounding adjustment of each individual study, represents an important component of this investigation. We found that only about 20% of these studies have adjusted some potentially important confounding factors such as angiographic attributes, care processes and prehospital delay. Surprisingly, only one21 out of the 35 included studies has considered at least some aspects of all relevant confounding domains important to ensure comparability between the comparison groups. These findings suggest that the above pooled effect estimates may be biased due to the potential unaccounted residual confounding.
This study has some limitations. First, we did not examine directly the relationship between the total ischaemic times on STEMI outcomes. Instead, we focused on the D2B time because it represents the delay that is most directly amenable by hospital process improvement. We highlighted the modifying effect of prehospital delay on the D2B time–outcome relationship. This indirectly allows us to infer the total system delay on STEMI outcomes. Second, pPCI has gained increasing popularity in many low-income and middle-income countries. Yet, only one such study41 was found in this review. It is possible that health system setting may differentially affect the effect of D2B delay on outcomes especially as prehospital delay may be markedly different in these systems. Third, some subgroup analyses contain sample sizes that are relatively small, and hence may be underpowered to detect a clinically meaningful difference. Fourth, existing literature lack the reporting of the study effects in absolute terms. The absolute effect magnitude is of higher relevance to policymakers and quality improvement managers in guiding population-level decision making. Future research should take into consideration this reporting need. Lastly, this study is limited by the lack of patient-level data, hence direct adjustment of confounding factors was not possible.
In conclusion, D2B delay in pPCI is related to higher risk of adverse outcomes among patients with STEMI. Hence, minimising this delay should remain an important part of the quality improvement effort of contemporary STEMI care, especially in settings where D2B delay remains significant. Prehospital delays modify the effect of D2B time on outcomes, hence improving this segment of the delay chain should not be overlooked.
Key messages
What is already known on this subject?
Recent studies in the USA have shown mixed findings of a population effect of door-to-balloon time reduction in primary percutaneous coronary intervention on ST-elevation myocardial infarction (MI) mortality.
What might this study add?
This study demonstrated the significant and consistent yet non-linear association between door-to-balloon delay and various adverse clinical outcomes, which was not previously available.
Stronger effect is seen among those with shorter prehospital delays, hence improvement in prehospital delays should not be overlooked.
How might this impact on clinical practice?
The non-linearity of the effect of door-to-balloon time on ST-elevation MI outcomes might explain the lack of population effect despite the recently reported improvement.
The modifying effect of prehospital delay on the time–outcome relationship signifies the importance of optimising the prehospital processes.
References
Footnotes
Contributors CYF and NC conceived and designed the study. CYF, NC and DDR wrote the protocol. CYF wrote the first draft. NC, DDR, BKN, CMR and TD contributed substantially to the interpretation of the data and revising the manuscript critically. CYF and KOB screened, extracted the data and performed the quality assessment. CYF has access to all the data in the study, analyses the data and takes responsibility for the integrity of the data and the accuracy of the analysis.
Funding This research received no specific grant from any funding agency in the public, commercial or not-for-profit sectors.
Competing interests BKN reported personal fees from American Heart Association, outside the submitted work.
Provenance and peer review Not commissioned; externally peer reviewed.
Data sharing statement Data used for the analyses are provided in Appendix 13. Other information—including literature searches, additional explanatory material and data extraction forms—are available on request.