Article Text

Abstract
Background Fractional flow reserve (FFR) aims to identify the extent of epicardial disease, but may be obscured by involvement of the coronary microvasculature. We documented the impact of hyperaemic stenosis resistance (HSR) and hyperaemic microvascular resistance (HMR) on FFR, and its relationship with myocardial ischaemia in patients with stable coronary artery disease.
Methods and results We evaluated 255 coronary arteries with stenoses of intermediate severity by means of intracoronary pressure and flow measurements to determine FFR, HSR and HMR. Myocardial perfusion scintigraphy (MPS) was performed to identify inducible myocardial ischaemia. In 178 patients, HMR was additionally determined in a reference coronary artery. Target vessel HMR was stratified according to reference vessel HMR tertiles. The diagnostic OR for inducible ischaemia on MPS of a positive compared with a negative FFR was significantly higher only in the presence of a high HMR (at the 0.75 and 0.80 FFR cut-off). Among stenoses with a positive FFR, the prevalence of ischaemia was significantly higher when HMR was high despite equivalent FFR across the HMR groups. This was paralleled by a concomitant significant increase in HSR with increasing HMR across groups. The relation between FFR and HSR (r2=0.54, p<0.001) was modulated by the magnitude of HMR, and improved substantially after adjustment for HMR (adjusted-r2=0.73, p<0.001), where, for epicardial disease of equivalent severity, FFR increased with increasing HMR.
Conclusions Identification of epicardial disease severity by FFR is partly obscured by the microvascular resistance, which illustrates the necessity of combined pressure and flow measurements in daily practice.
Statistics from Altmetric.com
Introduction
In the absence of non-invasive functional testing results, fractional flow reserve (FFR) is recommended for clinical decision making regarding coronary stenoses of equivocal angiographic severity.1 However, while FFR aims to identify the epicardial contribution to the impairment of myocardial perfusion, the latter is not only determined by the extent of epicardial narrowing. Alterations in the coronary microvasculature may contribute to, or may exclusively determine, the development of myocardial ischaemia.2–4 Moreover, such microvascular alterations may partly obscure FFR measurements, as they are likely associated with altered microvascular resistance.5 ,6 Combined assessment of the coronary circulation with intracoronary pressure and flow velocity measurements allows differentiation of the individual contribution of stenosis and microvascular resistance to coronary flow impediment. Moreover, non-invasive stress testing may provide further insight in this relationship by linking stenosis and microvascular resistance to inducible ischaemia. Accordingly, we sought to describe the relationship between FFR, hyperaemic microvascular resistance (HMR), and hyperaemic stenosis resistance (HSR) in a cohort of patients with stable coronary artery disease who underwent invasive and non-invasive ischaemia tests.
Methods
Data source
We evaluated patients with stable coronary artery disease referred for intracoronary evaluation of at least one intermediate coronary artery stenosis (40–70% diameter stenosis at visual assessment). These patients were enrolled in a series of study protocols,7–10 and patient and procedural characteristics were entered into a dedicated database. We excluded patients with ostial stenoses, serial stenoses, renal function impairment (MDRD calculated glomerular filtration rate <30 mL/min/1.73m2), significant left main coronary artery stenosis, atrial fibrillation, myocardial infarction <6 weeks prior to screening, prior coronary artery bypass graft surgery, or visible collateral development to the perfusion territory of interest. The institutional ethics committee approved the study procedures, and all patients gave written informed consent.
Myocardial perfusion scintigraphy (MPS)
Myocardial perfusion scintigraphy (MPS) was performed prior to coronary angiography to document the presence of reversible perfusion defects using 99mTechnetium sestamibi (MIBI) or 99mTechnetium tetrofosmin (Myoview, GE Healthcare, UK), according to a two-day stress/rest protocol. An expert panel of nuclear medicine physicians, blinded to the angiographic and physiological data, evaluated the scintigraphic images. Stress and rest images were semiquantitatively scored as normal or abnormal. Perfusion defects were classified as dubious, mild, moderate or severe. Improvement at rest of more than one grade was considered to be a ‘reversible’ perfusion defect. Improvement of just one grade or no improvement was considered to be a ‘persistent’ perfusion defect. The result was considered positive when a reversible perfusion defect was allocated to the perfusion territory of the coronary artery of interest.
Cardiac catheterisation and haemodynamic measurements
Cardiac catheterisation was performed within 1 week after MPS, during which angiographic images were obtained in a manner suitable for quantitative coronary angiography analysis (QCA). QCA was performed offline to determine percent diameter stenosis using validated software (QCA-CMS V.3.32, MEDIS, Leiden, The Netherlands). Distal coronary pressure and flow velocity were assessed with separate sensor-equipped guide wires during basal conditions and maximal hyperaemia, induced by an intracoronary bolus of adenosine (20–40 µg). Intracoronary pressure was measured distal to the target stenosis with a 0.014 inch pressure-monitoring guide wire (Volcano, San Diego, USA). Coronary flow velocity was measured immediately after pressure measurements, using a Doppler-tipped guide wire (Volcano, San Diego, USA). During coronary measurements, the operator was not aware of the MPS results.
From the recorded data, FFR was calculated as the ratio between mean distal coronary and mean aortic pressure during maximum hyperaemia, HMR was calculated as the mean distal coronary pressure to mean distal flow velocity ratio during maximum hyperaemia,5 and the HSR was calculated as the mean pressure drop to mean distal flow velocity ratio during maximum hyperaemia.10 Flow velocity measurements were additionally performed in a reference coronary artery, defined as a coronary artery with less than 30% epicardial narrowing. In the absence of significant epicardial disease in these reference vessels, reference vessel HMR was calculated as the mean aortic pressure to mean distal flow velocity ratio during maximum hyperaemia.
Statistical analysis
In the absence of a clinical cut-off value or normal range for HMR, a tertile analysis of HMR within the reference arteries was used to distinguish low, intermediate and high HMR in the target vessels. Vessels with an FFR<0.60 were excluded from analyses because of the likely contribution of collateral flow to total myocardial blood flow, which may obscure the assessment of actual microvascular resistance by HMR.11
We first evaluated the association between FFR and the presence of inducible ischaemia at the ischaemic 0.75 cut-off value,12 and the clinical 0.80 cut-off value13 by means of 2×2 contingency tables, in the overall cohort, as well as after stratification by the low, intermediate and high target vessel HMR groups. Receiver-operating-characteristics (ROC) curves were constructed for FFR within the three HMR groups to determine sensitivity and specificity of the 0.75 and 0.80 cut-off values. Second, we evaluated the prevalence of myocardial ischaemia across the HMR groups in the overall cohort, as well as after stratification by positive or negative FFR at both cut-off values. Finally, the impact of HMR on the relationship between FFR and HSR was evaluated, and data were stratified by narrow ranges of HSR to evaluate the relationship between HMR and FFR among epicardial stenoses of comparable physiological severity.
Continuous variables were expressed as mean (±SD), or median (25th—75th percentile), and were compared with t tests or Mann–Whitney U tests, as appropriate. Categorical variables were presented as frequencies (percentage), and were compared with χ2 or Fisher's exact tests, as appropriate. Overall differences across HMR tertiles were compared with one-way analysis of variance (ANOVA), Kruskal–Wallis, or χ2 tests, followed by posthoc t test, Mann–Whitney U or Fisher's exact test, with Bonferroni-adjusted significance level. Correlation coefficients between quantitative variables were calculated using Pearson's r, or partial correlations. A p value below the two-sided α-level of 0.05 was considered statistically significant. The STATA V.13.1 (StataCorp, College Station, Texas, USA) statistical software package was used for all calculations.
Results
Patient population
In 228 patients, 299 coronary stenoses were evaluated. Of these, 210 patients had 255 vessels with FFR≥0.60. The baseline characteristics of these patients are presented in table 1. Within the 255 stenoses, median diameter stenosis was 53% (46–58%), median FFR was 0.82 (0.75–0.89), and median target vessel HMR was 2.1 mm Hg/cm/s (1.6–2.8 mm Hg/cm/s). MPS was positive in 22% of cases (57 out of 255).
Baseline characteristics
A reference coronary artery was evaluated in 178 out of 228 patients. Reference vessel HMR amounted to 1.9 mm Hg/cm/s (1.5–2.5 mm Hg/cm/s) (table 2), significantly lower than target vessel HMR (p=0.044). Moreover, a statistically significant positive correlation between reference and target vessel HMR was found (r=0.247, r2=0.06; p=0.0023; figure 1).
Clinical and angiographic characteristics according to a high, intermediate, or low hyperaemic microvascular resistance

Scatterplot of the relationship between reference vessel and target vessel hyperaemic microvascular resistance. A statististically significant positive correlation was documented (r=0.247, r2=0.06, p=0.0023).
The tertiles of reference vessel HMR were defined by ≤1.6 mm Hg/cm/s, >1.6 and ≤2.3 mm Hg/cm/s, and >2.3 mm Hg/cm/s. These cut-points were used to stratify patients in a low, intermediate and high target vessel HMR group. Baseline clinical characteristics were balanced between HMR groups, although hypercholesterolaemia was more prevalent in the high HMR group (table 2). FFR did not differ between groups (median FFR 0.81 (0.74–0.88), 0.83 (0.76–0.88), and 0.83 (0.76–0.91) for low, intermediate and high target vessel HMR, respectively; overall p=0.76). Also, after substratification by positive and negative FFR at the 0.75 or 0.80 cut-off values, FFR was equivalent across the HMR groups (table 3).
Angiographic and physiological characteristics after stratification by FFR
FFR and myocardial ischaemia in relation to HMR magnitude
Overall, the diagnostic OR of positive versus negative FFR for inducible ischaemia on MPS was 3.8 (95% CI 1.9 to 7.4; p<0.001) at the 0.75 cut-off (table 4: Left panel), and 2.8 (95% CI 1.5 to 5.5; p<0.001) at the 0.80 cut-off value (table 4: Right panel). Sub-stratification by HMR showed that the diagnostic OR for a high versus low FFR was only significant in the presence of high HMR, both at the 0.75 and 0.80 FFR cut-off value. Consequently, the diagnostic accuracy of these FFR cut-off values for inducible myocardial ischaemia on MPS increased with increasing magnitude of HMR (table 5).
Diagnostic OR of FFR at the 0.75 and 0.80 cut-off value for inducible ischemia on myocardial perfusion scintigraphy, stratified by HMR
Fractional flow reserve sensitivity, specificity, and percent correctly classified stenoses according to myocardial perfusion scintigraphy across the low, intermediate and high HMR groups
Relationship between FFR, HMR, HSR and myocardial ischaemia
Notably, despite an equivalent FFR across HMR groups, the prevalence of inducible ischaemia was significantly higher for vessels with high HMR, compared with those with either low or intermediate HMR (figure 2). Substratification by positive or negative FFR showed that a high HMR was associated with an increased prevalence of ischaemia in vessels with a positive FFR only (figure 2). However, although FFR was equivalent across the HMR groups overall as well as among vessels with a positive FFR, a significant increase in HSR across increasing HMR groups was observed. Importantly, this increase in HSR mirrored the increase in HMR and ischaemia prevalence as defined by MPS. This was the case within the overall cohort, as well as after substratification by FFR (table 4). Particularly for stenoses with a positive FFR, HSR increased from predominantly non-ischaemic magnitude in the low and intermediate HMR groups, to dominantly ischaemic magnitude in the high HMR group.

Prevalence of inducible myocardial ischaemia on myocardial perfusion scintigraphy (MPS) according to HMR; for all stenoses (left panel), and after stratification by positive and negative FFR at the 0.75 (middle panel) and 0.80 (right panel) FFR cut-off value. *p≤0.01 compared with low and intermediate HMR groups.
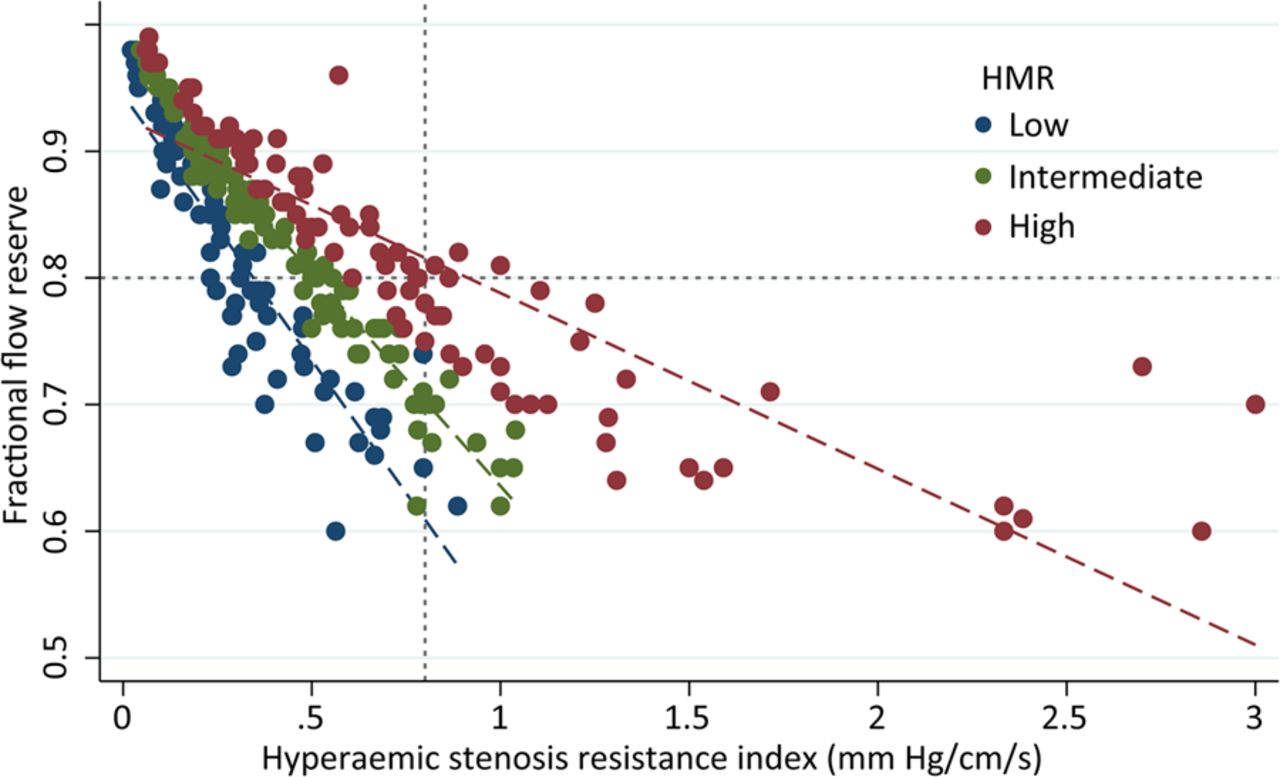
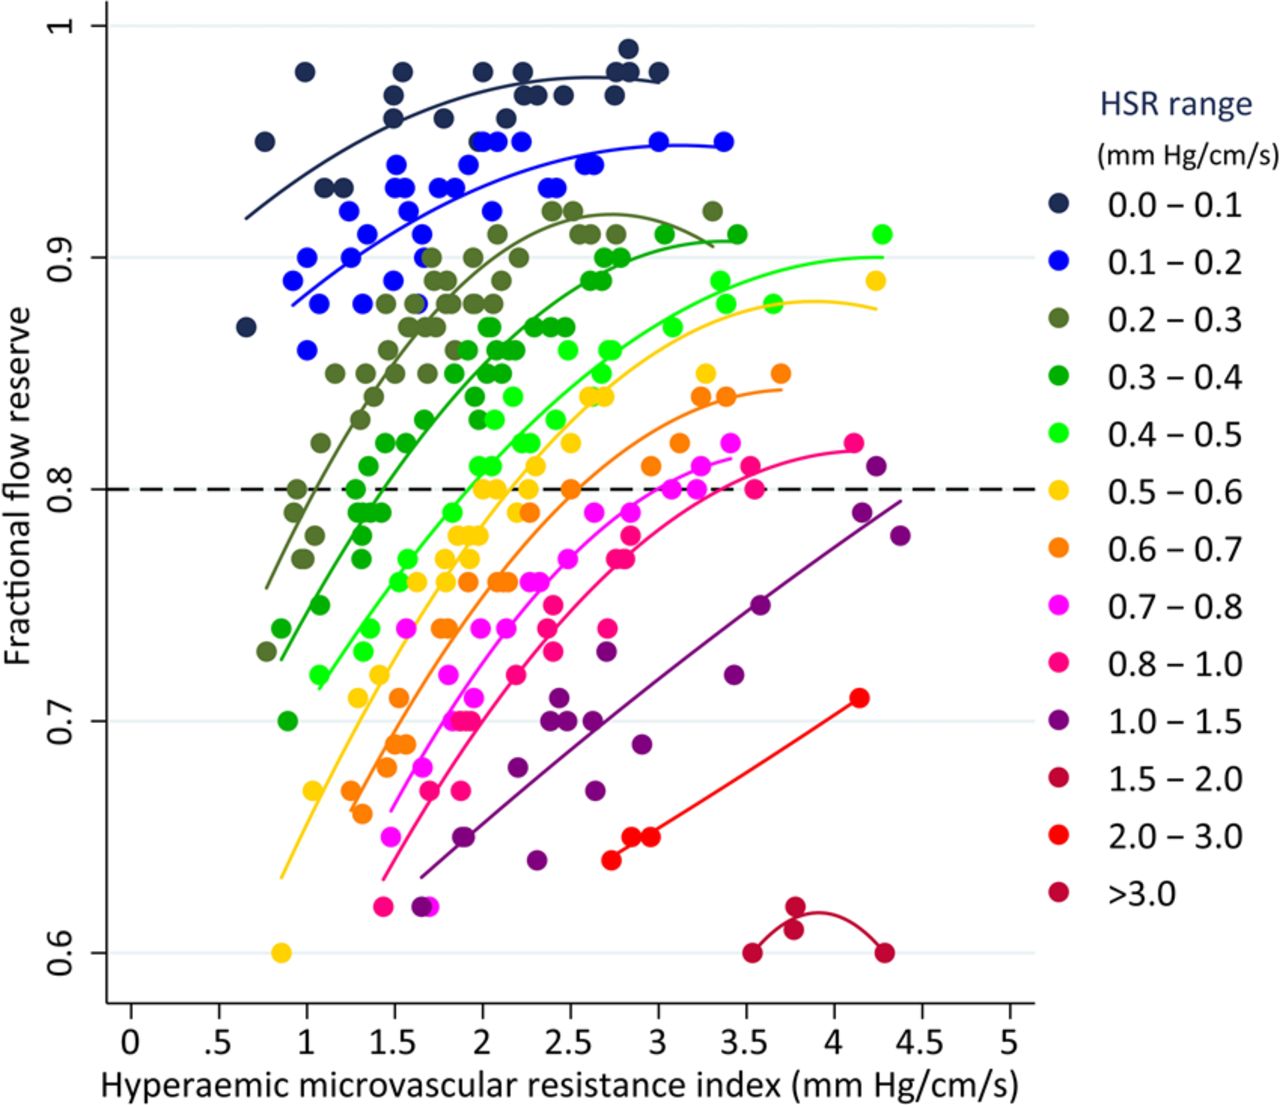
Figure 3 shows how the magnitude of HMR modulates the relationship between FFR and the resistance of the stenosis as assessed by HSR. Please note how for the same FFR, HSR tended to be higher with increasing HMR values, illustrated by the difference in regression slopes across the HMR groups (−1.99 (95% CI −2.21 to −1.78), −2.84 (95% CI −2.97 to −2.71), and -5.39 (95% CI −6.04 to −4.74) for low, intermediate, and high HMR, respectively; overall p<0.001). Figure 4 illustrates the relationship between HMR and FFR, across different ranges of stenosis severity as defined by HSR. For a given stenosis severity, characterised by HSR, FFR increased with increasing HMR. Finally, the correlation between FFR and HSR (r2=0.54, p<0.001) improved substantially after adjustment for HMR (HMR-adjusted partial correlation r2=0.73, p<0.001).

Scatterplot of the relationship between FFR and HSR as defined by the HMR groups. The magnitude of HMR modulates the relationship between FFR and HSR.

Relationship between FFR and HMR for different values of epicardial stenosis severity, expressed by narrow ranges of HSR. For a given epicardial disease severity, FFR tends to increase with increasing HMR.
Discussion
The present study provides essential insights into the role of hyperaemic microvascular resistance in the identification of ischaemia-inducing coronary stenoses by FFR. We observed that the diagnostic accuracy of FFR is substantially higher for vessels with a high HMR, compared with vessels in which HMR is low to intermediate. Notably, distal to coronary stenoses deemed significant by FFR, the prevalence of inducible ischaemia was significantly higher when hyperaemic microvascular resistance was high, even though FFR did not differ between HMR groups. However, despite this equivalent FFR, an increase in HSR mirrored the increase in HMR and myocardial ischaemia across the HMR groups. Among FFR-positive stenoses, inducible ischaemia was determined by a high HSR and HMR, whereas ischaemia was less likely if HSR and HMR were low, despite equivalent FFR between groups. Therefore, our findings suggest that hyperaemic microvascular resistance may obscure the evaluation of epicardial stenosis severity by coronary pressure measurements.
Epicardial and microvascular resistances, FFR and ischaemia: a complex interaction
In vessels with a positive FFR, the prevalence of inducible myocardial ischaemia increased with increasing hyperaemic microvascular resistance, while FFR was equivalent across the HMR groups. At first glance, this observation suggests that the hyperaemic resistance in the coronary microvasculature contributed to the functional consequences of FFR-identified significant epicardial disease. However, an increase in the resistance of the epicardial stenosis paralleled this increase in hyperaemic microvascular resistance and prevalence of inducible ischaemia. This finding suggests an interaction between epicardial and microvascular disease in the development of inducible ischaemia that is not identified from coronary pressure measurements.
It must be borne in mind that FFR as an index is influenced by the magnitude of flow through the stenosis. With increasing coronary flow through a stenosis, distal coronary pressure and, thus, FFR, decreases.14 A low hyperaemic microvascular resistance implies that the impediment to coronary flow is relatively low; which, for a fixed stenosis, may dictate a low FFR value despite the fact that the resistance to flow induced by the stenosis and microvasculature are low at maximal vasodilation. With increasing hyperaemic microvasculature resistance, flow through this fixed stenosis will decrease and FFR will increase, despite no alteration in resistance to flow resulting from the epicardial stenosis. Figures 3 and 4 illustrate these basic physiological concepts, where for a given HSR value, FFR vastly differs across the HMR spectrum. With increasing HMR, FFR tends to increase despite equivalent physiological epicardial disease severity. Moreover, figures 3 and 4 uniquely illustrate that if FFR is positive in the presence of a high HMR, indicating a large pressure drop despite a low-flow setting, the epicardial stenosis is likely very severe, and the subtended myocardial territories are very prone for ischaemia (figure 1).
Increased microvascular resistance: pathology or physiology?
The origin of the increased hyperaemic microvascular resistance in the present study is less easy to elucidate. Although it may be explained by an increase in passive resistance in the microvascular bed due to extensive microvascular disease, it must be borne in mind that microvascular resistance at maximal vasodilation will also increase when the magnitude of epicardial disease increases. Although increasing epicardial disease severity will dictate progressive vasodilation of the coronary resistance vessels under resting conditions when coronary autoregulation is active, the coronary resistance vessels, similar to epicardial coronary arteries,15 are pressure-distensible at maximal vasodilation, when most active coronary tone is abolished. Because resistance increases as a function of the fourth power of the vessel radius, and the latter, in turn, depends on vessel perfusion pressure,16 ,17 a progressive impairment of distal perfusion pressure secondary to progression of epicardial stenosis severity will lead to a progressive increase in microvascular resistance at maximal vasodilation, and thus in an increase in HMR.18
The findings in the present study suggest a multifactorial origin of the noted increase in hyperaemic microvascular resistance. The paired reference and target vessel measurements indicate that part of the increase in hyperaemic microvascular resistance is indeed a global cardiac phenomenon, such as induced by microvascular disease. On the other hand, a contribution of the epicardial stenosis to the resistance of the microvasculature at maximal vasodilation is supported by the fact that target vessel HMR tended to be higher than that in the reference vessel of the same patient, and that the increase in resistance in the target vessel microcirculation at maximal vasodilation was paralleled by an increase in stenosis resistance. Finally, basic physiology suggests that resistance calculated from pressure and flow velocity measurements will depend on the magnitude of perfused myocardial mass as well.19
Implications for clinical practice
Despite a well-documented clinical benefit of FFR-guided coronary revascularisation over angiography-guided revascularisation,13 ,20 recent evidence suggests that FFR also has its limitations in documenting true functional stenosis severity, as supported by the FAME II trial, where more than 70% of FFR-positive stenoses in which revascularisation was deferred did not suffer from major adverse cardiac events (MACE) in the first year of follow-up.20 By contrast with current assumptions, a high FFR in the presence of a high hyperaemic microvascular resistance does not per definition imply sole involvement of the coronary microcirculation, in which FFR may be correct not to identify the epicardial stenosis as a revascularisation target, but may also reflect the obscuring effect of a high hyperaemic microvascular resistance on the coronary pressure-guided identification of severe epicardial disease. Vice versa, a low FFR in the presence of a low hyperaemic microvascular resistance does not, per definition, imply the presence of a flow-limiting coronary stenosis, and may falsely identify a non-flow limiting coronary stenosis as a revascularisation target. Notwithstanding the unequivocal benefit of FFR-guided revascularisation over angiographic guidance across large clinical populations, it is important to recognise that pressure-only assessment of the coronary circulation provides only limited insight into the pathophysiological characteristics of stable coronary artery disease in a particular patient, and may be influenced by the extent of microvascular involvement, which can only be identified by additional assessment of coronary blood flow.
Extensive clinical literature documents the existence of a wide variability of hyperaemic microvascular resistance between patients as well as between (adjacent) perfusion territories.5 ,21 This is important, since it emphasises the need for an index of stenosis severity that is more selective in the assessment of epicardial disease severity to identify appropriate revascularisation targets, with little interference of microvascular resistance. Combined assessment of coronary pressure and flow velocity22 allows the selective evaluation of resistance to myocardial blood flow induced by the stenosis and the microvasculature, as performed in the present study. This selective interrogation may provide diagnostic advantages that allow a more patient-tailored approach to physiologically guided coronary revascularisation.
Limitations
Considering the retrospective nature of the data, this study should be considered hypothesis-generating, and should be interpreted in the light of several limitations. There is no clinical cut-off value or normal range for HMR. Therefore, the tertiles of HMR within non-obstructed reference coronary arteries were used to define low, intermediate and high target vessel HMR groups. Although this approach provides the most reasonable estimation of normal HMR ranges within patients with risk factors for stable coronary artery disease, these results warrant evaluation in an independent study cohort.
The use of MPS as a reference standard may be considered a limitation as to the detection of true myocardial ischaemia. However, a gold standard for ischaemia is not available, and MPS is a well-validated non-invasive reference standard bearing important prognostic value.23–25 It should be noted that invasive and non-invasive tests suffer from different limitations, and therefore, intrinsically provide non-identical assessments of the ischaemic burden of the myocardium. Particularly in the setting of multivessel disease, low-flow ischaemia, or non-flow-limiting epicardial coronary artery disease, this may dictate discordance between invasive and non-invasive test outcomes, implicating that reproducibility of results is affected by the applicable clinical setting.
It is debated whether HMR should be corrected for the contribution of collateral flow to total myocardial blood flow, since its neglect may lead to an overestimation of true microvascular resistance by HMR.11 However, actual collateral flow cannot be measured in clinical practice, and a proposed correction by means of the coronary wedge pressure26 is conceptually hampered since the magnitude of coronary wedge pressure is determined by the effects of venous pressure, heart rate and myocardial wall stress in addition to collateral flow.27 Moreover, collateral flow contribution is known to be negligible in the setting of stable coronary artery disease of intermediate severity, particularly distal to stenoses, with an FFR≥0.60 as applies to the present study.11
Pressure and flow velocity measurements were performed subsequently with separate sensor-equipped guide wires in the present study. Although the wire tip location was verified angiographically between measurements to ensure representative pressure and flow velocity signals, this approach could inherit a bias due to a possible location shift between the measurements. Additionally, assessment of intracoronary flow velocity is sensitive to technical failures, and its accurate measurement depends on operator experience. All measurements in this study were performed by operators with ample experience in intracoronary flow velocity measurements.
Finally, hyperaemia was induced by means of an intracoronary bolus of adenosine in the present study. Although there is an ongoing debate regarding the dose of adenosine needed to induce maximal hyperaemia, the dose used in the present study has been extensively validated for its relationship with non-invasively assessed myocardial ischaemia, and is known to result in FFR values equal to that induced by intravenous administration of adenosine, which was recently discussed in detail.14 Moreover, FFR derived from hyperaemia induced by low-dose intracoronary bolus administration of adenosine has been shown to provide similar clinical benefits of FFR in clinical populations compared with FFR derived from hyperaemia induced by intravenous adenosine administration.28 ,29
Conclusion
Identification of functionally significant coronary stenoses by FFR is obscured by the magnitude of hyperaemic coronary microvascular resistance. Appropriate interpretation of FFR requires information on microvascular status, which illustrates the necessity of combined pressure and flow (velocity) measurements in daily practice.
Key messages
What is already known about this subject?
-
Stenosis assessment by fractional flow reserve aims to identify the epicardial contribution to coronary flow impairment. However, myocardial ischaemia likely originates from a combination of epicardial and microvascular abnormalities, and basic physiology dictates that increased minimal microvascular resistance secondary to microvascular involvement may obscure fractional flow reserve measurements.
What does this study add?
-
Myocardial ischaemia is most prevalent in the setting of a high epicardial resistance to coronary blood flow in combination with high microvascular resistance to coronary blood flow. The measurement of fractional flow reserve is influenced by the magnitude of microvascular resistance during hyperaemia, where for the same epicardial physiological stenosis severity, fractional flow reserve increases with increasing hyperaemic microvascular resistance. This impairs the selective identification of ischaemia-inducing coronary stenoses.
How might this impact on clinical practice?
-
The additional assessment of coronary flow (velocity) may enrich the interpretation of coronary pressure measurements, and fractional flow reserve. Our observations suggest that the selective evaluation of epicardial and microvascular resistance to coronary blood flow may allow most accurate identification of stenoses related to myocardial ischaemia, and identification of appropriate revascularisation targets.
Acknowledgments
The authors acknowledge the nursing staff of the cardiac catheterisation laboratory (Head: MGH Meesterman) for their skilled assistance in data acquisition.
References
Footnotes
TPvdH and FN contributed equally to this study.
-
Contributors All authors made substantial contributions to the conception of the work, the acquisition, analysis, or interpretation of data for the work, drafting the work or revising it critically for important intellectual content. Moreover, all authors have approved the final version of the manuscript, and agree to be accountable for all aspects of the work.
-
Funding This study was funded in part by the European Community's Seventh Framework Programme (FP7/2007–2013) under grant agreement no. 224495 (euHeart project) and by grants from the Dutch Heart Foundation (2006B186, 2000.090, and D96.020)).
-
Competing interests None.
-
Patient consent Obtained.
-
Ethics approval Medical Ethical Committee, Academic Medical Center, Amsterdam, The Netherlands.
-
Provenance and peer review Not commissioned; externally peer reviewed.