Article Text

Abstract
Aims In aortic stenosis (AS), there is poor association between symptoms and conventional markers of AS severity or left ventricular (LV) systolic function. This may reflect that symptoms arise from LV diastolic dysfunction or that aortic valve area (AVA) and transvalvular gradient do not reflect afterload. We aimed to study the impact of afterload (end-systolic wall stress [ESWS]) on the presence of symptoms in AS and to test whether symptoms are related to increased ESWS or LV remodelling.
Methods and results In a prospective study, ESWS was estimated by measuring LV wall thickness from MRI and estimated LV end systolic pressure from echocardiographic mean gradient and systolic blood pressure in 78 patients with severe AS scheduled for aortic valve replacement and 91 patients with asymptomatic severe AS. Symptomatic patients had lower indexed AVA (0.40±0.11 vs 0.45±0.09 cm2/m2, p=0.009). They had undergone more extensive remodelling (MRI LV mass index [LVMi]: 85±24 vs 69±17 g/m2, p<0.0001), had higher tricuspid regurgitant gradient (24±8 mm Hg vs 19 ± 7 mm Hg, p=0.0001) and poorer global longitudinal strain (−15.6±3.8 vs −19.9±3.2%, p<0.0001). ESWS was higher among symptomatic patients (96±51 vs 76±25 kdynes/cm2, p=0.003). Multivariate logistic regression identified echocardiographic relative wall thickness, tricuspid gradient, mitral deceleration time, early diastolic strain rate, MRI LVMi, MRI LV end-diastolic volume index and ESWS as independently associated with being symptomatic.
Conclusion ESWS can be estimated from multimodality imaging combining MRI and echocardiography. It is correlated with LV remodelling and neurohormonal activation and is independently associated with symptomatic status in AS.
- valvular heart disease
- magnetic resonance imaging
- echocardiography
This is an open access article distributed in accordance with the Creative Commons Attribution Non Commercial (CC BY-NC 4.0) license, which permits others to distribute, remix, adapt, build upon this work non-commercially, and license their derivative works on different terms, provided the original work is properly cited, appropriate credit is given, any changes made indicated, and the use is non-commercial. See: http://creativecommons.org/licenses/by-nc/4.0/.
Statistics from Altmetric.com
Key questions
What is already known about this subject?
In severe aortic stenosis (AS), ejection fraction (EF) may decrease due to afterload mismatch caused by elevated end-systolic wall stress (ESWS).
What does this study add?
This study explores a new non-invasive multimodality method of measuring ESWS, combining echocardiographic and MRI images. ESWS and ESWS-corrected EF as a marker of contractility are closely correlated to symptom status in severe AS.
How might this impact on clinical practice?
Further studies should explore the prognostic impact of elevated ESWS and reduced ESWS-corrected EF in AS.
Introduction
In aortic stenosis (AS), chronic pressure overload may lead to impaired left ventricular (LV) function and the development of heart failure symptoms. Although the transition from asymptomatic to symptomatic AS is related to LV function and markers of AS severity such as transvalvular gradients and valve area, this association is poor and the mechanism that lead to symptoms is still incompletely understood.
For decades, AS severity has been graded using transvalvular gradients, as they reflect LV intracavitary pressures that is a major determinant of LV wall-stress and may cause LV dysfunction. However, according to Laplace’s law, increasing LV pressures may be counteracted by changes in LV geometry and an increase in LV wall thickness that may maintain end-systolic wall stress (ESWS) relatively normal. In addition contractility is increased to preserve cardiac output. However, these corrective mechanisms may occur at the expense of increased myocardial oxygen consumption, altered LV function and increase filling pressures.1 The haemodynamic burden of AS is thus dependent on AS severity per se and on LV chamber properties and best described by ESWS. In patients with severe AS with preserved LV function, there is an inverse linear association between ESWS and LV ejection fraction (LVEF),2 emphasising the importance of correcting LVEF for ESWS as reduced LVEF may occur in patients with preserved LV contractility as a consequence of afterload-mismatch. Despite these considerations, the impact of ESWS and ESWS corrected LVEF on the presence of symptoms in AS has not been studied, likely because the calculation of ESWS in addition to LV end-systolic pressure requires the ratio of LV end-systolic chamber diameter and thickness that may be difficult to assess with high accuracy by echocardiography.
MRI offers superior spatial resolution to echocardiography and systolic LV measures. Thus, ESWS could in theory be calculated by integrating LV end-systolic pressures assessed by echocardiography with MRI derived LV end-systolic thickness and diameters. The purpose of this paper was thus to study the impact of ESWS and ESWS corrected LVEF on symptom status in patients with severe AS.
Methods
This study combines data from two separate prospectively gathered cohorts at our institution. Asymptomatic patients with aorticvalve area (AVA)<1 cm2, maximal aortic peak velocity >3.5 m/s and LVEF >50% were recruited at the outpatient clinic. To evaluate if they were truly asymptomatic, these patients underwent a conventional cycle ergometer test with a normal haemodynamic response (work load ≥85% of predicted for age and gender with no decrease in blood pressure during exertion). Symptomatic patients with severe AS (AVA<1 cm2) were recruited after heart team discussion and referral for aortic valve replacement (AVR) at our institution. Patients with chronic kidney disease (estimated glomerular filtration rate<40 mL/min/1.73 m2), persistent atrial fibrillation or flutter, pacemaker, predominant aortic regurgitation or more than mild mitral regurgitation/stenosis were excluded. The study was approved by the Danish Data Protection Agency and the Regional Scientific Ethical Committees for Southern Denmark (S-20130063 and S-20130064) and was registered with ClinicalTrials.gov (NCT02395107 and NCT02316587). All patients gave written informed consent.
All patients underwent a clinical examination programme and answered a Duke Activity Status Index questionnaire.3 Blood pressure was measured twice in both arms after at least 15 min of rest, the first measurement from each arm was discarded and the highest remaining measurement was stored. We defined pre-existing ischaemic heart disease as a history of coronary angioplasty or myocardial infarction.
Echocardiography
Echocardiograms were performed on a GE medical Vivid 9 ultrasound machine (GE Medical System, Horten, Norway). Images were analysed offline on EchoPAC PC 08 (GE Medical system, Horten, Norway).
LV outflow tract diameter was measured in the parasternal long-axis view in early systole 5 mm from the aortic annulus. AVA was estimated using the continuity equation and indexed by body surface area (AVAi). Peak and mean flow velocities across the valve were determined in the window where the highest velocity could be recorded using continuous wave Doppler with the cursor aligned as parallel as possible with the flow across the valve. Peak and mean transvalvular gradients were estimated using the modified Bernoulli equation. Valvulo-arterial impedance (ZVA) was calculated as previously described.4
LV dimensions, relative wall thickness and LV geometry were estimated according to recommendations.5 2D deformation was assessed with speckle tracking measuring global longitudinal strain as the maximal systolic deformation. Early diastolic strain rate was defined as the maximal diastolic deformation velocity during early diastole. Doppler tissue imaging was used to assess early diastolic mitral annular motion, as the average of septal and lateral valve annulus (e’).5 E/e’ and E/early diastolic strain rate were calculated.6 7 Diastolic function was determined according to 2016 EACVI/ASA guidelines.8
Cardiac magnetic resonance imaging
MRI was performed prior to AVR on a Phillips Ingenia 1.5 T scanner with Omega HP gradient system (Philips Electronics, Koninklijke, Netherlands). Sequential short axis cine slices (20–24 slices) were performed during multiple breath hold sequences acquiring slices of 8 mm thickness. Images were analysed blinded for other data on Extended Philips WorkSpace software package (2.6.3.5 2013). Analyses were performed after the end of the study period, and the decision to perform surgery was therefore not influenced by MRI results.
In short axis and with minimal and maximal volumes, endocardial and epicardial borders were manually traced and LV mass index (LVMi) calculated as previously described.9 In assessment of left atrial (LA) volume, the LA appendage was excluded. Phase velocity flow mapping of flow in the sinotubular junction of the ascending aorta was used to assess forward and backward flow. Stroke volume index (SVi) was calculated with the phase contrast method as the difference between the forward and backward flow divided by body surface area (SViPC) and with the volumetric method as the difference between the maximal and minimal LV volume divided by body surface area (SViVol).
Aortic cross-sectional diameter was measured in two orthogonal planes at the sinotubular junction and aortic cross-sectional area was calculated as [radius1 × radius2 × π]. Together with echocardiographic measurements of AVA, energy loss index was calculated to account for pressure recovery as previously suggested.10 In short-axis and end-systole, LV internal diameter was measured in two orthogonal planes and LV wall thickness was measured four different places in the most basal slice of the LV (figure 1), and average LV end-systolic diameter and wall thickness were calculated.
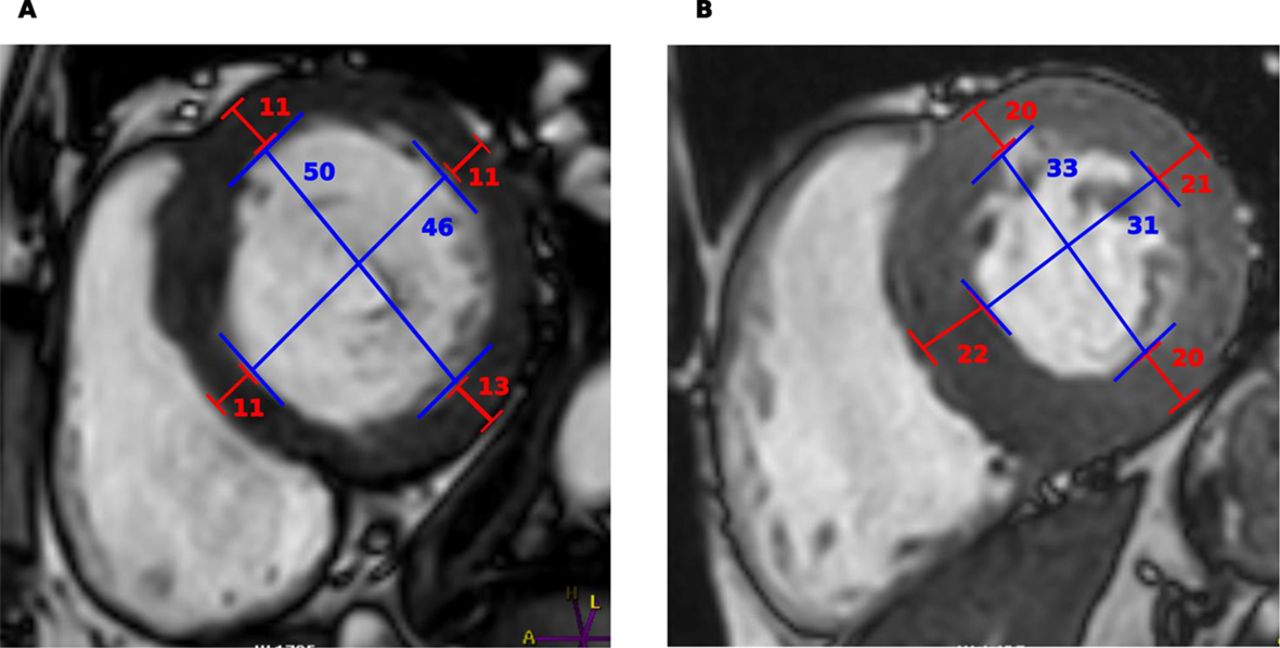
Wall stress measurements. Wall stress measurements in two patients: (A) patient with symptomatic AS, systolic blood pressure 126 mm Hg, mean gradient 87 mm Hg, wall stress 239 kdynes/cm2; (B) patient with asymptomatic AS, systolic blood pressure 128 mm Hg, mean gradient 73 mm Hg, wall stress 47 kdynes/cm2. AS, aortic stenosis.
Late gadolinium enhancement (LGE) images were obtained 10 min after bolus injection of 0.1 mmol/kg gadoterate meglumine (Dotarem, Guerbet, Aulnay-Bois, France). The inversion time was adjusted from visual inspection of a Look-Locker image to null the myocardium. LGE patterns were reported as ischaemic (subendocardial or transmural patter) or midwall. Patients with both patterns were classified as ischaemic fibrosis.
Calculation of wall stress
Using MRI LV end-systolic diameter and wall thickness, echocardiographic mean and arterial blood pressure, ESWS was calculated according to previous recommendations11

LV contractility was estimated as the ratio of LVEF/ESWS.2
Statistics
Data are presented as mean±SD, median and (IQR) or number (percentages) as appropriate. Normality was tested visually by qq-plots and histograms. Differences between groups were tested by Student’s t-test; non-parametric variables were log-transformed and if this approximated normality they were tested by Student’s t-test, otherwise they were tested by Wilcoxon signed-rank test; categorical variables were tested by the χ² test. A univariate and multivariate logistic regression to identify variables associated with symptomatic AS was performed, with age, gender and AVAi forced into the multivariate model. In addition to ORs, adjusted ORs for 1 SD were calculated (ORADJ), dividing the variable by the SD of the measure. Receiver operating characteristics were performed to assess the prognostic value of clinically relevant covariates on symptomatic status. Comparison of the predictive value of different covariates was performed by comparing area under the curve (AUC) with a Wald test. P<0.05 was considered significant. STATA/IC 14.1 (Stata, Texas, USA).
Results
A total of 172 patients were recruited, 91 (54%) with asymptomatic AS and 78 (46%) with symptomatic AS scheduled for AVR (table 1). Of the symptomatic patients, 23 (29%) underwent concomitant coronary artery bypass graft surgery. Seventy-six patients had AVR performed due to a combination of dyspnoea and/or angina, one patient was operated due to syncope and one patient due to abnormal haemodynamic response to cycle ergometer test.
Baseline demographics
Symptomatic versus asymptomatic patients
Symptomatic patients scored significantly lower on the Duke Activity Status index questionnaire and had a higher prevalence of ischaemic heart disease (19 vs 3%, p=0.001) but otherwise there were no significant differences between groups (table 1).
On echocardiography, symptomatic patients had more severe AS, in terms of smaller AVAi, lower energy loss index and higher ZVA (table 2). They had undergone more advanced LV remodelling, measured by a higher prevalence of concentric hypertrophy and higher relative wall thickness (0.67±0.15 vs 0.55±0.10, p<0.0001). Further, they had evidence of poorer diastolic function with shorter mitral valve deceleration time (237±64 vs 273±73 ms, p<0.0001), higher tricuspid regurgitant gradient (24±8 vs 19±7, p=0.0001) and a higher E/early diastolic strain rate ratio (1.0±0.4 vs 0.7±0.2, p<0.0001). Systolic mitral annular velocity (s’) was lower and global longitudinal strain poorer (−15.6±3.8 vs -19.9±3.2, p<0.0001) in the symptomatic group.
Echocardiogram, MRI and biomarkers according to symptoms
On MRI, LVEF was lower in symptomatic patients. Symptomatic patients also had significantly higher LVMi (85±24 vs 69±17 g/m2, p<0.0001) and lower LA emptying fraction, while LA volume index was similar (table 2). SVi was lower in the symptomatic group and there was a higher prevalence of LGE fibrosis (42 vs 27 %, p=0.046), especially with an ischaemic pattern (22 vs 4 %, p=0.001).
End-systolic wall stress and contractility
ESWS was higher in the symptomatic group (96±51 vs 76±25 kdynes/cm3, p=0.003), especially among symptomatic patients with NYHA≥3 (figure 2). It correlated positively with markers of LV remodelling, measured as LV end-diastolic (r2=0.30, p<0.0001) and end-systolic volume index (r2=0.53, p<0.0001) and with LVMi (r2=0.12, p<0.0001) (figure 3). Further, it correlated with LV systolic function measured as global longitudinal strain (r2=0.26, p<0.0001) and with LVEF (r2=0.47, p<0.0001). Also, it was associated with LA volume index (r2=0.09, p=0.0001), LA emptying fraction (r2=0.14, p<0.0001) and tricuspid regurgitant velocity (r2=0.06 p=0.002). There was a positive correlation between end-systolic stress and logBNP (r2=0.17, p<0.0001) (figure 3).
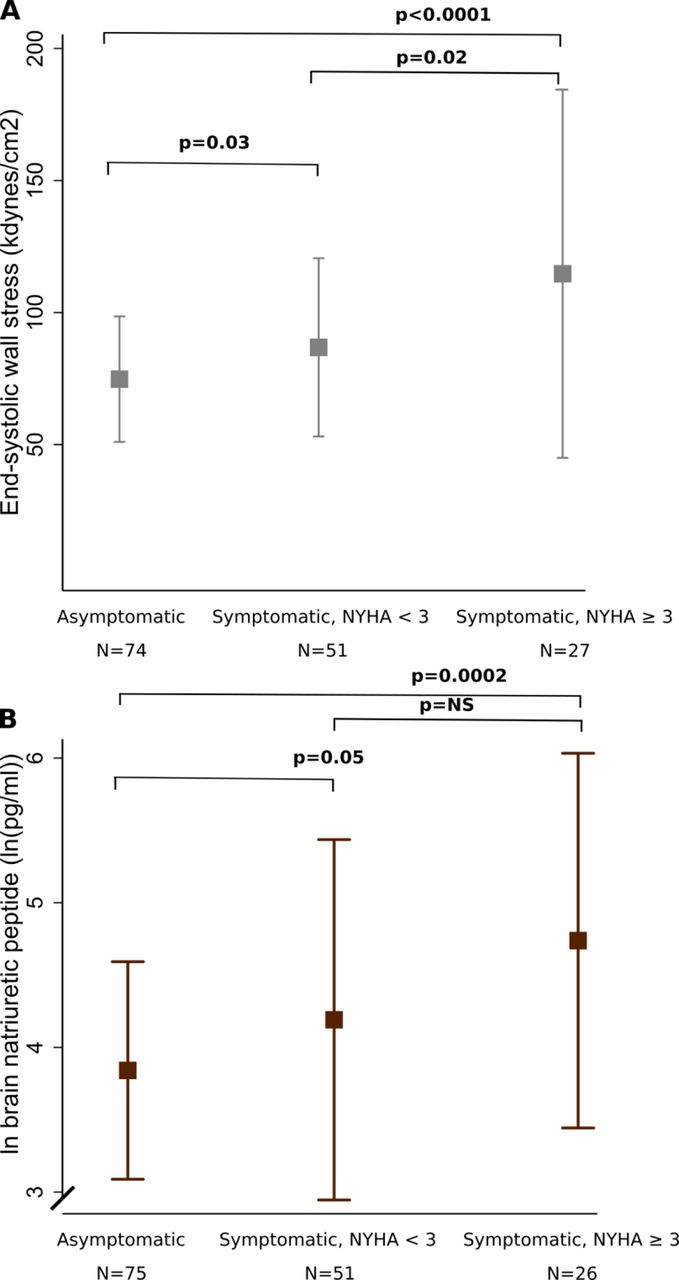
(A) Wall stress according to symptoms, (B) BNP according to symptoms. Some symptomatic patients had NYHA class 1, because their symptoms were either angina, syncope or abnormal exercise test. Only 90 asymptomatic patients had sufficient MRI images to assess wall stress, and BNP could only be measured in 89 asymptomatic and 77 symptomatic patients. BNP, brain natriuretic peptide.
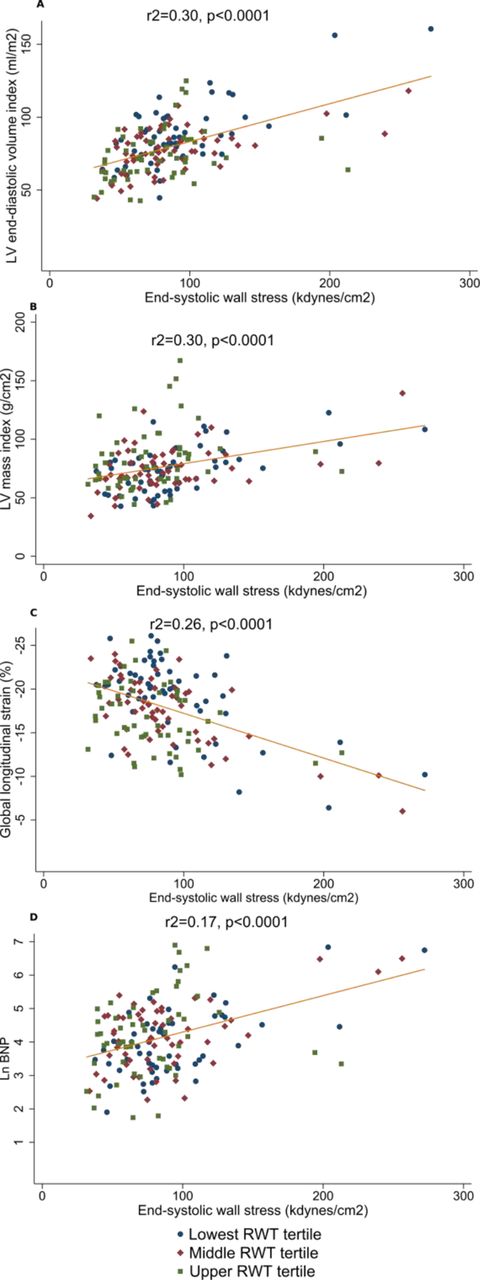
Correlation between end-systolic wall stress and markers of remodelling according to relative wall thickness. BNP, brain natriuretic peptide; LV, left ventricle.
ESWS was higher among patients with ischaemic fibrosis on MRI (112±63 vs 82±37 kdynes/cm2, p=0.004) but not among patients with midwall fibrosis on MRI.
Estimated contractility was lowest among patients with symptomatic AS (0.68 [0.52–0.96] vs 0.84 [0.73–1.12] %/kdynes/cm3, p=0.003), especially among patients with NYHA≥3 (0.62 [0.30–1.16] vs 0.73 [0.54–0.96] %/kdynes/cm3, p=0.04).
Parameters associated with symptomatic AS
Univariate markers associated with symptomatic AS are summarised in table 3. In stepwise multivariable analysis relative wall thickness, tricuspid regurgitant gradient, mitral deceleration time, early diastolic strain rate, LVMi, LV end-diastolic volume index and ESWS remained independently associated with symptomatic AS (table 3). In contrast, neither LA volume nor brain natriuretic peptide (BNP) provided additional information. We tested our models in the subset of patients without coronary artery disease with consistent findings.
Parameters associated with symptoms in AS
Receiver operating characteristic curves for the prediction of symptomatic AS are shown in figure 4. Echocardiographic variables (relative wall thickness, mitral valve deceleration time, tricuspid gradient and global longitudinal strain) had incremental value to age, gender and AVAi alone (AUC: 0.92 vs 0.62, p<0.0001). Adding MRI variables (LVMi and LV end-diastolic volume index and ESWS) was superior for the prediction of symptomatic AS (AUC: 0.95 vs 0.92, p=0.01).

Receiver operating characteristic to predict symptoms. Model 1: end-systolic wall stress. Model 2: age, gender and aortic valve area index. Model 3: Model 1+additional echocardiographic variables (relative wall thickness, mitral valve deceleration time, tricuspid regurgitation and global longitudinal strain). Model 4: Model 2+MRI variables (LV end-diastolic volume index and LV mass index) and end-systolic wall stress. AUC, area under the curve; LV, left ventricle.
Discussion
In this study including prospectively enrolled patients with severe AS who underwent comprehensive cardiac evaluation, we demonstrate that (1) ESWS estimated by MRI and echocardiography is associated with markers of LV function and structure and is increased in symptomatic AS independent of other markers of AS severity; (2) despite preserved LVEF, the association of LV function and symptoms is not only load-dependent suggesting that a reduction in LV contractility contribute to development of symptoms and (3) the presence of symptoms is further associated with more extensive LV remodelling, diastolic dysfunction.
The hallmark of AS is the development of transvalvular gradients that leads to increased LV systolic pressure which uncorrected will lead to increased ESWS and a reduction in stroke volume. AS associated LV remodelling characterised by LV hypertrophy and concentric LV geometry has for decades been regarded as a physiological adaptation that counteracts the increasing LV pressure and keep ESWS relatively normal.12 Further to maintain normal stroke volume with increased afterload contractility needs to increase and consequently myocardial oxygen consumption will increase. The preservation of ESWS in the normal range has been considered important as ESWS has been demonstrated to be the most important determinant of LV oxygen consumption in pressure overload,13 and particularly elevated ESWS increases the risk of myocardial ischaemia, especially in the basal and subendocardial layers where wall stress is highest.14 It is thus interesting that we demonstrate that ESWS is higher among patients with ischaemic replacement fibrosis detected by MRI. Although ischaemic myocardial damage and not wall stress per se is the cause of ischaemic fibrosis, the consequence of ischaemic fibrosis is an area of the LV with reduced contractility and reduced ability to increase wall thickness to counterbalance the elevated end-systolic pressure. Postmyocardial infarction remodelling is characterised by a compensatory hypertrophy in the remote non-infarcted myocardium to account for loss of contractile myocardium,15 and these patients will subsequently have inappropriately high wall stress. This will likely worsen symptoms by further reducing LVEF and causing diffuse myocardial fibrosis which has also been reported to be present after myocardial infarction in myocardium remote from the infarct zone.16 Our findings corroborate the findings of Weidemann and colleagues, who showed that ESWS was highest among patients with AS with more advanced myocardial fibrosis.17
It thus seems that the preservation of ESWS in the normal range is crucial to avoid ischaemia leading to LV dysfunction, increased LV filling pressures and the development of symptoms. The association between ESWS and LV filling pressures was studied two decades ago by Ikeda and colleagues who in 13 patients with severe AS showed an excellent correlation between ESWS and BNP.18 Similarly, we demonstrate a significant association between ESWS and BNP and extend these findings as we demonstrate an association between ESWS and non-invasive echocardiographic markers of LV filling pressures. However, in our study, we only demonstrated a modest correlation between ESWS and BNP, implying that the associated mechanism is complex.
The precise pathophysiological mechanism behind the development of symptoms in AS has been a matter of controversy: Where some have proposed that the development of symptoms is associated with LV functional and structural parameters,19 20 others have proposed increased afterload being most important.2 However, association between symptoms and markers of AS severity is poor, probably reflecting that transvalvular gradients and AVAs are not measures of the haemodynamic burden imposed on the LV. Indeed, we demonstrate that ESWS is associated with symptoms and is superior to other markers of AS severity in identifying symptomatic AS. Furthermore, we demonstrate that symptomatic patients present with more pronounced LV remodelling and reduced LV compliance compared with asymptomatic patients. These findings corroborate our previous findings20 and demonstrate that the preservation of ESWS in the normal range occurs at the expense of LV diastolic dysfunction that may lead to increased LV filling pressures. In the present study, a subgroup of patients characterised by excessive remodelling with severely increased wall thickness which led to only mildly elevated ESWS was identified. These patients were all symptomatic, were characterised by a high BNP as well and had a relative wall thickness in the highest tertile. Thus, these patients mimic what has been described as ‘inappropriately high LV mass’, characterised by a mismatch been wall stress and LV hypertrophic response.21 This might reflect other coexistent LV pathologies such as occult cardiac amyloidosis, which is not infrequently seen in patients undergoing AVR.22
Finally, we demonstrate that compared with those without symptoms, symptomatic patients present with reduced LV systolic function measured as LVEF and global longitudinal strain. Although this could be interpreted as reduced LV contractility being the cause of symptoms, both LVEF and global longitudinal strain are affected by increasing afterload.2 23 Differences in LVEF and strain could thus equally reflect afterload mismatch rather than true reduction in contractility in symptomatic AS. It is thus an important finding that symptomatic patients show reduced contractility measured as the ratio between LVEF and ESWS as this indicates that the development of symptoms is associated with a reduction in contractility rather than by excess in afterload as previously suggested.2 As contractility reflects intrinsic myocardial function and is not load-dependent, our findings suggest that waiting for development of symptoms occurs at the price of an irreversible reduction in LV function. This finding would support a less withholding strategy regarding referral to AVR, to avoid the development of reduced contractility associated with symptoms although this ultimately should be addressed in a randomised trial.
Limitations
We evaluated myocardial fibrosis with LGE, which only assesses replacement fibrosis and not diffuse fibrosis. We can only speculate how diffuse fibrosis measured by T1 mapping might have correlated with symptoms and ESWS. We also did not have any method of quantification of replacement fibrosis amount available, which would have been preferable.
A proportion of symptomatic patients underwent concomitant coronary artery bypass graft surgery along with their AVR which might have contributed to symptoms. However, we only included patients when we assessed that AVR was the main indication for surgery.
Conclusion
ESWS in AS can be measured using multimodality imaging by combining MRI and echocardiographic images where it proves to be associated with severity of remodelling, neurohormonal activation and severity of symptoms in severe AS. Future studies should address the prognostic and clinical significance of assessing ESWS and ESWS corrected LVEF in AS.
References
Footnotes
Contributors RC-S: conception of idea, data collection, data analysis, first manuscript draft. JEM: conception of idea, major contributions to manuscript, help with analyses. NLC: data collection, data analysis, revisions to manuscript. LMR: biomarker specialist, revisions to manuscript. RP: MRI specialist, data analysis, revisions to manuscript. ES: MRI specialist, data analysis, revisions to manuscript. LMV: manuscript revisions. JSD: conception of idea, data analysis, major contributions to manuscript, responsible for final draft.
Funding Danish Heart Association, the Region of Southern Denmark, Heede Nielsen foundation, Overlaegeraadets foundation, Free Research funds Odense University Hospital, Hartmann foundation, Aase and Ejnar Danielsens foundation and OPEN Region of Southern Denmark.
Competing interests None declared.
Patient consent for publication Not required.
Provenance and peer review Not commissioned; externally peer reviewed.
Data sharing statement Data are available on reasonable request.