Article Text

Abstract
Introduction The Intermountain Risk Score (IMRS) was developed and validated to predict short-term and long-term mortality in hospitalised patients using demographics and commonly available laboratory data. In this study, we sought to determine whether the IMRS also predicts all-cause mortality in patients hospitalised with heart failure with preserved ejection fraction (HFpEF) and whether it is complementary to the Get with the Guidelines Heart Failure (GWTG-HF) risk score or N-terminal pro-B-type natriuretic peptide (NT-proBNP).
Methods and results We used the Stanford Translational Research Integrated Database Environment to identify 3847 adult patients with a diagnosis of HFpEF between January 1998 and December 2016. Of these, 580 were hospitalised with a primary diagnosis of acute HFpEF. Mean age was 76±16 years, the majority being female (58%), with a high prevalence of diabetes mellitus (36%) and a history of coronary artery disease (60%). Over a median follow-up of 2.0 years, 140 (24%) patients died. On multivariable analysis, the IMRS and GWTG-HF risk score were independently associated with all-cause mortality (standardised HRs IMRS (1.55 (95% CI 1.27 to 1.93)); GWTG-HF (1.60 (95% CI 1.27 to 2.01))). Combining the two scores, improved the net reclassification over GWTG-HF alone by 36.2%. In patients with available NT-proBNP (n=341), NT-proBNP improved the net reclassification of each score by 46.2% (IMRS) and 36.3% (GWTG-HF).
Conclusion IMRS and GWTG-HF risk scores, along with NT-proBNP, play a complementary role in predicting outcome in patients hospitalised with HFpEF.
- heart failure with normal ejection fraction
- quality of care and outcomes
- heart failure
- heart failure preserved ejection fraction
This is an Open Access article distributed in accordance with the Creative Commons Attribution Non Commercial (CC BY-NC 4.0) license, which permits others to distribute, remix, adapt, build upon this work non-commercially, and license their derivative works on different terms, provided the original work is properly cited, appropriate credit is given, any changes made indicated, and the use is non-commercial. See: http://creativecommons.org/licenses/by-nc/4.0/.
Statistics from Altmetric.com
- heart failure with normal ejection fraction
- quality of care and outcomes
- heart failure
- heart failure preserved ejection fraction
Key questions
What is already known about this subject?
Heart failure with preserved ejection fraction (HFpEF) is a major burden on our healthcare system associated with significant morbidity and mortality. Several risk scores using routinely available markers have been developed for risk stratification in HFpEF. The Intermountain Risk Score (IMRS) was developed to predict 30-day, 1-year and 5-year mortality using age-adjusted and sex-adjusted weights, based on commonly available laboratory data such as complete blood count including red cell distribution width (RDW) and basic metabolic profile. The Get With The Guidelines-Heart Failure (GWTG-HF) risk score was derived and validated in accordance with the American Heart Association’s GWTG-HF module to predict in-hospital mortality in patients hospitalised with heart failure (HF) with reduced or preserved ejection fraction. N-terminal pro B-type natriuretic peptide (NT-proBNP) is a useful prognostic biomarker in patients with HFpEF.
What does this study add?
This study adds evidence that people with intermediate risk by the GWTG-HF risk score can be reclassified to a higher risk level using risk information from IMRS. Thus, combining two scores can aid better risk stratification of patients with HFpEF. For this to have an impact on clinical management, we have to implement a different strategy. At this time, since there is no specific therapeutics for high-risk patients, the practical implication would be a closer monitoring and management of early stage decompensation.
Key questions
How might this impact on clinical practice?
Several centres are using clinical risk scores to guide pathways of care following discharge. Established risk scores including the GWTG-HF risk score and the IMRS play a complementary role in predicting outcomes in patients hospitalised with HFpEF. Using these two risk scores can therefore ensure better risk stratification in patients with HFpEF. This will allow closer monitoring and follow-up of higher risk patients and may therefore be useful in planning post discharge care. In addition, combining two validated risk scores, can prove to be valuable in designing prospective studies. Our study also identifies the direction to develop novel risk scores that incorporate NT-proBNP and other commonly available biomarkers such as RDW that could further improve and simplify pathway of care in heart failure management.
Introduction
Heart failure with preserved ejection fraction (HFpEF) represents the most common cause of heart failure (HF) hospitalisation in the ageing population.1–4 HFpEF is associated with multimorbidity including coronary artery disease (CAD), systemic hypertension, diabetes mellitus (DM) and atrial fibrillation (Afib).5–7 The mortality varies between series with mortality rates reported between 20% and 30% at 5 years.8–10 Identifying predictors of outcome in hospitalised patients with HF led to the development of several clinical risk scores.11–15 The Intermountain Risk Score (IMRS) was developed to predict 30-day, 1-year and 5-year mortality using age-adjusted and sex-adjusted weights based on commonly available laboratory data such as complete blood count (CBC) including red cell distribution width (RDW) and basic metabolic profile (BMP).16 The IMRS was developed in a hospitalised population with a smaller proportion of patients having a diagnosis of HF.16 It was later validated to predict mortality in the general population,16 cardiac catheterisation patients16 and lower risk individuals free of cardiovascular disease17 and to predict HF incidence in cardiac patients initially free of HF.12 17 The Get With The Guidelines-Heart Failure (GWTG-HF) risk score was derived and validated in accordance with the American Heart Association’s GWTG-HF module to predict in-hospital mortality in patients hospitalised with HF with reduced or preserved ejection fraction.11 18–20 Among biomarkers, B-type natriuretic peptide has been shown to be complementary to GWTG-HF score in predicting in-hospital mortality; it has also been shown to predict long-term outcome in patients with HF.21 22
Although both the IMRS and GWTG-HF risk score are built on routinely available clinical and laboratory parameters (online supplemental table 1), several parameters considered are specific to a particular score. For example, compared with the GWTG-HF risk score, the IMRS considers comprehensive CBC markers including RDW, haemoglobin concentration and white cell count (WCC). Similarly, GWTG-HF risk score considers more cardiac specific parameters such as heart rate and blood pressure as well as race, which was not considered in the IMRS due to the low prevalence of African-Americans in the derivation cohort. For this study, we hypothesised that the IMRS would predict all-cause mortality specifically in patients hospitalised with HFpEF; in addition, we further hypothesised that it would be complementary to the GWTG-HF risk score or N-terminal pro B-type natriuretic peptide (NT-proBNP). We also sought to better delineate the relationship between variables using correlation network analysis.
Supplemental material
Methods
Study population
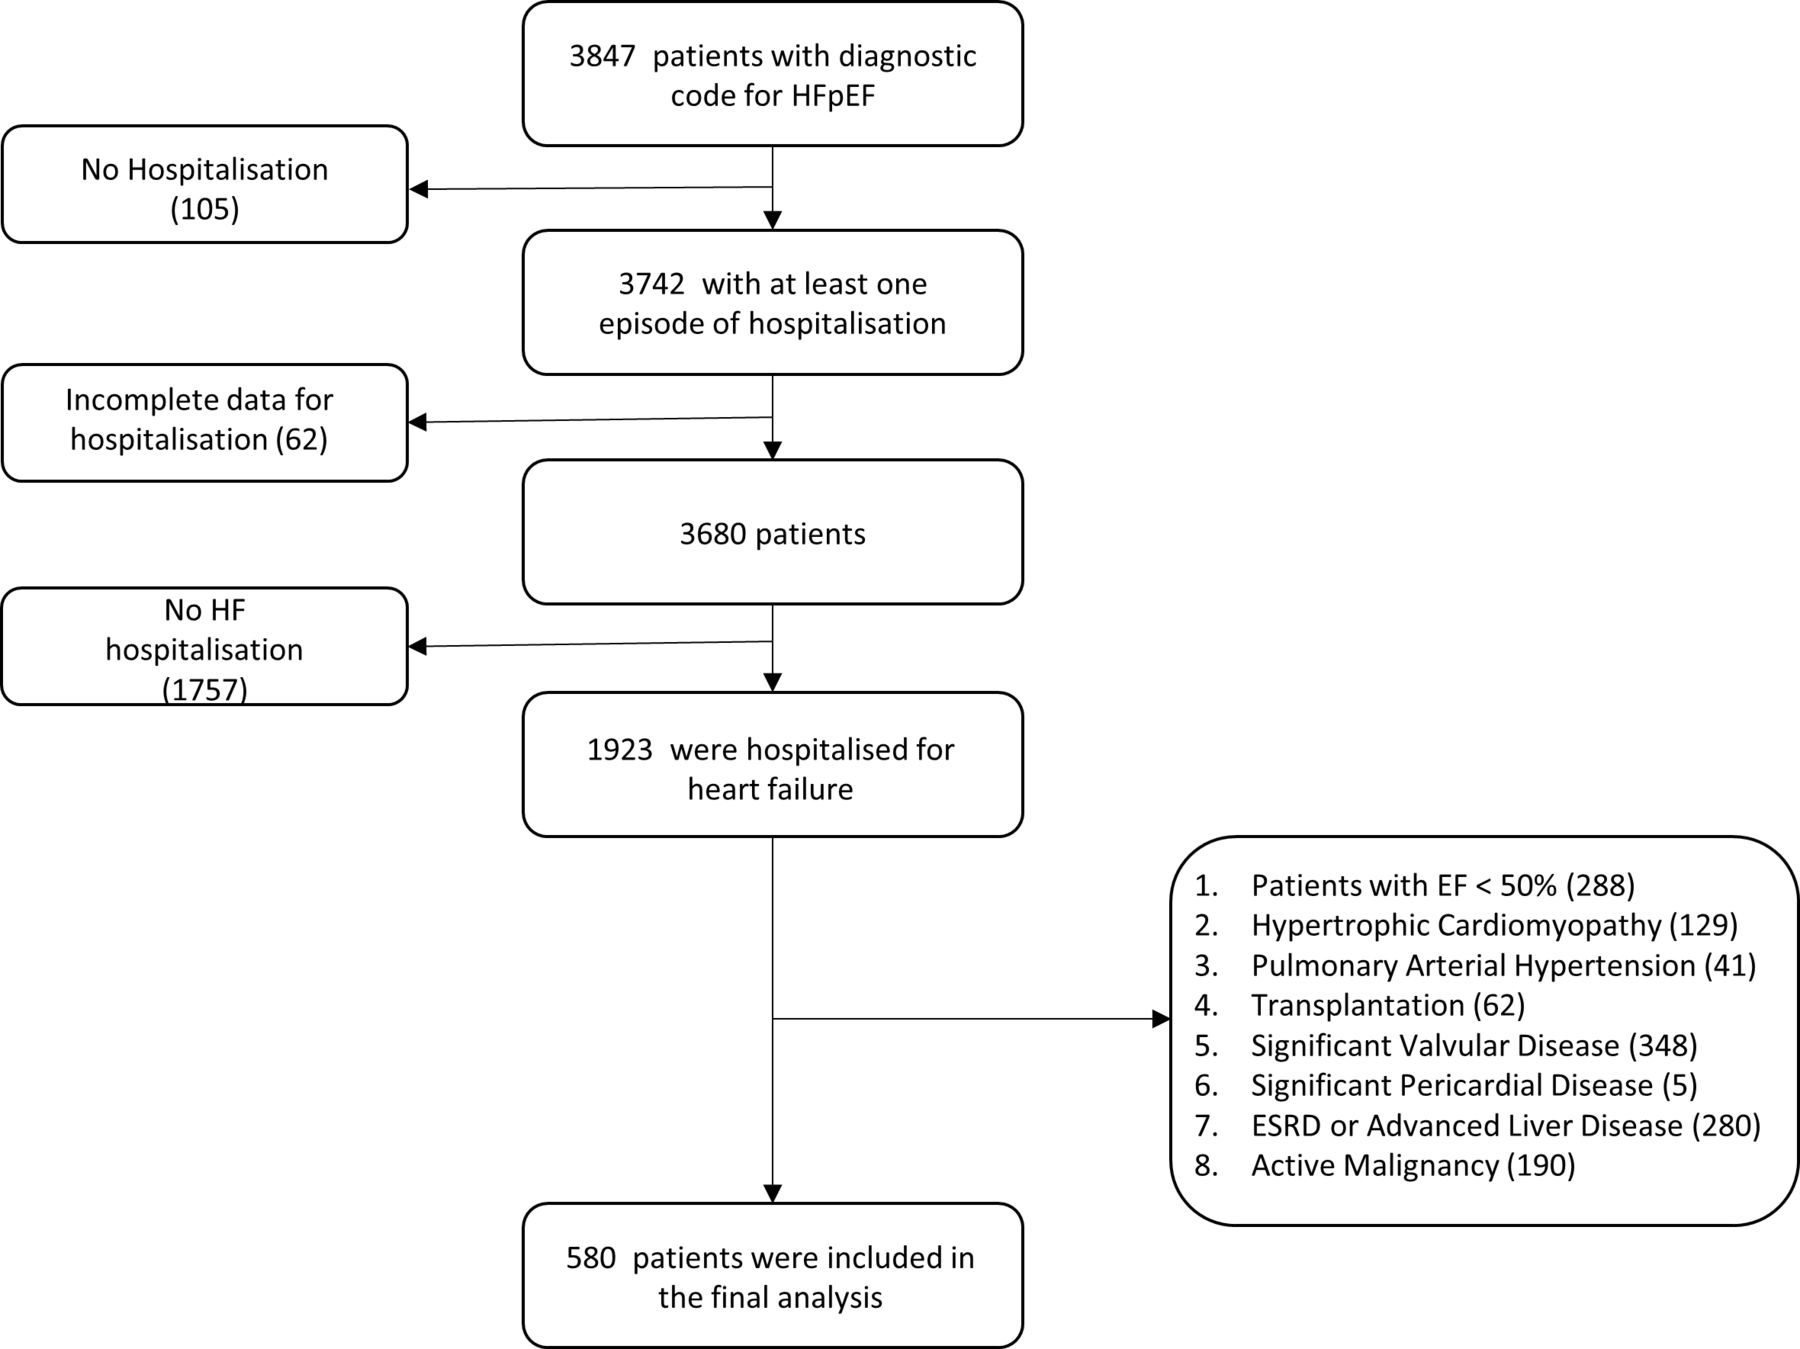
Using the Stanford Translational Research Integrated Database Environment,23 we identified 3847 adult patients with a diagnostic code for acute HFpEF (International Classification of Diseases, Ninth Revision (ICD-9) code 428.3) between January 1998 and December 2016. We also queried less specific ICD-9 codes such as 428.0, 428.1 and 428.9 excluding patients with a diagnosis of 428.2 or 428.4 (systolic HF component). Of the identified patients, we only selected patients who underwent an echocardiogram within the year of hospitalisation to verify the accurate evaluation of ejection fraction. Of these patients, 1923 had an admission for acute HF. We excluded patients with left ventricular ejection fraction (LVEF) <50% (n=288), hypertrophic cardiomyopathy (n=129), pulmonary arterial hypertension (n=41), heart transplantation (n=62), severe valvular heart disease (n=348), pericardial heart disease (n=5), end-stage renal disease and advanced liver disease (n=280) or active cancer (n=190). Finally, 580 patients met the inclusion and exclusion criteria and were included in the analysis (figure 1).

Schematic representation of population with inclusion and exclusion criteria. EF, ejection fraction; ESRD, end-stage renal disease; HF, heart failure; HFpEF, heart failure with preserved ejection fraction.
Clinical data collection
Clinical data were curated using medical chart review by two physicians (KAB and FH). Data collected included demographics (age, gender and race/ethnicity), vital signs (heart rate, blood pressure, respiratory rate and oxygen saturation), body mass index (BMI), comorbid conditions including DM, systemic hypertension, chronic obstructive pulmonary disease, CAD and Afib. Laboratory values including CBC with differential, BMP, NT-proBNP (Roche diagnostics, Mannheim, Germany) and medication list were recorded. LVEF was collected by reviewing the most recent echocardiography report available from the date of admission. We selected the first admission for HFpEF available in the chart with complete clinical data. Although the data collected ranged over many years, the laboratory methods of estimating the values were consistent.
Risk score calculation
Calculation of the IMRS (1-year mortality weightings) and the GWTG-HF risk score have been published previously.11 14 17 22 Variables included in the scores are summarised in online supplementary table 1. In order to assess each of the HF risk scores’ ability to discriminate outcome, we divided risk scores into tertiles.
Primary outcome
The primary outcome was defined as all-cause mortality. The US Social Security Death Index was used to ascertain the mortality status of each patient as of February 2014, and the time of the event was determined from whichever was later. Accuracy of the status was also confirmed using chart review and care everywhere network (Epic Systems Corporation, Verona, Wisconsin, USA). Data were not available on specific cardiovascular mortality rates. We did however carefully screen each chart to exclude active cancer, end-stage renal or liver disease.
Statistical analyses
Normality of the data was tested using Kolmogorov-Smirnov test and verified using histogram plots. Normally distributed quantitative data were expressed as mean±SD, and non-normally distributed data were expressed as median (IQRs); qualitative variables were presented as numbers and percentages. Variables’ association with outcome was assessed using univariable Cox proportional hazard analysis. Variables with p<0.20 on univariable analyses were included in multivariable stepwise Cox proportional hazard analysis to identify independent factors associated with outcome. HRs were adjusted for SD. Model fit was tested using likelihood ratio test and Wald test. Survival curves were plotted using the method of Kaplan and Meier. The incremental value of different scores to predict events was assessed using the integrated as well as discrimination improvement and the net reclassification improvement as described by Pencina et al.24 Receiver-operating characteristics curve (ROC) analyses were also performed to determine the ability of the risk scores to distinguish outcome and to assess whether adding NT-proBNP to the risk scores improved the ability compared with the model of the risk score alone. To assess the incremental value of individual scores and NT-proBNP on ROC analyses for 3-year outcome, the scores were Z transformed and the change in area under curve (AUC) was assessed by summation of the individual Z scores. A p value <0.05 was considered statistically significant. We used SPSS V.22 and NCSS V.11 (NCSS, Kaysville, Utah, USA) for statistical analyses.
To analyse the complex relationship between variables, correlation network analysis was used. A scale-free correlation network analysis was used to display the association between variables considered in the HF risk scores. First, a correlation matrix was developed using RStudio Version 1.0.136 2009–2016 RStudio, Inc., then these data were presented visually with a prefuse force directed layout correlation network using Cytoscape 3.4.025 26; nodes representing measured parameters, while edges representing strength of the pull between a node and its connected neighbours as estimated by statistically significant Pearson’s r values (p<0.001). Analyses were performed using MedCalc version 15.8 (MedCalc Software, Ostend, Belgium) and RStudio Version 1.0.136—VC 2009–2016 (RStudio, Inc) with corrplot: Visualisation of a Correlation Matrix (v0.77, 2016).27
Results
Population characteristics
The mean age of the population was 76±16 years with 334 (58%) female and a significant proportion of patients with DM (36%), a history of systemic hypertension (97%) or a previous history of Afib (58%) (table 1). The median duration of hospitalisation was 4 (IQR 2–9) days. Vital signs and laboratory values are presented in table 1.
Clinical characteristics of patient population
IMRS and GWTG-HF risk score
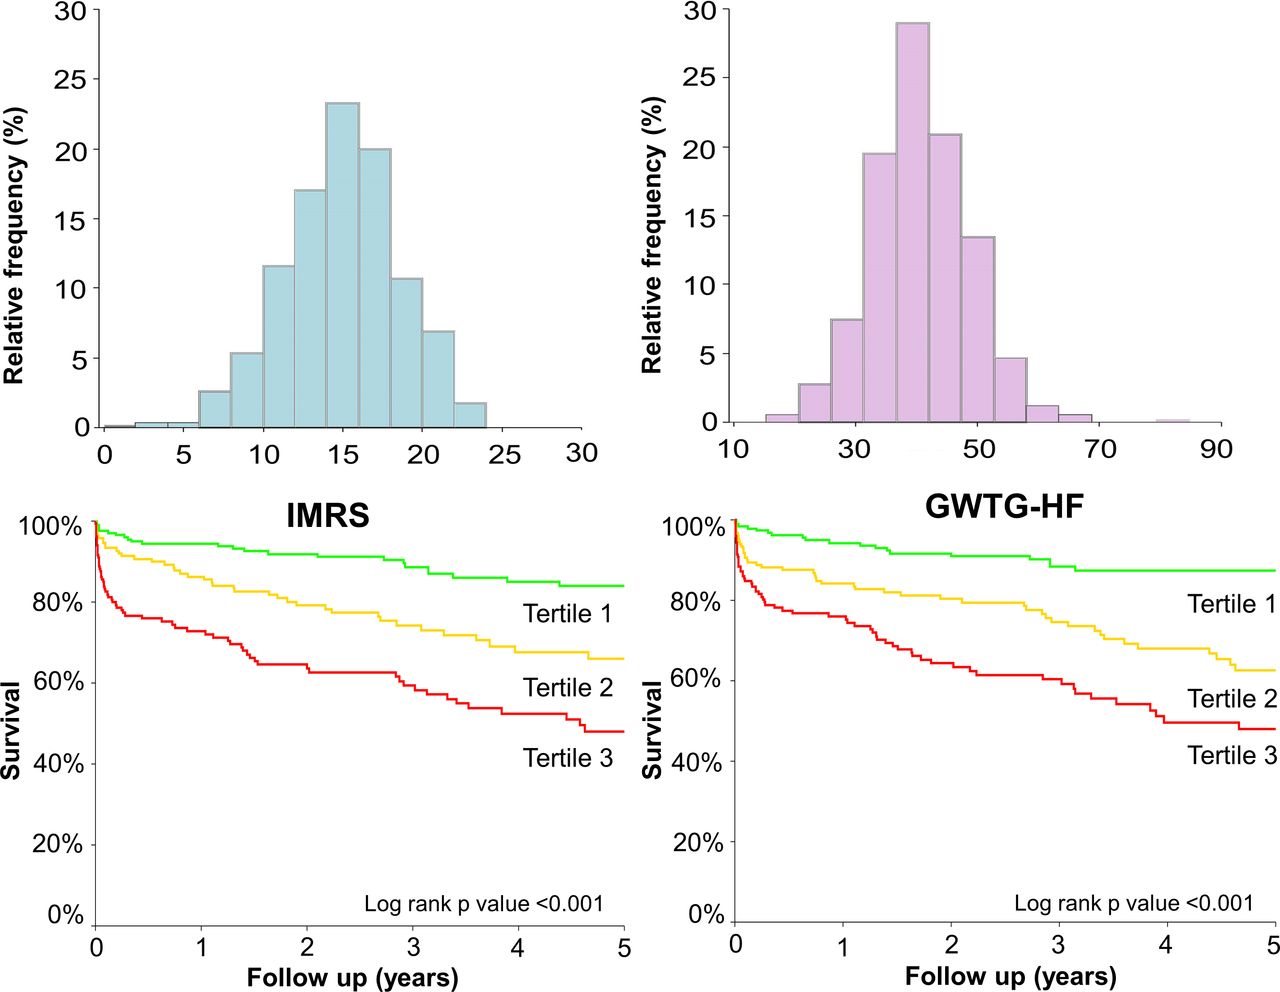
The IMRS and the GWTG-HF risk scores for the population were normally distributed with a mean value of 40.9±8.1 and 15.4±3.6, respectively (figure 2). There was a moderate association between the IMRS and the GWTG-HF risk score (R2=0.28, p<0.001).

Histograms for HF risk scores and Kaplan-Meier survival curves for HF risk scores by tertiles; normally distributed histogram for IMRS and Kaplan-Meier survival curve for IMRS according to tertiles. Normally distributed histogram for GWTG-HF risk score and Kaplan-Meier survival curve for GWTG-HF risk score according to tertiles. GWTG-HF, Get With The Guidelines-Heart Failure; HF, heart failure; IMRS, Intermountain Risk Score.
Outcome prediction using IMRS and GWTG-HF risk score for all-cause mortality
Over the median follow-up of 1.96 (0.24–4.62) years, 140 patients died (24.1%). On univariable Cox proportional hazard analysis of all-cause mortality, IMRS (HR 1.98; 95% CI 1.65 to 2.36; p<0.001), GWTG-HF (HR 2.01; 95% CI 1.73 to 2.33; p<0.001), age (HR 1.84; 95% CI 1.36 to 2.47; p<0.001), CAD (HR 1.41; 95% CI 0.99 to 2.01; p=0.05), Afib (HR 1.74; 95% CI 1.21 to 2.50; p=0.003), BMI (HR 0.75; 95% CI 0.60 to 0.87; p=0.002), heart rate (HR 1.22; 95% CI 1.01 to 1.49; p=0.001), haematocrit (HR 0.78; 95% CI 0.65 to 0.94; p=0.009), mean corpuscular haemoglobin concentration (MCHC) (HR 0.77; 95% CI 0.66 to 0.89; p=0.001), RDW (HR 1.38; 95% CI 1.22 to 1.52; p<0.001), serum sodium (HR 0.80; 95% CI 0.70 to 0.94; p=0.008), blood urea nitrogen (BUN) (HR 1.42; 95% CI 1.19 to 2.69; p<0.001), serum creatinine (HR 1.16; 95% CI 1.07 to 1.28; p<0.001), serum potassium (HR 1.21; 95% CI 1.06 to 1.39; p=0.005) and log NT-proBNP (HR 1.78; 95% CI 1.45 to 2.19; p<0.001) emerged as significant correlates (online supplementary table 2). On multivariable Cox proportional hazards analysis that included the risk scores (table 2A), IMRS and GWTG-HF risk score were independent correlates of all-cause mortality with a log likelihood ratio of −760.90 (figure 2). When the scores were excluded from the multivariable Cox model, age, CAD, heart rate, mean corpuscular volume (MCV), MCHC, RDW, sodium and BUN were independent correlates of all-cause mortality with a log likelihood ratio of −742.17 (table 2B). Combining the two scores improved the net reclassification over GWTG-HF alone by 36.2% (table 2C). There was a trend for the AUC for 3-year outcome 0.72 versus 0.69, respectively, for individual scores (p=0.08).
Supplemental material
Multivariable Cox proportional hazard model analysis to predict all-cause mortality
Multivariable Cox proportional hazard model analysis to predict all-cause mortality (excluding scores)
Integrated discrimination improvement (IDI) and net reclassification improvement (NRI) for 3-year all-cause mortality
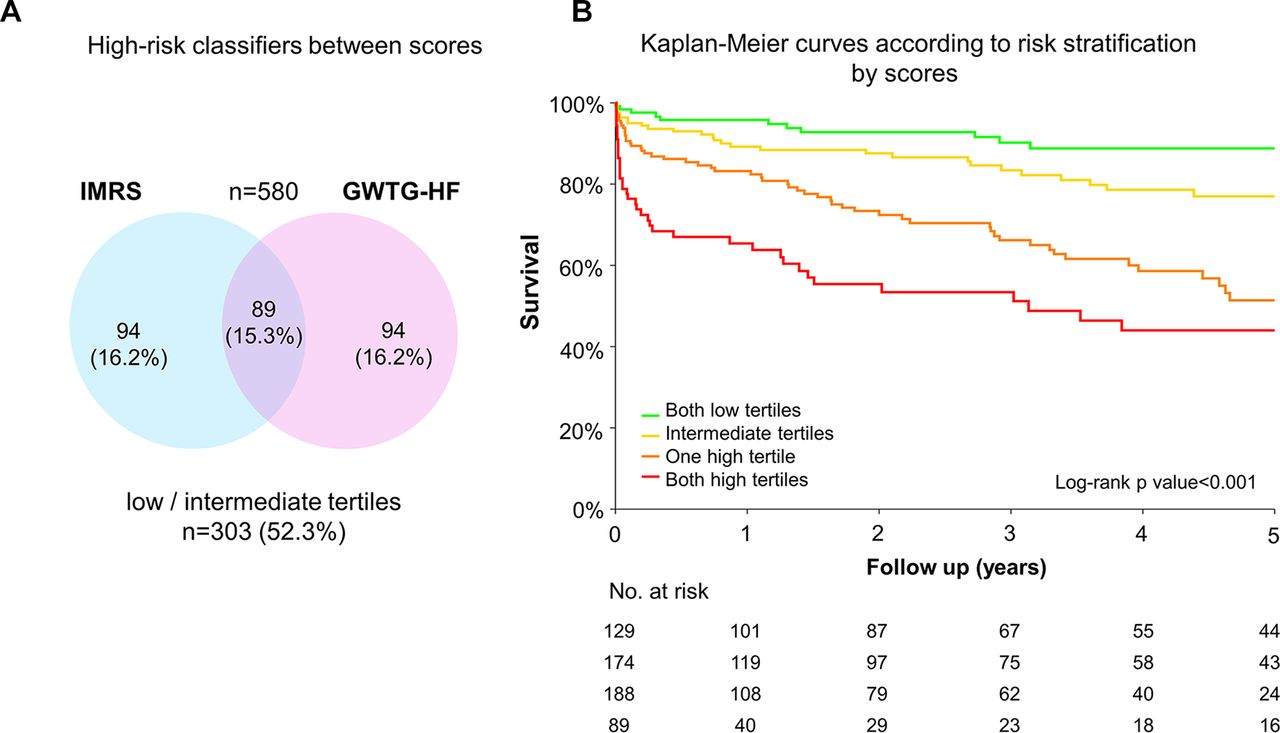
To evaluate the potential contribution of the scores using categorical classification, we decided to assess the complementarity of the scores using tertile of each score which could be easier for clinical implementation. Eighty-nine (15.3%) patients were in the higher tertiles by both the scores, 188 (32.4%), were in the higher tertiles by only one score, while 129 (22.2%) patients were in the lower tertiles by both the scores (figure 3). Patients in higher tertile strata had adverse outcome compared with those in lower tertile strata (HR 2.06; 95% CI 1.72 to 2.46; p<0.001)(figure 3).

High-risk classifiers between scores and Kaplan-Meier survival curves according to risk stratification by scores: (A) high-risk classifiers between scores representing patients with higher score tertile based on each score; (B) Kaplan-Meier survival curves according to risk stratification by score tertiles according to the two scores (only high tertiles, at least one high tertile, only low tertiles or at least an intermediate tertile). GWTG-HF, Get With The Guidelines-Heart Failure; IMRS, Intermountain Risk Score.
Subgroup analysis of patients with NT-proBNP
The NT-proBNP value was available in 341 (58.8%) patients with a median value of 2145 (955.5–5133.5) pg/mL. Log NT-proBNP was normally distributed with a mean value of 3.3±0.6 (online supplementary figure 1). Among those patients, 28 (8.2%) patients had NT-proBNP value <300 pg/mL, 58 (17%) had NT-proBNP value between 300 pg/mL and 1000 pg/mL and 255 (74.8%) had values>1000 pg/mL. Of the patients with NT-proBNP <300 pg/mL, evidence of HF was documented on physical examination and chest radiograph.
Supplemental material
In the subgroup of patients with NT-proBNP (n=341), patients with log NT-proBNP in the higher tertile had an adverse outcome as compared with the patients in the lower tertile (online supplementary figure 1). On multivariable Cox proportional hazard analysis, IMRS, GWTG-HF risk score and log NT-proBNP were independently associated with overall all-cause mortality with a log likelihood ratio of −573.90 (table 2A). When the scores were excluded from the multivariable model, age, heart rate, MCV, MCHC, RDW, sodium and BUN and log NT-proBNP were independently associated with overall all-cause mortality with a log likelihood ratio of −562.80 (table 2B). In patients with NT-proBNP, NT-proBNP improved the net reclassification of each score by 46.2% (IMRS) and 36.3% (GWTG-HF). Addition of NT-proBNP also improved the AUC for 3-year outcome of both the scores (0.69 vs 0.64, p=0.02 for both scores).
To better understand the complementarity between scores and NT-proBNP, we visualised their relationship using a correlation network highlighting the factors considered and retained in each score (figure 4). NT-proBNP, age, BUN and creatinine were well connected to other factors playing a central role within network. There was a moderate correlation between age and both Afib and NT-proBNP, as well as a close correlation and proximity of haematological measures (haemoglobin, RDW and haematocrit). Outside these variables, there appeared to be sparse relationships between parameters.

Network analysis. (A) Correlation network analysis of the variables (clinical and laboratory factors) considered and retained in the scores using perfuse force directed layout; variables more strongly associated together. (B) Variables not strongly associated together in the network analysis. AFIB, atrial fibrillation; BMI, body mass index; BUN, blood urea nitrogen; CA, calcium; CAD, coronary artery disease; CO2, bicarbonate; COPD, chronic obstructive pulmonary disease; CREAT, serum creatinine; DM, diabetes mellitus; GLUC, blood glucose; HB, haemoglobin; HCT, haematocrit; HLD, hyperlipidaemia; HR, heart rate; K, potassium; LVEF, left ventricular ejection fraction; MCHC, mean corpuscular haemoglobin concentration; MCV, mean corpuscular volume; O2, oxygen saturation; PLT, platelet; RDW, red cell distribution width; RR, respiratory rate; SBP, systolic blood pressure; SMK, smoking; WBC, white blood cell count.
Discussion
The main finding of this study is that the IMRS, developed in a general hospitalised cohort using commonly available standardised objective laboratory parameters, was associated with all-cause mortality in patients with HFpEF with a similar predictive ability as the HF-specific GWTG-HF risk score. Furthermore, in combination, these two scores (ie, IMRS and GWTG-HF risk score) are complementary in predicting all-cause mortality, providing additional risk prediction when evaluated together. Consistent with previous studies, we have also validated the ability of NT-proBNP to reclassify long-term mortality risk of patients hospitalised with acute HFpEF in complement to clinical scores.
HFpEF is a growing cause of morbidity and mortality in older adults.1–4 Several series have reported a mortality ranging from 15% to 30% at 5 years.8–10 Our population is representative of these series, with a mortality rate of 24% over a median follow-up of 2 years. We have also observed a high prevalence of co-morbidities including DM, CAD, CKD and Afib in our population. This study shows that patients with an intermediate risk by the GWTG-HF risk score can be reclassified as high risk using IMRS. For better impact on clinical management, a novel strategy is warranted. Since there are no clinical guideline supported specific therapeutics available for high-risk population, the practical implication would be to use these risk scores for close monitoring and management of early stage decompensation in this subpopulation.
The GWTG-HF risk score was validated in patients with acute HF including reduced and preserved ejection fraction.22 28 Central to this score are age, race, markers of renal function, heart rate and systolic BP. While GWTG-HF risk score was developed to predict in-hospital mortality, we demonstrate in our study that it also predicts long-term survival in patients with HFpEF. Compared with GWTG-HF risk score, the IMRS considers more comprehensive laboratory based markers such as RDW and WCC count that have also been shown to be predictive of outcome in HF.29 RDW, which emerged as strong correlate of mortality in our study, was also recently shown to predict mortality in acute HF with both HFrEF and HFpEF as well as in atherosclerosis.30–32 In a study by Imai et al in which 278 consecutive patients with acute decompensated HFpEF were enrolled, RDW emerged as an independent predictor of poor outcome due to non-cardiac events.32 Thus, more CBC markers such as RDW should be integrated in HF risk scores. As outlined by our univariable analysis, age is a strong factor that drives outcome in both scores. An interesting question would be if a new combined risk score can improve risk stratification and outcome in this patient population.
NT-proBNP improved the net reclassification of both scores. BNP or NT-proBNP have been used as a supportive diagnostic criteria for HFpEF as recently reviewed by Santaguida et al.33–36 BNP has previously been shown to improve the net reclassification for in-hospital mortality when added to GWTG-HF score, although the net reclassification was lower as it addressed in-hospital mortality.22 Among other biomarkers, troponin (including higher sensitivity troponin) has been shown to be associated with adverse in-hospital and postdischarge outcomes in patients with acutely decompensated HFpEF.37 While biomarkers such as ST-2, galectin-3, growth differentiating factor-15 (GDF-15) have also been predictive of outcome in HFpEF,38–40 their incremental value to well-validated and simple clinical scores remains to be proven. In addition to clinical and laboratory data, several investigators have assessed the importance of echocardiographic parameters in patients with HFpEF such as haemodynamic parameters namely right ventricular systolic pressure41 and deformation imaging parameters focusing on left ventricle42 or left atrium.43 To evaluate the incremental role of these parameters to the risk scores is the subject of ongoing research.
As is being implemented in several centres, clinical risk scores are being automatically generated using electronic medical records. Several centres are using these scores to guide pathways of care following discharge.44 We therefore envision that incorporating multiple risk scores should not be an added burden on care and could help identify features of risk captured by complementary scores. Our study also identifies the direction to develop novel risk scores that incorporate NT-proBNP and other commonly available biomarkers such as RDW, which could further improve and simplify pathway of care in HF management.
Limitations
The present study should be interpreted in the context of its limitations. First, this is a retrospective single-centre cohort study with relatively smaller sample size, and therefore, validation is required. The study cohort, however, is representative of the recent trials and registries and the data, and each chart was carefully reviewed. Second, we did not collect data to calculate the scores for patients with HF and reduced ejection fraction to compare with HFpEF. Other biomarkers such as GDF-15 were not measured in our cohort. It will be interesting, though challenging, to see the incremental value of other biomarkers in addition to NT-proBNP to risk models derived from other cohorts. We did not include rehospitalisation as a secondary end-point as patients were followed at different institutions during the study period leading to incomplete data collection. Finally, we only used variables available on admission and future studies to investigate whether improvement of factors related to these scores or BNP have an impact on longer outcome.
Conclusion
Established risk scores including the broadly applicable IMRS and the HF-specific GWTG-HF risk score, along with NT-proBNP, play an important complementary role in predicting outcomes in patients hospitalised with HFpEF and could lead to the development of new integrated clinical scores using data that are already collected as a part of standard clinical HF care.
Acknowledgments
This work was supported by the Intermountain-Stanford Collaboration Initiative and the Philips Royal Research Grant of Heart Failure with Preserved Ejection Fraction. We also would like to acknowledge the Srinivasan research fund.
References
Footnotes
Contributors All authors take responsibility for all aspects of the reliability and freedom from bias of the data presented and their discussed interpretation.
Competing interests None declared.
Patient consent for publication Not required.
Provenance and peer review Not commissioned; externally peer reviewed.
Data availability statement No additional data are available.