
Very-Low-Calorie Ketogenic Diet as a Safe and Valuable Tool for Long-Term Glycemic Management in Patients with Obesity and Type 2 Diabetes


Abstract
:1. Introduction
2. Materials and Methods
2.1. Subjects
2.2. Laboratory Assay and Anthropometric Parameters
2.3. Quality of Life
2.4. Nutritional Intervention
2.5. Statistical Analysis
3. Results
4. Discussion
5. Conclusions
Author Contributions
Funding
Institutional Review Board Statement
Informed Consent Statement
Data Availability Statement
Acknowledgments
Conflicts of Interest
References
- Khan, M.A.B.; Hashim, M.J.; King, J.K.; Govender, R.D.; Mustafa, H.; Al Kaabi, J. Epidemiology of Type 2 Diabetes—Global Burden of Disease and Forecasted Trends. J. Epidemiol. Glob. Health 2020, 10, 107–111. [Google Scholar] [CrossRef] [Green Version]
- Zheng, Y.; Ley, S.H.; Hu, F.B. Global Aetiology and Epidemiology of Type 2 Diabetes Mellitus and Its Complications. Nat. Rev. Endocrinol. 2018, 14, 88–98. [Google Scholar] [CrossRef]
- World Health Organisation. Obesity and Overweight Fact Sheet. Available online: https://www.who.int/news-room/fact-sheets/detail/obesity-and-overweight (accessed on 10 December 2020).
- Engin, A. The Definition and Prevalence of Obesity and Metabolic Syndrome. Adv. Exp. Med. Biol. 2017, 960, 1–17. [Google Scholar] [CrossRef]
- Guh, D.P.; Zhang, W.; Bansback, N.; Amarsi, Z.; Birmingham, C.L.; Anis, A.H. The Incidence of Co-Morbidities Related to Obesity and Overweight: A Systematic Review and Meta-Analysis. Bmc Public Health 2009, 9, 88. [Google Scholar] [CrossRef] [Green Version]
- Kalra, S. Diabesity. J. Pak. Med. Assoc. 2013, 63, 532–534. [Google Scholar] [PubMed]
- Guarisco, G.; Leonetti, F. Covid-19 and Diabesity: When a Pandemia Cross Another Pandemia. Eat Weight Disord. 2020. [Google Scholar] [CrossRef]
- Huang, I.; Lim, M.A.; Pranata, R. Diabetes Mellitus Is Associated with Increased Mortality and Severity of Disease in COVID-19 Pneumonia—A Systematic Review, Meta-Analysis, and Meta-Regression. Diabetes Metab. Syndr. Clin. Res. Rev. 2020, 14, 395–403. [Google Scholar] [CrossRef] [PubMed]
- Paoli, A.; Gorini, S.; Caprio, M. The Dark Side of the Spoon—Glucose, Ketones and COVID-19: A Possible Role for Ketogenic Diet? J. Transl. Med. 2020, 18. [Google Scholar] [CrossRef] [PubMed]
- Kalligeros, M.; Shehadeh, F.; Mylona, E.K.; Benitez, G.; Beckwith, C.G.; Chan, P.A.; Mylonakis, E. Association of Obesity with Disease Severity Among Patients with Coronavirus Disease 2019. Obesity 2020, 28, 1200–1204. [Google Scholar] [CrossRef]
- Muscogiuri, G.; Pugliese, G.; Barrea, L.; Savastano, S.; Colao, A. Commentary: Obesity: The “Achilles Heel” for COVID-19? Metabolism 2020, 108, 154251. [Google Scholar] [CrossRef] [PubMed]
- Castellana, M.; Conte, E.; Cignarelli, A.; Perrini, S.; Giustina, A.; Giovanella, L.; Giorgino, F.; Trimboli, P. Efficacy and Safety of Very Low Calorie Ketogenic Diet (VLCKD) in Patients with Overweight and Obesity: A Systematic Review and Meta-Analysis. Rev. Endocr. Metab. Disord. 2020, 21, 5–16. [Google Scholar] [CrossRef] [PubMed]
- Cunha, G.M.; Guzman, G.; Correa De Mello, L.L.; Trein, B.; Spina, L.; Bussade, I.; Marques Prata, J.; Sajoux, I.; Countinho, W. Efficacy of a 2-Month Very Low-Calorie Ketogenic Diet (VLCKD) Compared to a Standard Low-Calorie Diet in Reducing Visceral and Liver Fat Accumulation in Patients With Obesity. Front. Endocrinol. 2020, 11. [Google Scholar] [CrossRef]
- Bueno, N.B.; de Melo, I.S.V.; de Oliveira, S.L.; da Rocha Ataide, T. Very-Low-Carbohydrate Ketogenic Diet v. Low-Fat Diet for Long-Term Weight Loss: A Meta-Analysis of Randomised Controlled Trials. Br. J. Nutr. 2013, 110, 1178–1187. [Google Scholar] [CrossRef] [Green Version]
- Goday, A.; Bellido, D.; Sajoux, I.; Crujeiras, A.B.; Burguera, B.; García-Luna, P.P.; Oleaga, A.; Moreno, B.; Casanueva, F.F. Short-Term Safety, Tolerability and Efficacy of a Very Low-Calorie-Ketogenic Diet Interventional Weight Loss Program versus Hypocaloric Diet in Patients with Type 2 Diabetes Mellitus. Nutr. Diabetes 2016, 6, e230. [Google Scholar] [CrossRef]
- Caprio, M.; Infante, M.; Moriconi, E.; Armani, A.; Fabbri, A.; Mantovani, G.; Mariani, S.; Lubrano, C.; Poggiogalle, E.; Migliaccio, S.; et al. Very-Low-Calorie Ketogenic Diet (VLCKD) in the Management of Metabolic Diseases: Systematic Review and Consensus Statement from the Italian Society of Endocrinology (SIE). J. Endocrinol. Investig. 2019. [Google Scholar] [CrossRef]
- Evert, A.B.; Dennison, M.; Gardner, C.D.; Garvey, W.T.; Lau, K.H.K.; MacLeod, J.; Mitri, J.; Pereira, R.F.; Rawlings, K.; Robinson, S.; et al. Nutrition Therapy for Adults With Diabetes or Prediabetes: A Consensus Report. Diabetes Care 2019, 42, 731–754. [Google Scholar] [CrossRef] [PubMed] [Green Version]
- Watanabe, M.; Tuccinardi, D.; Ernesti, I.; Basciani, S.; Mariani, S.; Genco, A.; Manfrini, S.; Lubrano, C.; Gnessi, L. Scientific Evidence Underlying Contraindications to the Ketogenic Diet: An Update. Obes. Rev. 2020. [Google Scholar] [CrossRef] [PubMed]
- Levey, A.S.; Stevens, L.A.; Schmid, C.H.; Zhang, Y.L.; Castro, A.F.; Feldman, H.I.; Kusek, J.W.; Eggers, P.; Van Lente, F.; Greene, T.; et al. A New Equation to Estimate Glomerular Filtration Rate. Ann. Intern. Med. 2009, 150, 604–612. [Google Scholar] [CrossRef]
- Gershuni, V.M.; Yan, S.L.; Medici, V. Nutritional Ketosis for Weight Management and Reversal of Metabolic Syndrome. Curr. Nutr. Rep. 2018, 7, 97–106. [Google Scholar] [CrossRef]
- Wang, J.; Thornton, J.C.; Bari, S.; Williamson, B.; Gallagher, D.; Heymsfield, S.B.; Horlick, M.; Kotler, D.; Laferrère, B.; Mayer, L.; et al. Comparisons of Waist Circumferences Measured at 4 Sites. Am. J. Clin. Nutr. 2003, 77, 379–384. [Google Scholar] [CrossRef] [Green Version]
- Lins, L.; Carvalho, F.M. SF-36 Total Score as a Single Measure of Health-Related Quality of Life: Scoping Review. Sage Open Med. 2016, 4, 2050312116671725. [Google Scholar] [CrossRef] [Green Version]
- Stunkard, A.J.; Messick, S. The Three-Factor Eating Questionnaire to Measure Dietary Restraint, Disinhibition and Hunger. J. Psychosom. Res. 1985, 29, 71–83. [Google Scholar] [CrossRef]
- de Lauzon, B.; Romon, M.; Deschamps, V.; Lafay, L.; Borys, J.-M.; Karlsson, J.; Ducimetière, P.; Charles, M.A.; Fleurbaix Laventie Ville Sante Study Group. The Three-Factor Eating Questionnaire-R18 Is Able to Distinguish among Different Eating Patterns in a General Population. J. Nutr. 2004, 134, 2372–2380. [Google Scholar] [CrossRef] [PubMed]
- Keskitalo, K.; Tuorila, H.; Spector, T.D.; Cherkas, L.F.; Knaapila, A.; Kaprio, J.; Silventoinen, K.; Perola, M. The Three-Factor Eating Questionnaire, Body Mass Index, and Responses to Sweet and Salty Fatty Foods: A Twin Study of Genetic and Environmental Associations. Am. J. Clin. Nutr. 2008, 88, 263–271. [Google Scholar] [CrossRef] [Green Version]
- Anglé, S.; Engblom, J.; Eriksson, T.; Kautiainen, S.; Saha, M.-T.; Lindfors, P.; Lehtinen, M.; Rimpelä, A. Three Factor Eating Questionnaire-R18 as a Measure of Cognitive Restraint, Uncontrolled Eating and Emotional Eating in a Sample of Young Finnish Females. Int. J. Behav. Nutr. Phys. Act. 2009, 6, 41. [Google Scholar] [CrossRef] [PubMed] [Green Version]
- Babio, N.; Bulló, M.; Basora, J.; Martínez-González, M.A.; Fernández-Ballart, J.; Márquez-Sandoval, F.; Molina, C.; Salas-Salvadó, J.; Nureta-PREDIMED Investigators. Adherence to the Mediterranean Diet and Risk of Metabolic Syndrome and Its Components. Nutr. Metab. Cardiovasc. Dis. 2009, 19, 563–570. [Google Scholar] [CrossRef]
- Moriconi, E.; Feraco, A.; Marzolla, V.; Infante, M.; Lombardo, M.; Fabbri, A.; Caprio, M. Neuroendocrine and Metabolic Effects of Low-Calorie and Non-Calorie Sweeteners. Front. Endocrinol. 2020, 11. [Google Scholar] [CrossRef] [PubMed]
- De Lorenzo, A.; Noce, A.; Moriconi, E.; Rampello, T.; Marrone, G.; Di Daniele, N.; Rovella, V. MOSH Syndrome (Male Obesity Secondary Hypogonadism): Clinical Assessment and Possible Therapeutic Approaches. Nutrients 2018, 10, 474. [Google Scholar] [CrossRef] [PubMed] [Green Version]
- Wells, J.C.K. The Diabesity Epidemic in the Light of Evolution: Insights from the Capacity-Load Model. Diabetologia 2019, 62, 1740–1750. [Google Scholar] [CrossRef] [Green Version]
- Kotz, C.M.; Perez-Leighton, C.E.; Teske, J.A.; Billington, C.J. Spontaneous Physical Activity Defends Against Obesity. Curr. Obes. Rep. 2017, 6, 362–370. [Google Scholar] [CrossRef]
- Ruban, A.; Doshi, A.; Lam, E.; Teare, J.P. Medical Devices in Obesity Treatment. Curr. Diabetes Rep. 2019, 19. [Google Scholar] [CrossRef] [PubMed] [Green Version]
- Tronieri, J.S.; Wadden, T.A.; Chao, A.M.; Tsai, A.G. Primary Care Interventions for Obesity: Review of the Evidence. Curr. Obes. Rep. 2019, 8, 128–136. [Google Scholar] [CrossRef]
- Pappachan, J.M.; Viswanath, A.K. Medical Management of Diabesity: Do We Have Realistic Targets? Curr. Diab. Rep. 2017, 17, 4. [Google Scholar] [CrossRef]
- Lean, M.E.; Leslie, W.S.; Barnes, A.C.; Brosnahan, N.; Thom, G.; McCombie, L.; Peters, C.; Zhyzhneuskaya, S.; Al-Mrabeh, A.; Hollingsworth, K.G.; et al. Primary Care-Led Weight Management for Remission of Type 2 Diabetes (DiRECT): An Open-Label, Cluster-Randomised Trial. Lancet 2018, 391, 541–551. [Google Scholar] [CrossRef] [Green Version]
- Baker, S.; Jerums, G.; Proietto, J. Effects and Clinical Potential of Very-Low-Calorie Diets (VLCDs) in Type 2 Diabetes. Diabetes Res. Clin. Pract. 2009, 85, 235–242. [Google Scholar] [CrossRef]
- Malandrucco, I.; Pasqualetti, P.; Giordani, I.; Manfellotto, D.; De Marco, F.; Alegiani, F.; Sidoti, A.M.; Picconi, F.; Di Flaviani, A.; Frajese, G.; et al. Very-Low-Calorie Diet: A Quick Therapeutic Tool to Improve β Cell Function in Morbidly Obese Patients with Type 2 Diabetes. Am. J. Clin. Nutr. 2012, 95, 609–613. [Google Scholar] [CrossRef] [PubMed] [Green Version]
- American Diabetes Association Standards of Medical Care in Diabetes—2019 Abridged for Primary Care Providers. Clin. Diabetes 2019, 37, 11–34. [CrossRef] [Green Version]
- Romano, L.; Marchetti, M.; Gualtieri, P.; Di Renzo, L.; Belcastro, M.; De Santis, G.L.; Perrone, M.A.; De Lorenzo, A. Effects of a Personalized VLCKD on Body Composition and Resting Energy Expenditure in the Reversal of Diabetes to Prevent Complications. Nutrients 2019, 11, 1526. [Google Scholar] [CrossRef] [Green Version]
- Casanueva, F.F.; Castellana, M.; Bellido, D.; Trimboli, P.; Castro, A.I.; Sajoux, I.; Rodriguez-Carnero, G.; Gomez-Arbelaez, D.; Crujeiras, A.B.; Martinez-Olmos, M.A. Ketogenic Diets as Treatment of Obesity and Type 2 Diabetes Mellitus. Rev. Endocr. Metab. Disord 2020. [Google Scholar] [CrossRef]
- Hussain, T.A.; Mathew, T.C.; Dashti, A.A.; Asfar, S.; Al-Zaid, N.; Dashti, H.M. Effect of Low-Calorie versus Low-Carbohydrate Ketogenic Diet in Type 2 Diabetes. Nutrition 2012, 28, 1016–1021. [Google Scholar] [CrossRef] [PubMed]
- Yuan, X.; Wang, J.; Yang, S.; Gao, M.; Cao, L.; Li, X.; Hong, D.; Tian, S.; Sun, C. Effect of the Ketogenic Diet on Glycemic Control, Insulin Resistance, and Lipid Metabolism in Patients with T2DM: A Systematic Review and Meta-Analysis. Nutr. Diabetes 2020, 10. [Google Scholar] [CrossRef]
- Walton, C.M.; Perry, K.; Hart, R.H.; Berry, S.L.; Bikman, B.T. Improvement in Glycemic and Lipid Profiles in Type 2 Diabetics with a 90-Day Ketogenic Diet. J. Diabetes Res. 2019, 2019, 8681959. [Google Scholar] [CrossRef] [Green Version]


| Parameters | VLCKD (n = 15) | LCD (n = 15) | p-Value |
|---|---|---|---|
| Age (years) | 60.5 ± 10.2 | 64.4 ± 8.8 | 0.271 |
| Sex | Female 7 (47%), Male 8 (53%) | Female 7 (47%), Male 8 (53%) | NA |
| Weight (kg) | 111.6 ± 19.8 | 91.6 ± 18.7 | 0.008 |
| BMI (kg/m2) | 39.5 ± 6.0 | 32.2 ± 4.3 | 0.001 |
| WC (cm) | 118.2 ± 9.0 | 103.1 ± 11.6 | 0.000 |
| HC (cm) | 119.4 ± 14.9 | 105.5 ± 9.3 | 0.005 |
| WHR | 1.00 ± 0.11 | 0.97 ± 0.05 | 0.452 |
| BPsys (mmHg) | 143.2 ± 16.3 | 139.6 ± 13.1 | 0.512 |
| BPdias (mmHg) | 85.4 ± 6.9 | 81.2 ± 7.0 | 0.105 |
| Glycemia (mg/dL) | 118.2 ± 18.8 | 129.3 ± 33.6 | 0.273 |
| HbA1c (%) | 6.6 ± 0.84 | 6.7 ± 0.69 | 0.642 |
| Tot Chol (mg/dL) | 203.4 ± 35.0 | 196 ± 26.7 | 0.518 |
| HDL chol (mg/dL) | 42.4 ± 13.6 | 42.3 ± 8.6 | 0.975 |
| LDL chol (mg/dL) | 126.0 ± 38.3 | 117.7 ± 29.2 | 0.509 |
| Trig (mg/dL) | 188.2 ± 36.4 | 179.8 ± 20.3 | 0.444 |
| Creatinine (mg/dL) | 0.89 ± 0.25 | 0.83 ± 0.20 | 0.517 |
| Characteristics | VLCKD | LCD | ||
| Baseline (T0) | After 12 Months (T2) | Baseline (T0) | After 12 months (T2) | |
| Subjects | 15 | 15 | ||
| Men | 8 | 8 | ||
| Women | 7 | 7 | ||
| Diabetes Duration (years) | 2.53 ± 1.19 | 2.47 ± 1.36 | ||
| Pharmacological Treatment | VLCKD | LCD | ||
| Diet | 1 | 4 | 0 | 0 |
| Metformin + Diet | 5 | 11 | 15 | 8 |
| Metformin + Sulphonylurea | 2 | 0 | 0 | 0 |
| Metformin + GLP-1 agonists | 2 | 0 | 0 | 6 |
| Metformin + SGLT2 inhibitors | 3 | 0 | 0 | 1 |
| Metformin + DPP4 inhibitors | 2 | 0 | 0 | 0 |
| Parameters | VLCKD T0 | VLCKD T1 | p T0-T1 | VLCKD T2 | pT0-T2 | LCD T0 | LCD T1 | pT0-T1 | LCD T2 | pT0-T2 |
|---|---|---|---|---|---|---|---|---|---|---|
| Weight (kg) | 111.6 ± 19.8 | 102.1 ± 16.1 | 0.000 | 98.7 ± 13.4 | 0.000 | 91.6 ± 18.7 | 91.3 ± 19.6 | 0.706 | 90.5 ± 19.5 | 0.623 |
| BMI (kg/m2) | 39.5 ± 6.0 | 35.9 ± 5.3 | 0.000 | 34.8 ± 4.04 | 0.001 | 32.2 ± 4.3 | 29.7 ± 8.6 | 0.252 | 32.0 ± 4.5 | 0.442 |
| WC (cm) | 118.2 ± 9.0 | 113.8 ± 7.5 | 0.000 | 114.5 ± 6,68 | 0.002 | 103.1 ± 11.6 | 102.4 ± 11.5 | 0.274 | 102.4 ± 12.0 | 0.396 |
| HC (cm) | 121.6 ± 16.4 | 118.1 ± 15.2 | 0.008 | 117.1 ± 13.9 | 0.006 | 105.2 ± 10.6 | 104.1 ± 10.5 | 0.173 | 104.2 ± 10.2 | 0.141 |
| WHR | 1.00 ± 0.13 | 0.98 ± 0.13 | 0.276 | 0.99 ± 0.13 | 0.399 | 0.98 ± 0.04 | 0.98 ± 0.05 | 0.493 | 0.98 ± 0.04 | 0.169 |
| SysBP (mmHg) | 143.2 ± 16.3 | 134.6 ± 10.7 | 0.001 | 129.4 ± 10.0 | 0.002 | 136.4 ± 12.3 | 133.4 ± 12.9 | 0.024 | 138.8 ± 7.9 | 0.486 |
| DiasBP (mmHg) | 87.5 ± 5.59 | 82.7 ± 6.8 | 0.094 | 76.5 ± 9.3 | 0.007 | 80.8 ± 7.78 | 78.6 ± 7.60 | 0.471 | 85.7± 9.0 | 0.307 |
| Tot Chol (mg/dL) | 205.7 ± 35.1 | 178.5 ± 35.7 | 0.001 | 160.1 ± 40.1 | 0.001 | 187.3 ± 21.0 | 174.9 ± 43.9 | 0.475 | 177.5 ± 33.4 | 0.072 |
| HDL Chol (mg/dL) | 46.3 ± 14.25 | 45.8 ± 14.23 | 0.736 | 40.0 ± 10.4 | 0.171 | 45.2 ± 9.7 | 40.0 ± 7.2 | 0.285 | 48.6 ± 7.4 | 0.065 |
| LDL Chol (mg/dL) | 130.8 ± 31.0 | 105.5 ± 33.3 | 0.010 | 85 ± 35.5 | 0.219 | 103.4 ± 21.3 | 98.0 ± 38.6 | 0.758 | 100.7 ± 30.1 | 0.247 |
| Glycemia (mg/dL) | 118.2 ± 18.8 | 103.2 ± 20.0 | 0.024 | 105.2 ± 7.0 | 0.009 | 132.0 ± 33.1 | 123.8 ± 36.9 | 0.198 | 127.5 ± 33.4 | 0.071 |
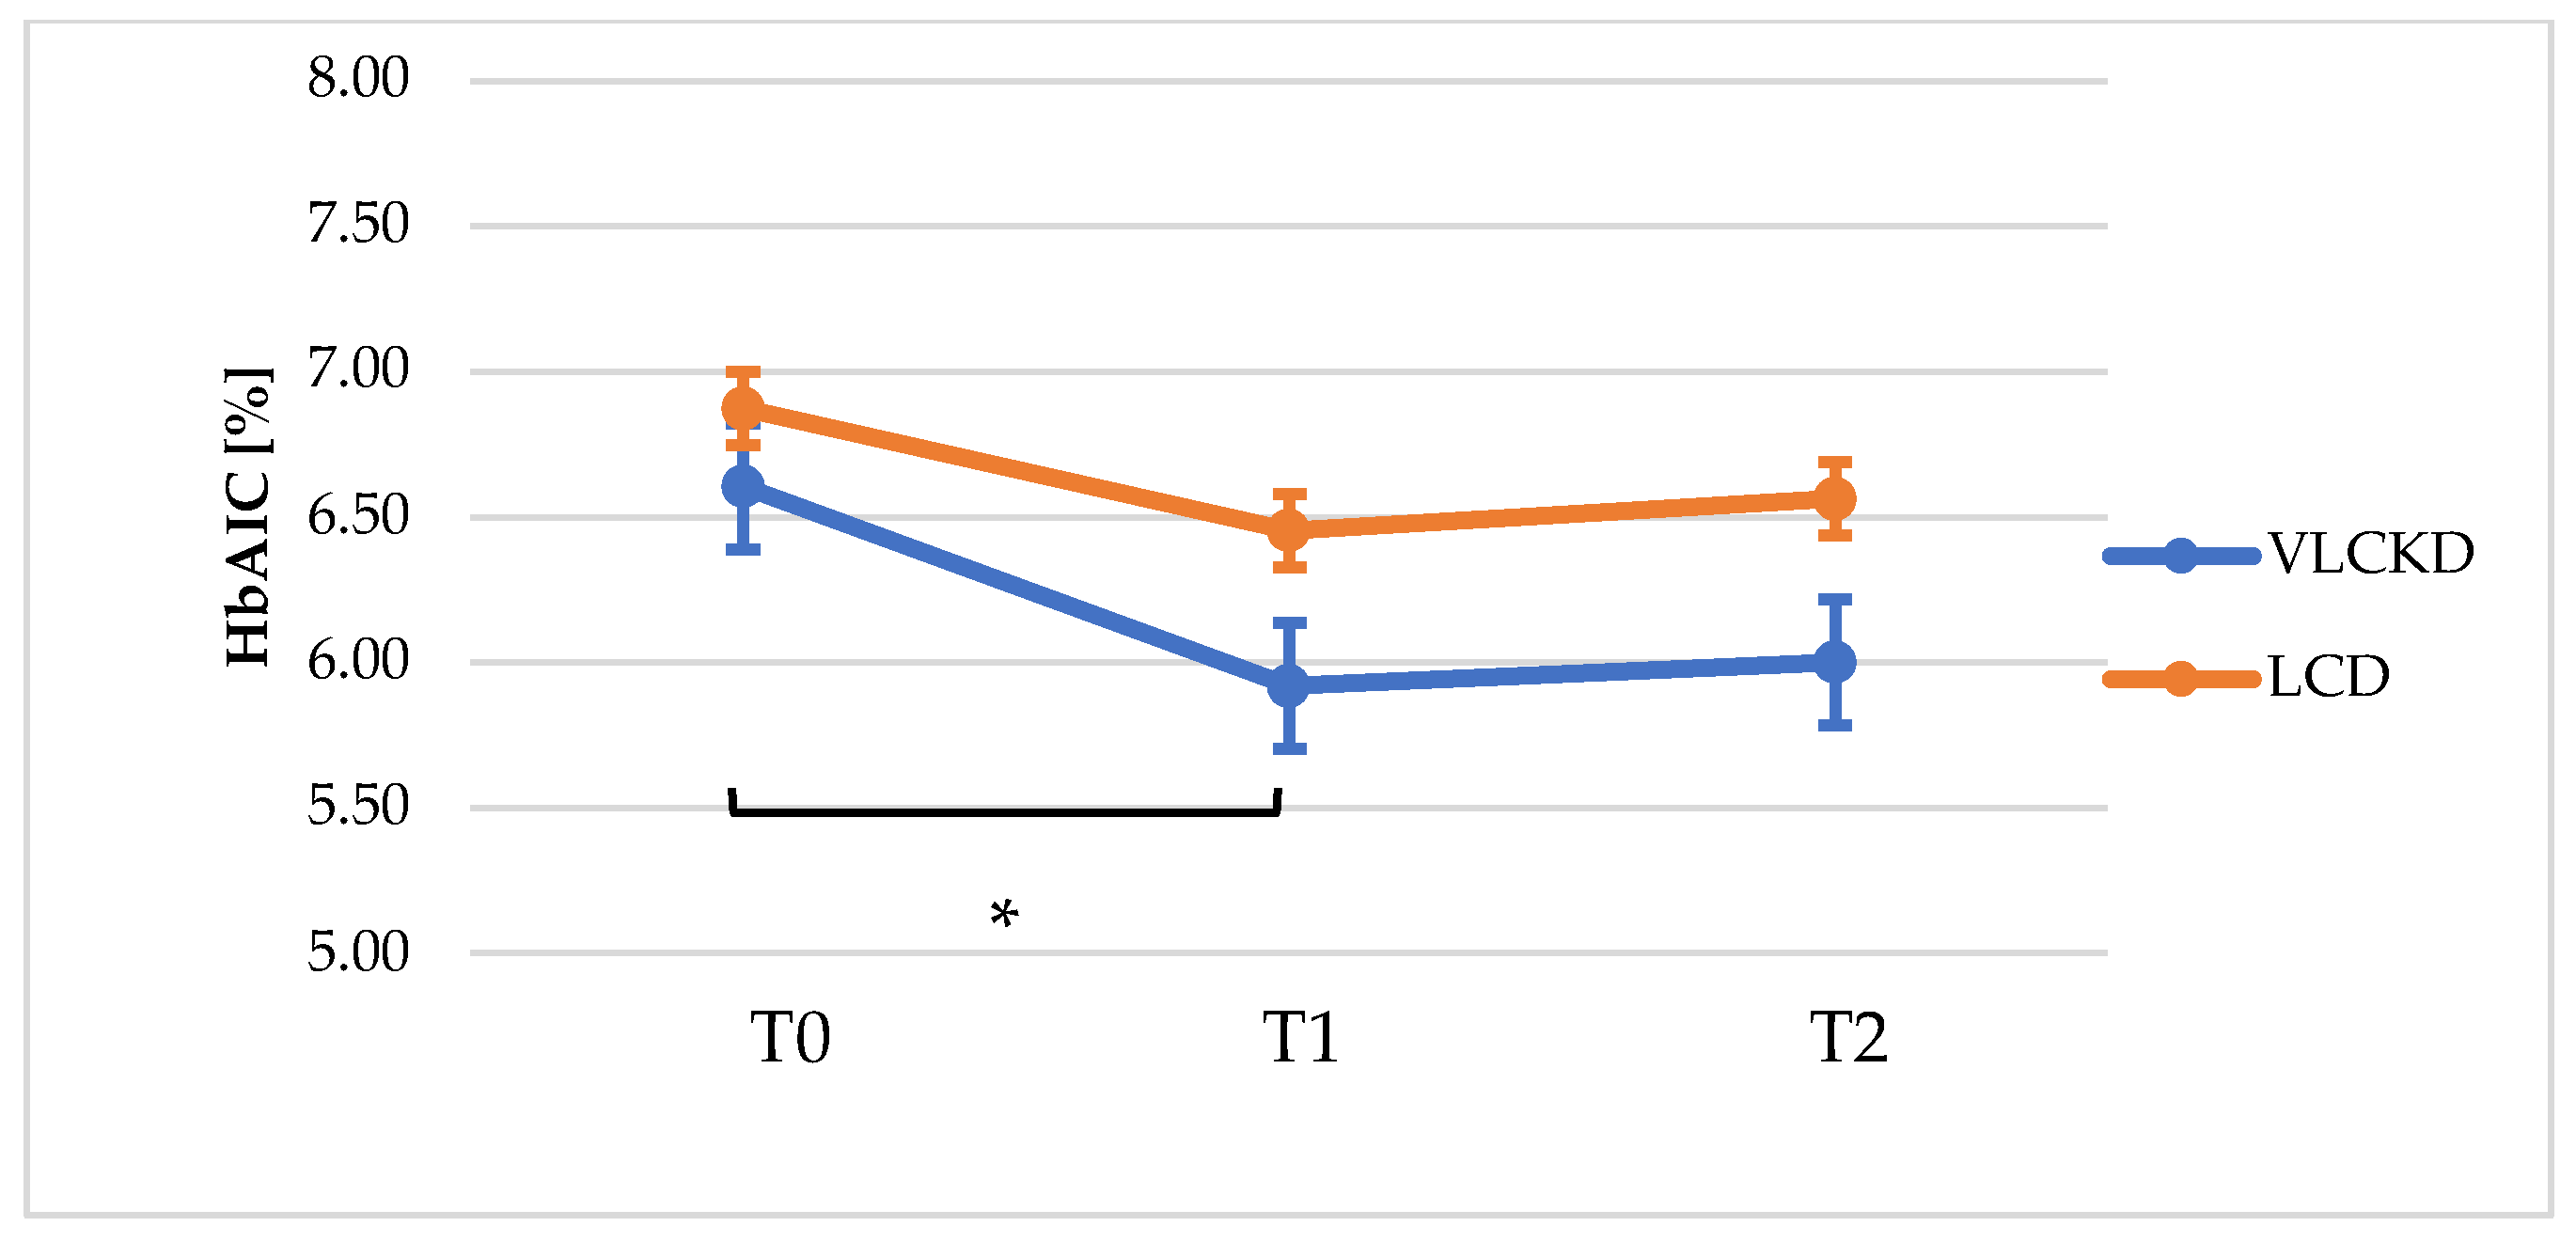
| HbA1c (%) | 6.6 ± 0.84 | 5.9 ± 0.71 | 0.002 | 6.2 ± 0.66 | 0.002 | 6.8 ± 1.00 | 6.4 ± 0.49 | 0.130 | 6.5 ± 0.55 | 0.273 |
| Creatinine (mg/dL) | 0.89 ± 0.25 | 0.85 ± 0.17 | 0.172 | 0.87 ± 0.5 | 0.527 | 0.83 ± 0.21 | 0.85 ± 0.18 | 0.487 | 0.81 ± 0.17 | 0.798 |
| AST (U/L) | 29.9 ± 8.79 | 28.9 ± 6.47 | 0.512 | 26.7 ± 5.19 | 0.057 | N | N | N | N | N |
| ALT (U/L) | 30.4 ± 16.45 | 29.1 ± 13.8 | 0.389 | 25.6 ± 7.56 | 0.141 | N | N | N | N | N |
| Parameters | ∆ T0-T1 (Mean ± SD) | p-Value | ∆ T0-T2 (Mean ± SD) | p-Value | ||
|---|---|---|---|---|---|---|
| VLCKD | LCD | VLCKD | LCD | |||
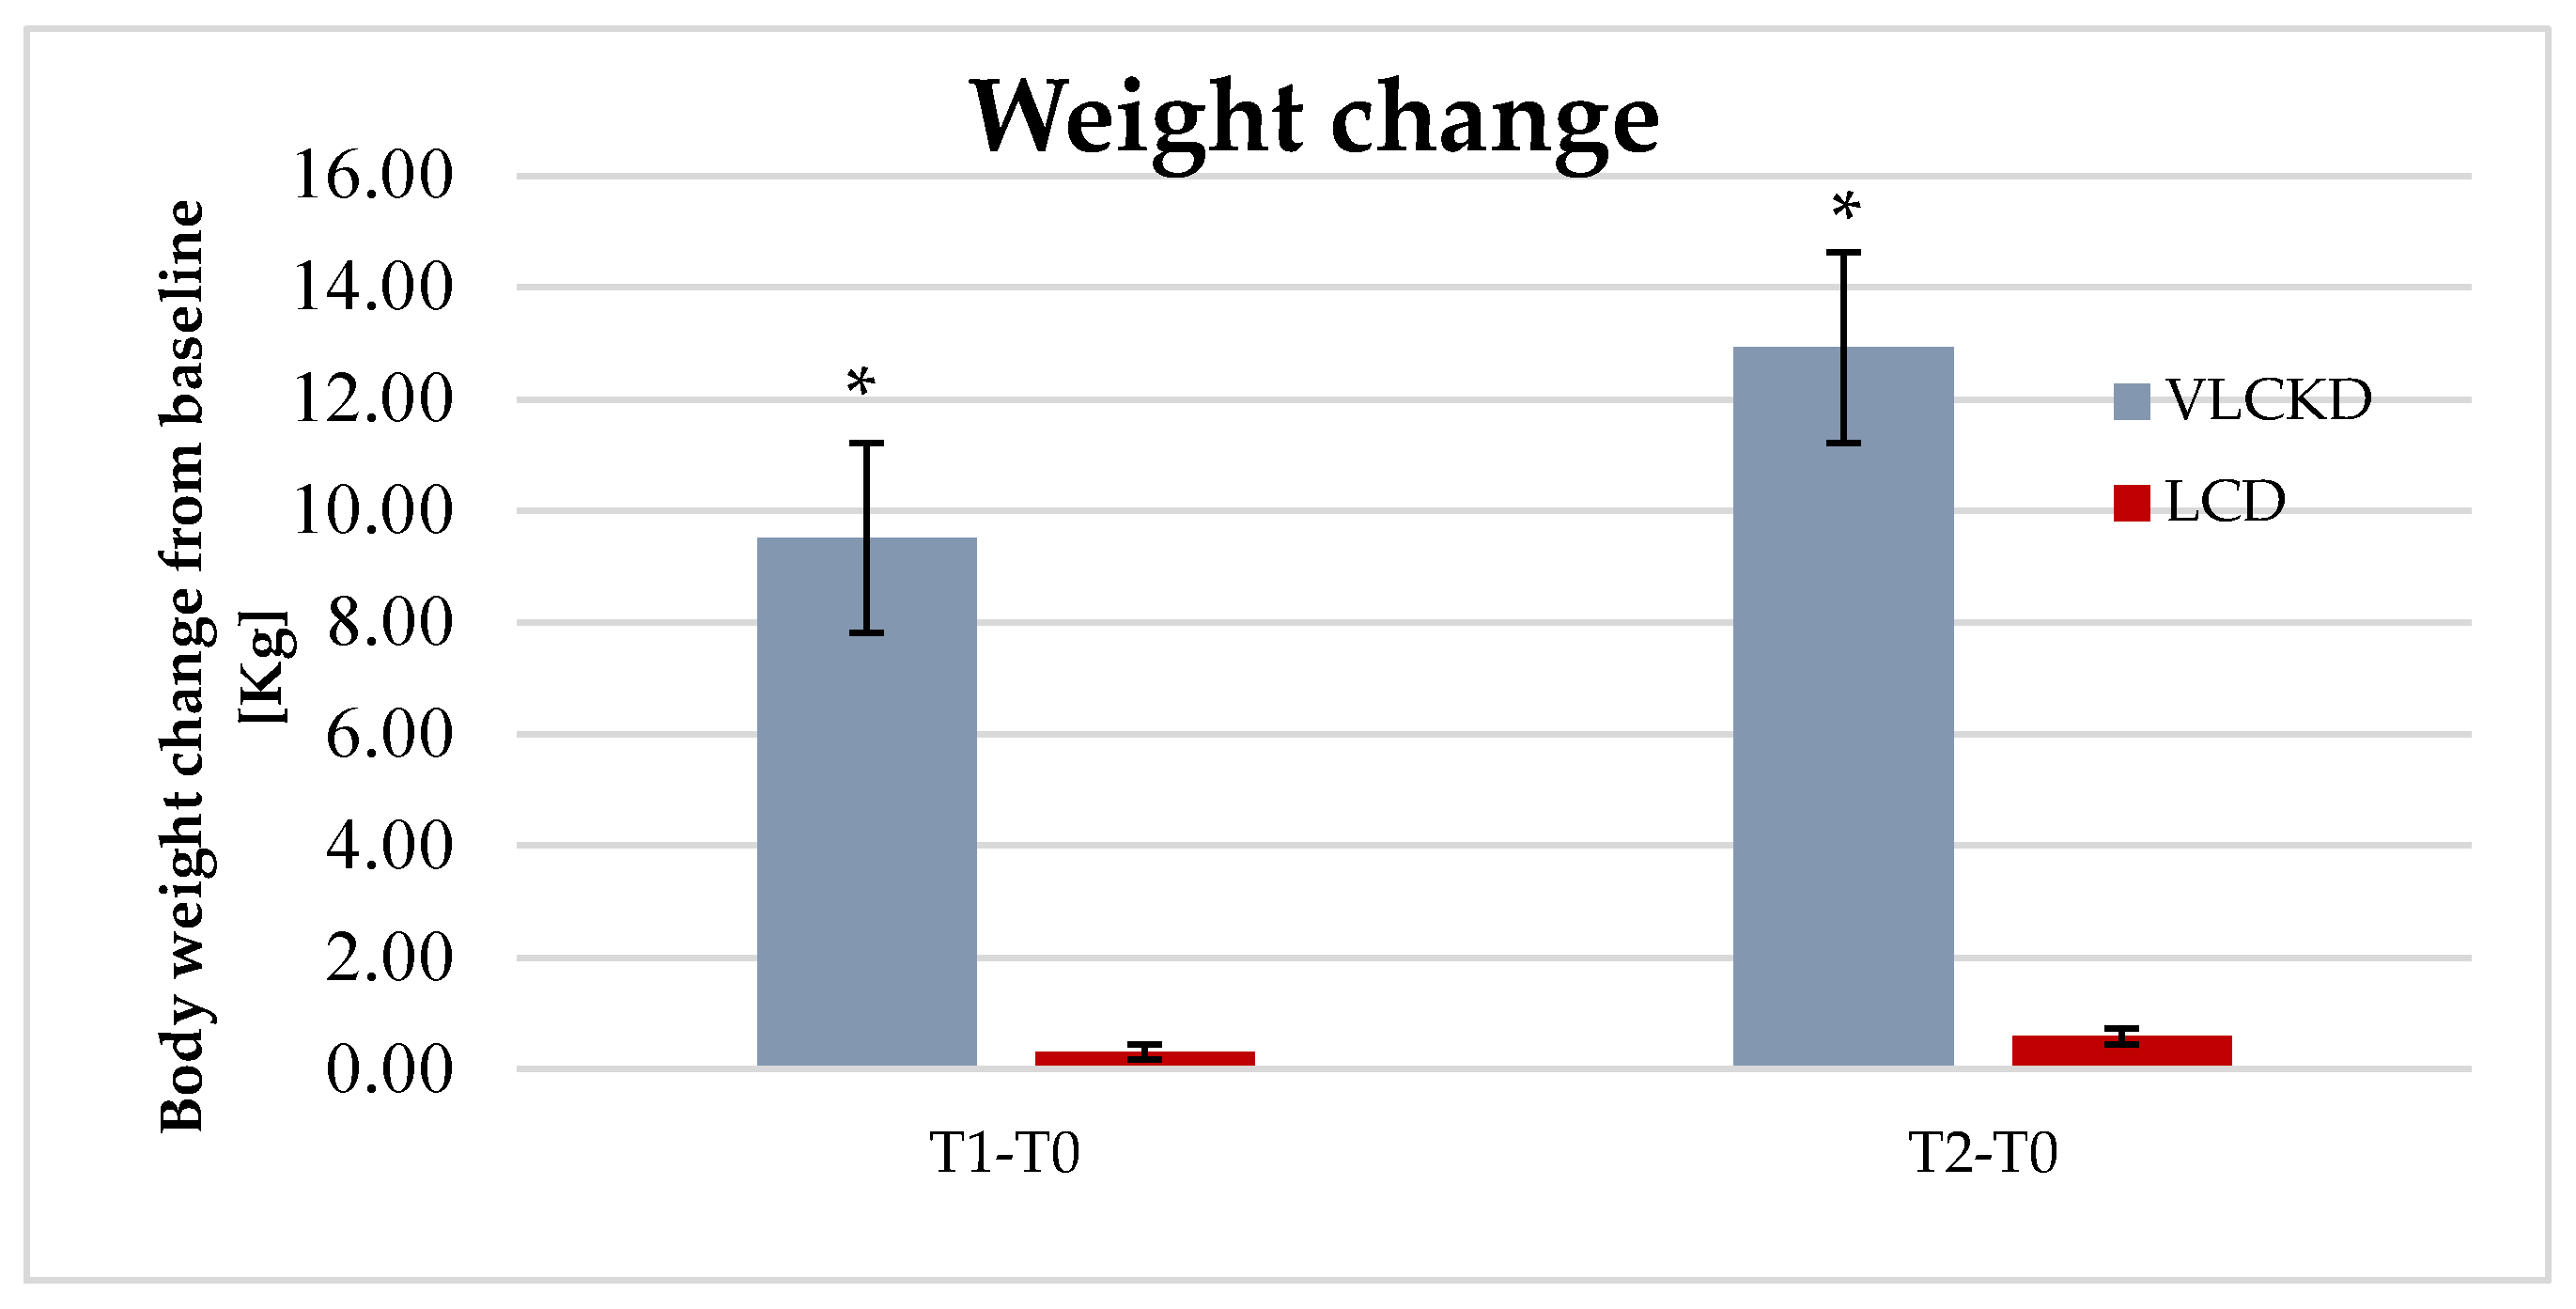
| Weight | 9.51 ± 7.13 | 0.31± 3.08 | 0.000 | 12.93 ± 8.84 | 0.58 ± 4.18 | 0.000 |
| BMI | 3.57 ± 2.16 | 0.41 ± 1.38 | 0.000 | 4.76 ± 2.78 | 0.19 ± 1.53 | 0.000 |
| WHR | 0.01± 0.03 | 0.00± 0.01 | 0.609 | 0.01 ± 0.04 | 0.00 ± 0.02 | 0.638 |
| BPsys | 8.53 ± 7.62 | −2.20 ± 16.81 | 0.032 | 13.73 ± 14.34 | −2.40 ± 10.44 | 0.005 |
| BPdias | 9.33 ± 11.54 | 2.87 ± 9.49 | 0.104 | 9.33 ± 11.54 | −3.80 ± 14.25 | 0.018 |
| HbA1c (%) | 0.69 ± 0.65 | 0.42 ± 1.01 | 0.533 | 0.61± 0.54 | 0.13 ± 0.76 | 0.070 |
| SF-36 | VLCKDT0 | VLCKDT1 | p-Value T0T1 | VLCKDT2 | p-Value T0T2 |
|---|---|---|---|---|---|
| PF | 43.4 ± 14.2 | 56 ± 12.4 | 0.005 | 69.6 ± 9.12 | 0.000 |
| RP | 41.4 ± 14.8 | 61.6 ± 11.7 | 0.000 | 72 ± 5.4 | 0.000 |
| BP | 41.7 ± 14.8 | 59.3 ± 12.7 | 0.001 | 62.8 ± 12.4 | 0.000 |
| GH | 49.9 ± 47.5 | 66 ± 11.7 | 0.000 | 73.6 ± 7.4 | 0.000 |
| VT | 47.5 ± 14.0 | 68.3 ± 11.7 | 0.001 | 68.7 ± 10.6 | 0.001 |
| SF | 45.6 ± 10.7 | 65.7 ± 8.0 | 0.000 | 68.8 ± 10.1 | 0.000 |
| RE | 57.3 ± 9.2 | 69.8 ± 11.4 | 0.005 | 72.2 ± 8.5 | 0.000 |
| MH | 51.6 ± 12.1 | 66.4 ± 12.4 | 0.000 | 70.2 ± 9.7 | 0.002 |
| SF-36 | LCDT0 | LCDT1 | p-Value T0T1 | LCDT2 | p-Value T0T2 |
|---|---|---|---|---|---|
| PF | 59.6 ± 13.3 | 65.4 ± 13.4 | 0.105 | 60.4 ± 11.7 | 0.836 |
| RP | 64.4 ± 11.4 | 65.5 ± 12.6 | 0.079 | 66.8 ± 10.3 | 0.060 |
| BP | 76.5 ± 12.3 | 73.8 ± 12.2 | 0.575 | 72.8 ± 10.7 | 0.400 |
| GH | 75 ± 9.8 | 77.8 ± 10.4 | 0.390 | 73.9 ± 9.7 | 0.663 |
| VT | 51.8 ± 15.2 | 54.6 ± 14.4 | 0.071 | 53.2 ± 14.6 | 0.091 |
| SF | 54.1 ± 10.4 | 62.4 ± 9.2 | 0.034 | 56.6 ± 7.7 | 0.488 |
| RE | 59.6 ± 12.2 | 61.4 ± 11.6 | 0.054 | 61.2 ± 10.0 | 0.308 |
| MH | 61.8 ± 10.8 | 62.4 ± 8.3 | 0.078 | 63.8 ± 8.6 | 0.056 |
| Score T1 | p-Value | Score T2 | p-Value | |||
|---|---|---|---|---|---|---|
| VLCKD | LCD | VLCKD | LCD | |||
| Mean ± DS | 10.3 ± 2.4 | 8.4 ± 2.1 | 0.025 | 9.9 ± 1.9 | 7.8 ± 1.6 | 0.004 |
Publisher’s Note: MDPI stays neutral with regard to jurisdictional claims in published maps and institutional affiliations. |
© 2021 by the authors. Licensee MDPI, Basel, Switzerland. This article is an open access article distributed under the terms and conditions of the Creative Commons Attribution (CC BY) license (http://creativecommons.org/licenses/by/4.0/).
Share and Cite
Moriconi, E.; Camajani, E.; Fabbri, A.; Lenzi, A.; Caprio, M. Very-Low-Calorie Ketogenic Diet as a Safe and Valuable Tool for Long-Term Glycemic Management in Patients with Obesity and Type 2 Diabetes. Nutrients 2021, 13, 758. https://doi.org/10.3390/nu13030758
Moriconi E, Camajani E, Fabbri A, Lenzi A, Caprio M. Very-Low-Calorie Ketogenic Diet as a Safe and Valuable Tool for Long-Term Glycemic Management in Patients with Obesity and Type 2 Diabetes. Nutrients. 2021; 13(3):758. https://doi.org/10.3390/nu13030758
Chicago/Turabian StyleMoriconi, Eleonora, Elisabetta Camajani, Andrea Fabbri, Andrea Lenzi, and Massimiliano Caprio. 2021. "Very-Low-Calorie Ketogenic Diet as a Safe and Valuable Tool for Long-Term Glycemic Management in Patients with Obesity and Type 2 Diabetes" Nutrients 13, no. 3: 758. https://doi.org/10.3390/nu13030758