


Abstract
Aims Impaired fasting glucose (IFG) below the diagnostic threshold for diabetes mellitus (DM) is associated with macrovascular pathology and increased mortality after percutaneous coronary interventions. The study goal was to determine whether pre-operative fasting blood glucose (fB-glu) is associated with an increased mortality after coronary artery bypass grafting (CABG).
Methods and results During 2001–03, 1895 patients underwent primary CABG [clinical DM (CDM) in 440/1895; complete data on fB-glu for n=1375/1455]. Using pre-operative fB-glu, non-diabetics were categorized as having normal fB-glu (<5.6 mmol/L), IFG (5.6≤fB-glu<6.1 mmol/L), or suspected DM (SDM) (≥6.1 mmol/L). fB-glu was normal in 59%. The relative risks of 30 day and 1 year mortality compared with patients with normal fB-glu was 1.7 [95% confidence interval (CI): 0.5–5.5] and 2.9 (CI: 0.8–11.2) with IFG, 2.8 (CI: 1.1–7.2) and 1.9 (CI: 0.5–6.3) with SDM vs. 1.8 (CI: 0.8–4.0) and 1.6 (CI: 0.6–4.3) if CDM, respectively. The receiver operator characteristic area for the continuous variable fB-glu and 1 year mortality was 0.65 (P=0.002).
Conclusion The elevated risk of death after CABG surgery known previously to be associated with CDM seems also to be shared by a group of similar size that includes patients with IFG and undiagnosed DM.
Introduction
The association of diabetes and cardiovascular risk has been revised recently in several aspects. First, the earliest pathological changes are now believed to be macrovascular rather than microvascular,1 and secondly, the incremental risk for cardiovascular and other macrovascular disease has been shown to begin at a level of impaired glucose homeostasis well below the diagnostic threshold for diabetes mellitus (DM).2 The lower blood glucose (B-glu) limit for a non-normal, pre-diabetic state, the so-called impaired fasting blood glucose (IFG), has been revised downward with the realization that pathological changes begin at even lower B-glu levels than previously believed.2
Although the association of DM with increased mortality and morbidity after cardiac surgery is well known, hyperglycaemia has only more recently been associated with increased mortality after acute myocardial infarction; increased mortality, and length of hospital stay in general medical and surgical units; and worsened prognosis after stroke.3–6 Furthermore, recent studies have shown that risk increases at fasting blood glucose (fB-glu) levels well below the diabetic threshold: in intensive care unit (ICU) patients, a direct and proportional correlation was found between death and B-glu>4.4 mmol/L.7 Patients with IFG have a three-fold higher risk of death within a few years after undergoing percutaneous coronary interventions (PCIs).8 An inflection in the receiver operator characteristic (ROC) curve was found at ∼5.6 mmol/L, coinciding well with the WHO lower limit of IFG.2,8 Van den Berghe et al.9 also suggest a lack of evidence for a lower safe B-glu level in intensive care patients treated aggressively with insulin.
In this study, patients undergoing coronary artery bypass grafting (CABG) are classified as normal, as having IFG, or as suspected diabetes mellitus (SDM), all on the basis of a single pre-operative fB-glu value. The short-term risk of death at 30 days and 1 year after surgery was determined for these groups. Mortality for patients with known DM is included for comparison.
Methods
Patients
This retrospective study was approved by the local ethics committee and included all patients that underwent primary isolated CABG surgery (1895 patients) at the Karolinska Hospital, Stockholm, Sweden, during 2001–03 [1895 patients underwent primary CABG; clinical DM (CDM) in 440/1895; complete data on fB-glu for n=1375/1455]. In the final study, n=1815 patients with complete data on fB-glu or with known DM (440 of total 1895) were studied; fB-glu was missing in 80 of the 1455 patients without DM; details discussed subsequently.
Patient characteristics
Data on patient characteristics were abstracted from medical records. Patient characteristics used in this study were age, gender, body mass index (BMI), creatinine clearance (Ccr), year of surgery, left ventricular function (LVF), use of left and right internal mammary artery graft (IMA) and vein graft at the operation, number of distal coronary anastomoses, chronic pulmonary disease, extracardiac arteriopathy, pre-operative neurological dysfunction, critical pre-operative state, unstable angina, recent myocardial infarction, pulmonary hypertension, and emergency surgery.
Definitions
BMI was calculated by dividing weight in kilograms by the square of height in metres. Ccr was calculated using the equation of Cockcroft and Gault: (140−age)×(weight in kg)/[72×(serum creatinine in µmol/L/88.4)] for men. In women the value was multiplied by 0.85.10 Normal renal function was defined as Ccr of ≥90 mL/min. Mild, moderate, and severe renal insufficiency was defined as Ccr 60–90, 30–60, and <30 mL/min, respectively. LVF was assessed by pre-operative contrast ventriculography or echocardiography. LVF was categorized as normal, reduced, or severely reduced according to the assessment of the thoracic surgeon or the physician performing the ventriculography or the echocardiography. Normal LVF was defined as an ejection fraction of >50% on ventriculography or echocardiography, no dilation of the cardiac chambers, and no major wall motion defects. A reduced LVF was defined as an ejection fraction of <50% but >30%. A severely reduced LVF was defined as a markedly dilated ventricle with akinetic or hypokinetic segments or an estimated ejection fraction of <30%. The definition of chronic pulmonary disease, extracardiac arteriopathy, neurological dysfunction, critical pre-operative state, unstable angina, recent myocardial infarction, pulmonary hypertension, emergency surgery, surgery on thoracic aorta, and post-infarct septal rupture are described in detail in an article by Nashef et al.11 European System for Cardiac Operative Risk Evaluation (EuroSCORE) is an empirically derived algorithm based on 17 risk factors and yields the predicted 30 day mortality for an individual patient undergoing cardiac surgery. The admitting physician recorded these 17 parameters pre-operatively and EuroSCORE was calculated in the departmental surgical register according to the web-based algorithm (www.euroscore.org).
Fasting blood glucose
fB-glu values were retrieved manually from patient anaesthesia (paper) records. fB-glu is analysed routinely together with blood gases immediately after placement of the arterial catheter line pre-operatively. Patients had fasted at least 6 h pre-operatively. Of the 1895 CABG patients operated on during 2001–03, 440 (23%) had a previous diagnosis of CDB (Type 1 or 2 DM, with insulin and/or oral anti-diabetes medications). Of the 1455 patients without a diagnosis of DM, 80 (5%) had no valid fB-glu value (2/80 were dead): of these 80 patients, 46 patients were scheduled for surgery in the afternoon and had received a glucose infusion pre-operatively, 22 had missing initial fB-glu value in their hospital records, and 12 patients had missing records. Patients were categorized into four groups according to the WHO recommendations of the fB-glu at the time of surgery: normal fasting glucose (NFG), IFG, SDM, and CDM.2 NFG included patients with fB-glu<5.6 mmol/L, IFG patients with 5.6 mmol/L≤B-glu<6.1 mmol/L, SDM patients were those with B-glu≥6.1 mmol/L, and CDM patients had previously been diagnosed as having DM. SDM and CDM were not combined, as the diagnosis of CDM requires fB-glu measurements of ≥6.1 mmol/L on two separate days. SDM was not followed up for further diagnosis and treatment at the time of this study. fB-glu was recorded for patients with CDM but was not used in the analyses presented and even diabetics with missing fB-glu were included.
Glucose assay
B-glu was analysed using the glucose oxidase and peroxidase method (One Touch® II; LifeScan Inc., USA). Manufacture information: variation coefficient 3.1–3.9% and a correlation coefficient of 0.981 with laboratory assay.
Outcome data
Patient death was updated from the Swedish Population Register as of 1 June 2004. Registration of death is regulated by law in Sweden and is essentially 100% complete for those dying within the country. Calculated 30 day mortality applied to all 1815 patients, but 1 year mortality included only those operated before 2 June 2003 and analysis was performed on this reduced population both including [1521 patients (84%)] and excluding those dying within 30 days after surgery [1485 patients (82%)].
Statistical analysis
Baseline characteristics were compared across categories using analysis of variance for continuous variables and χ2 test for categorical variables. Data are presented as mean±SD unless otherwise noted. Eighteen month Kaplan–Meier survival curves were plotted by fB-glu category and for patients with CDM.12 Early mortality (30 day) for patients with IFG, SDM, and CDM when compared with patients with NFG was analysed by logistic regression. Proportional hazards regression was used in analyses of 1 year mortality.13 These analyses were performed crude and with multivariable adjustment for potential confounding from other patient characteristics. Graphical assessment with log-minus-log survival plots for each category provided evidence against violation of the proportional hazard assumption. The basis for our analyses consisted of simple tables of crude and stratified data. Application of logistic and Cox regression models for our crude data yielded results basically similar to those in the analyses without model assumptions. The linearity assumption was assessed by categorizing each continuous variable into multiple dichotomies of equal units and plotting each variable's coefficient against the midpoint of the variable. Age, BMI, Ccr, and year of surgery were included as continuous variables and in general other variables were dichotomized. For most variables, the dichotomies represented the presence or absence of the characteristic. In the multivariable analyses, all variables listed in Table 1 were considered for inclusion as potential confounding factors. The final model was determined by using a ‘change in point estimate’ strategy. Variables were included in the final models if their inclusion influenced the estimated odds ratio for the respective category by at least 10%. All comparisons were two-tailed, and a P value of ≤0.05 was considered to be statistically significant. SAS statistical software version 8.2 was used for all analyses. ROC analysis was used to plot the sensitivity vs. one-specificity for the dependence of mortality on fB-glu. Only patients with at least 1 year's follow-up were included and CDM patients were excluded.
Results
All patients included in this study had complete data on the variables shown in Table 1. Differences between patient groups were found primarily for BMI, LVF, peripheral vascular disease, neurological dysfunction, EuroSCORE, and critical pre-operative condition.
A total of 107 out of 1815 patients died as of 1 June 2004, of which 41 died within 30 days, and 71 within 1 year of surgery. The Kaplan–Meier plots of crude survival for the four groups (with number of patients followed up at 6, 12, and 18 months; Figure 1) suggest a more pronounced mortality for subjects with fB-glu≥5.6 mmol/L when compared with subjects with normal fB-glu values. Survival for patients with fB-glu≥6.1 mmol/L was consistently inferior to that for patients with NFG, IFG, and CDM. ROC analysis, with fB-glu treated as a continuous variable, further indicates the prognostic value of fB-glu for mortality at 1 year: the area under the ROC curve (excluding CDM patients) was 0.65 (P=0.002; Figure 2).
After multivariable adjustment SDM was associated with an increased mortality within 30 days after surgery when compared with patients with NFG (Table 2). Among patients with IFG there were only four early deaths and the relative risk, although suggesting a possibly increased mortality, was accompanied by a wide confidence interval (RR 1.7; 95% CI 0.5–5.5) and similarly for CDM. Patients with SDM had an increased risk of death (RR 2.8; 95% CI 1.1–7.2). Mortality within 1 year of surgery (Table 2) showed more than doubled mortality for patients with CDM and IFG. Among survivors of 30 days, there were few deaths within 1 year of surgery (Table 2) with only three deaths in the IFG group and eight deaths in DM patients. The results were suggestive of increased mortality after multivariable adjustment in DM as well as in IFG patients.
Discussion
The most conclusive findings of this study are that DM was associated with increased early mortality compared with patients with normal fB-glu and with a tendency towards increased mortality within 1 year among survivors of 30 days. More important, however, is that similar results were obtained for patients with IFG, although based on small numbers. Almost 60% of the patients in this cohort had normal fB-glu (<5.6 mmol/L), and the number of patients at increased risk of short-term death after CABG surgery because of their glycaemic status was two-thirds of those with diagnosed diabetes. Multivariable analysis for potentially confounding factors did not substantially alter the findings.
The findings of this study are very similar to those of Muhlestein et al.8 who found a three-fold increased risk of death within a few years after PCI for patients with IFG. The study of Muhlestein et al.8 and the present study found a similar risk increase after coronary artery interventions in essentially comparable patient groups, but the two studies differ fundamentally in several aspects. First, the surgical trauma and the mechanisms by which glucose homeostasis might affect early post-intervention mortality should not be as relevant after the minimal trauma involved in PCI. Secondly, the coronary artery interventions in the two studies differ fundamentally with different processes and time scales for restenosis. The CABG patients may arguably have a more advanced coronary disease with the observed average of three anastomoses, whereas only 4–10% of the patients in the PCI study had three-vessel disease.8 Thirdly, the post-intervention time period studied is significantly different: Muhlestein et al.8 presented cumulative mortality with an average follow-up of 2.8 years (range 1.5–5.2 years) whereas the present study is a 3 year cohort presented only as 30 day and 1 year mortality (follow-up time range 6 months to 3 years). This short-term follow-up was partly due to the completeness of data on potentially confounding factors, but also to see whether there was a distinct difference between 30 day and 1 year mortality.
The relative impact of glycaemic status on acute peri-operative mortality vs. the longer-term effects of DM as such can be appreciated from the 1 year mortality, excluding those dying within 30 days after surgery. The late mortalities after PCI and CABG should reflect similar mechanisms of mortality and indeed Muhlestein et al.'s Kaplan–Meier plot is qualitatively similar to the results of the present study.8 The mortality rates found here after CABG and non-invasive coronary interventions can be compared to those of the DECODE study which examined a non-diabetic general European population without any known cardiovascular disease.14 Newly diagnosed diabetics had a hazard ratio for death of 1.8, and for IFG the hazard ratios were 1.2 and 1.1 for men and women, respectively.14
The value of fB-glu as a continuous variable for predicting 1 year mortality was examined using ROC analysis. ROC analysis for patients without diagnosed DM in both the present and the PCI study8 show similar results, indicating the prognostic importance of fB-glu. An inflection in the ROC curve corresponding to 5.6 mmol/L was seen in the PCI study, which used a much longer follow-up.8 ROC analysis in the present study included only mortality up to 1 year but showed no obvious inflection point. The lack of a convincing inflection point is consistent with the growing belief that there is no distinct B-glu threshold below which no pathological processes occur.9
Clinical treatment and morbidity/mortality studies, however, are based on categorization of patients as having DM, IFG, or normoglycaemia. As patients who came to CABG with the clinical diagnosis DM had taken their DM medication both before and after surgery but those with SDM had not, these categories were considered separately. fB-glu values were available for most patients with DM, but these will often be falsely low because of residual hypoglycaemic medication effects, and were not used. The categories IFG and SDM are thus clinically important, but rather small (8% each) when trying to compare mortality between groups. Thus, while the Kaplan–Meier survival plot places the four groups in a distinct order of relative risk of death, no definite conclusions can be drawn when comparing the relative mortality increases among these non-normal groups at either 30 days or 1 year. However, if fB-glu is a risk factor per se then the diagnosed and SDM groups would be expected to have higher mortalities than the IFG group. The observation that untreated, suspected diabetics have lower survival than treated diabetics, as the Kaplan–Meier plot suggests, is reasonable but cannot be statistically verified by the categorical analysis.
The use of a single pre-operative fB-glu to categorize patients may be criticized as being neither representative because of pre-operative stress nor sufficient for making the diagnosis of DM or IFG. Taking two fB-glu measurements on consecutive days would have allowed making clinical diagnoses of previously undetected DM or IFG, and could have strengthened the observed associations. The percentages of patients with fB-glu consistent with undiagnosed diabetes and IFG found in this study are, however, similar to findings from most other studies of patients with cardiovascular disease.15 The Muhlestein et al.8 study found a remarkably high incidence of unknown DM and IFG: 19% IFG, 18% undiagnosed DM, and 24% diagnosed DM. These studies suggest that stress-induced hyperglycaemia has not exaggerated the number of patients with FBG in the present study. If stress hyperglycaemia had occurred, then the threshold for increased risk for a true fB-glu should be even <5.6 mmol/L.
Impaired glucose tolerance (IGT) detected after glucose provocation is a more sensitive predictor of diabetes, cardiovascular mortality, and total mortality than IFG.16 In 1997, however, the American Diabetes Association recommended the abandonment of the oral glucose tolerance test as being too expensive, too inconvenient, and too variable when compared with fB-glu.17 Judging by the DECODE study, IGT would reasonably be expected to be superior to fB-glu in predicting mortality after CABG.14 The Expert Committee on Diagnosis of DM in the USA has officially considered a lowering of the fB-glu threshold to 5.1 mmol/L to correspond more to the detection frequency of IGT.16
This study cannot help to establish a causal relationship between blood glucose concentration and increased post-operative mortality. It does not even sharply distinguish surgically related mortality at 30 days from the relatively short-term mortality after 1 year. Short-term mortality could be due to the association between hyperglycaemia and impaired neutrophil chemotaxis, oxidative burst, phagocytosis, and superoxide production.18,19 Even short episodes of hyperglycaemia decrease leucocyte phagocytic activity.20
Patients with DM are known to have about double the post-operative mortality of those without DM.21 Most published mortality rates for patients with DM are falsely low as deaths of those with undiagnosed DM are statistically counted among the non-diabetics. Later deaths are likely to be related to the progression of DM as a multi-organ disease. Some would argue that increased non-esterified fatty acids, which may precede hyperglycaemia in the metabolic derangement process, are a more likely culprit behind the association of mortality and fB-glu. Furthermore, one cannot assume that by pharmacologically normalizing B-glu in either the IFG or SDM groups that their mortality would be reduced to that of those with normoglycaemia. True randomized interventional studies are few. Van den Berghe et al.9 have most convincingly shown that maintaining normoglycaemia with insulin drastically reduced mortality in patients requiring prolonged intensive care after (mostly) cardiac surgery. Similarly, a randomized interventional study of diabetic myocardial infarction patients showed that long-term survival improved by 28% at 3.4 years with aggressive in-hospital insulin treatment.22
In conclusion, the elevated risk of death after CABG surgery known previously to be associated with CDM seems also to be shared by a group of similar size that includes patients with IFG and undiagnosed DM. The mechanisms and causality in this relationship remain unclear, as is the question of whether pharmacological normalization of glucose homeostasis would normalize post-operative risk.
Acknowledgement
Sincere thanks are due to Cecile Everett for her assistance in data retrieval and management.
![Figure 1 Kaplan–Meier survival curves of crude survival after primary CABG surgery for 1815 patients operated during 2001–03 and categorized according to fB-glu [NFG<5.6 mmol/L, IFG (5.6≤fB-glu<6.1 mmol/L), SDM≥6.1 mmol/L, and CDB].](https://oup.silverchair-cdn.com/oup/backfile/Content_public/Journal/eurheartj/26/15/10.1093_eurheartj_ehi182/3/m_ehi18201.jpeg?Expires=1716464428&Signature=21Ip8JmCroXiL5IG7pmc7fAqq8Drd6nzyN03B9b4daDInQmNZt-jVffdvMOdkEV8x31mzftoOFk9mRJhp-Pc41zlsbeN6MuV8Kr86gST1~Gbn-ZAnH77K09aAAbqAoPLOp7iZBeoLAv4t9LR99c9XXc~hMyiGFc0sQ9NUuL46aVHtUXiztNIECZDSXFYEv8WAx4sQ7T3YixzL2J0LBj2ufZg~4TkpTVxTHwx~JsN3BIaVwWGPGleBxdDQabRzD1~LTwTk786b8qqI-PwJr0CrIqa4GgpDpmlUGOV3vhDImvt7XK-BFZpEbp-tZxBZpxi28HI3ScZuPMjoRkdwR9qUQ__&Key-Pair-Id=APKAIE5G5CRDK6RD3PGA)
Figure 1 Kaplan–Meier survival curves of crude survival after primary CABG surgery for 1815 patients operated during 2001–03 and categorized according to fB-glu [NFG<5.6 mmol/L, IFG (5.6≤fB-glu<6.1 mmol/L), SDM≥6.1 mmol/L, and CDB].
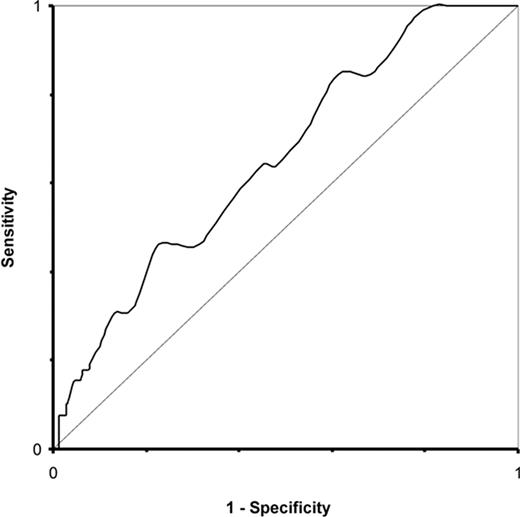
Figure 2 ROC analysis of sensitivity and one-specificity for the dependence of total mortality within 1 year after CABG surgery on fB-glu as a continuous variable (excluding patients with known DB; n=1161; area=0.65, P=0.002).
Baseline characteristics of 1815 patients with different pre-operative fB-glu levels undergoing CABG surgery during 2001–03
| Category | P-value | ||||
|---|---|---|---|---|---|
| Normal fB-glu | Impaired fB-glu | Suspect DM | Clinical DM | ||
| Number of subjects (%) | 1070 (59) | 152 (8) | 153 (8) | 440 (24) | — |
| Male gender (%) | 852 (80) | 123 (81) | 112 (73) | 327 (74) | 0.05 |
| Age (years) | 66±10 | 66±10 | 65±11 | 65±9 | 0.75 |
| BMI | 26±4 | 27±4 | 27±4 | 28±4 | ≤0.0001 |
| Ccr (mL/min) | 83±27 | 82±25 | 79±28 | 85±34 | 0.29 |
| ≥90 (%) | 375 (35) | 56 (37) | 42 (27) | 181 (41) | |
| 60–90 (%) | 475 (44) | 65 (43) | 74 (48) | 151 (34) | |
| 30–60 (%) | 208 (19) | 31 (20) | 36 (24) | 97 (22) | 0.003 |
| <30 (%) | 12 (1) | 0 (0) | 1 (1) | 11 (3) | |
| Left ventricular ejection fraction | |||||
| Normal LVEF(>50%) | 752 (70) | 101 (66) | 96 (63) | 244 (55) | |
| Reduced LVEF (30–50%) | 260 (24) | 42 (28) | 41 (27) | 145 (33) | ≤0.0001 |
| Severely reduced LVEF (<30%) | 58 (5) | 9 (6) | 16 (10) | 51 (12) | |
| Internal mammary artery (%) | 1046 (98) | 141 (93) | 144 (94) | 419 (95) | 0.053 |
| Number of distal coronary | 3.1±1.0 | 3.0±1.0 | 3.1±0.9 | 3.2±1.0 | 0.42 |
| EuroSCORE | 3.7±2.8 | 3.8±2.8 | 4.2±3.3 | 4.3±3.0 | 0.0008 |
| Chronic pulmonary disease (%) | 46 (4) | 3 (2) | 6 (4) | 20 (5) | 0.56 |
| Peripheral vascular disease (%) | 76 (7) | 15 (10) | 17 (11) | 68 (15) | ≤0.0001 |
| Neurological dysfunction (%) | 9 (1) | 0 (0) | 1 (1) | 17 (4) | 0.0002 |
| Critical pre-operative state (%) | 5 (0) | 0 (0) | 4 (3) | 3 (1) | 0.041 |
| Unstable angina (%) | 148 (14) | 20 (13) | 20 (13) | 59 (13) | 0.99 |
| Recent myocardial infarction (%) | 282 (26) | 44 (29) | 47 (31) | 145 (33) | 0.07 |
| Pulmonary hypertension | 5 (0) | 1 (1) | 0 (0) | 3 (1) | 0.70 |
| Emergency surgery (%) | 40 (4) | 3 (2) | 9 (6) | 19 (4) | 0.34 |
| Follow-up (days) | 720±321 | 655±327 | 616±337 | 664±337 | ≤0.0001 |
| All mortality during follow-up (%) | 43 (4) | 11 (7) | 15 (10) | 38 (9) | 0.0006 |
Relative risk of death after CABG surgery for patients with different pre-operative fB-glu levels or CDM
| Category | No. of patients | No. of deaths | % | Crude | Adjusted | ||
|---|---|---|---|---|---|---|---|
| RR | 95% CI | RR | 95% CI | ||||
| 30 day mortality (n=1815)a | |||||||
| NFG | 1070 | 14 | 1.3 | 1.0 | 1.0 | ||
| IFG | 152 | 4 | 2.6 | 2.0 | 0.7–6.3 | 1.7 | 0.5–5.5 |
| SDM | 153 | 8 | 5.2 | 4.2 | 1.7–10.1 | 2.8 | 1.1–7.2 |
| CDM | 440 | 15 | 3.4 | 2.7 | 1.3–5.6 | 1.8 | 0.8–4.0 |
| Cumulative 1 year mortality (n=1521)b | |||||||
| NFG | 916 | 23 | 2.5 | 1.0 | 1.0 | ||
| IFG | 123 | 7 | 5.7 | 2.3 | 1.0–5.4 | 2.3 | 1.0–5.4 |
| SDM | 122 | 9 | 7.4 | 3.0 | 1.4–6.5 | 2.0 | 0.9–4.5 |
| CDM | 360 | 22 | 6.1 | 2.5 | 1.4–4.4 | 2.2 | 1.2–4.1 |
| 1 year mortality excl. 30 days (n=1485)c | |||||||
| NFG | 903 | 10 | 1.1 | 1.0 | 1.0 | ||
| IFG | 119 | 3 | 2.4 | 2.3 | 0.6–8.4 | 2.9 | 0.8–11.2 |
| SDM | 117 | 4 | 3.3 | 3.1 | 1.0–9.8 | 1.9 | 0.5–6.3 |
| CDM | 346 | 8 | 2.2 | 2.1 | 0.8–5.3 | 1.6 | 0.6–4.3 |
aBy category logistic regression for age, Ccr, BMI, and LVEF.
bBy category Cox regression for age, LVF, and acute surgery.
cBy category Cox regression for age, BMI, LVF, Ccr, acute surgery unstable angina, and year of surgery.
References
Zimmet PZ. The changing face of macrovascular disease in non-insulin-dependent diabetes mellitus: an epidemic in progress.
Unwin H, Shaw J, Zimmet P et al. Impaired glucose tolerance and impaired fasting glycaemia: the current status on definition and intervention.
Thourani VH, Weintraub WS, Stein B et al. Influence of diabetes mellitus on early and late outcomes after coronary artery bypass grafting.
Capes SE, Hunt D, Malmberg K et al. Stress hyperglycaemia and increased risk of death after myocardial infarction in patients with and without diabetes: a systematic overview.
Umpierrez GE, Isaacs SD, Bazargan N et al. Hyperglycemia: an independent marker of in-hospital mortality in patients with undiagnosed diabetes.
Capes SE, Hunt D, Malmberg K et al. Stress hyperglycemia and prognosis of stroke in nondiabetic and diabetic patients: a systematic overview.
Krinsley JS. Association between hyperglycemia and increased hospital mortality in a heterogeneous population of critically ill patients.
Muhlestein JB, Anderson JI, Horne BD et al. Effect of fasting glucose levels on mortality rate in patients with and without diabetes mellitus and coronary artery disease undergoing percutaneous coronary intervention.
Van den Berghe G, Wouters P, Weekers F et al. Intensive insulin therapy in critically ill patients.
Cockcroft DW, Gault MH. Prediction of creatinine clearance from serum creatinine.
Nashef S, Roques F, Hammill B et al. Validation of European System for Cardiac Operative Risk Evaluation (EuroSCORE) in North American cardiac surgery.
Kaplan EL, Meier P. Nonparametric estimation from incomplete observations.
The DECODE study group on behalf of the European Diabetes Epidemiology Group. Diabetes Epidemiology: Collaborative analysis of Diagnostic criteria in Europe.
Norhammar A, Tenerz A, Nilsson G et al. Glucose metabolism in patients with acute myocardial infarction and no previous diagnosis of diabetes mellitus: a prospective study.
The Expert Committee on the Diagnosis and Classification of Diabetes Mellitus. Follow-up report on the diagnosis of diabetes mellitus.
Report of the Expert Committee on the Diagnosis and Classification of Diabetes Mellitus.
Delamaire M, Maugendre D, Moreno M. Impaired leucocyte functions in diabetic patients.
Perner A, Nielsen SE, Rask-Madsen J. High glucose impairs superoxide production from isolated blood neutrophils.
Kjersem H, Hilsted J, Madsbad S et al. Polymorphonuclear leucocyte dysfunction during short term metabolic changes from normo- to hyper-glycemia in type 1 diabetic patients.
Thourani VH, Weintraub WS, Stein B et al. Influence of diabetes mellitus on early and late outcome after coronary artery bypass grafting.
Malmberg K, Norhammar A, Wedel H et al. Glycometabolic state at admission: important risk marker of mortality in conventionally treated patients with diabetes mellitus and acute myocardial infarction: long-term results from the Diabetes and Insulin-Glucose Infusion in Acute Myocardial Infarction (DIGAMI) study.

