Article Text

Abstract
Background Coronary angioscopy (CAS) is a useful modality to assess atherosclerotic changes, but interpretation of the images requires expert knowledge. Deep convolutional neural networks (DCNN) can be used for diagnostic prediction and image synthesis.
Methods 107 images from 47 patients, who underwent CAS in our hospital between 2014 and 2017, and 864 images, selected from 142 MEDLINE-indexed articles published between 2000 and 2019, were analysed. First, we developed a prediction model for the angioscopic findings. Next, we made a generative adversarial networks (GAN) model to simulate the CAS images. Finally, we tried to control the output images according to the angioscopic findings with conditional GAN architecture.
Results For both yellow colour (YC) grade and neointimal coverage (NC) grade, we could observe strong correlations between the true grades and the predicted values (YC grade, average r=0.80±0.02, p<0.001; NC grade, average r=0.73±0.02, p<0.001). The binary classification model for the red thrombus yielded 0.71±0.03 F1-score and the area under the receiver operator characteristic curve was 0.91±0.02. The standard GAN model could generate realistic CAS images (average Inception score=3.57±0.06). GAN-based data augmentation improved the performance of the prediction models. In the conditional GAN model, there were significant correlations between given values and the expert’s diagnosis in YC grade but not in NC grade.
Conclusion DCNN is useful in both predictive and generative modelling that can help develop the diagnostic support system for CAS.
- coronary artery disease
- imaging and diagnostics
- coronary angioscopy
This is an open access article distributed in accordance with the Creative Commons Attribution Non Commercial (CC BY-NC 4.0) license, which permits others to distribute, remix, adapt, build upon this work non-commercially, and license their derivative works on different terms, provided the original work is properly cited, appropriate credit is given, any changes made indicated, and the use is non-commercial. See: http://creativecommons.org/licenses/by-nc/4.0/.
Statistics from Altmetric.com
Key messages
What is already known about this subject?
Deep convolutional neural networks (DCNN) has been used for automatic prediction in diagnostic imaging, such as echocardiography and cardiac scintigraphy. It is reported that DCNN can be also useful in the medical image synthesis for educational purposes.
What does this study add?
We first showed that DCNN is useful for developing the automatic image prediction model in coronary angioscopy (CAS) and the performance might be superior to the support vector machine model. In addition, we showed the potential of DCNN to generate realistic CAS images using generative adversarial networks.
How might this impact on clinical practice?
Our prediction model can help physicians to interpret CAS images and might be useful for the screening. Generative modelling can serve as a medical image simulation, which might be useful for educational purposes.
Introduction
Coronary angioscopy (CAS) is a unique imaging device which enables direct visualisation of the vessel lumen and provides comprehensive information about atherosclerotic changes.1 2 It has been reported that CAS has a higher ability to detect neointimal vulnerability after stent implantation than other modalities.3 However, this procedure requires expert knowledge for interpretation and is therefore not common to general cardiologists.
Currently, there is an increasing number of studies about the application of artificial intelligence in the field of cardiology.4 5 In particular, deep convolutional neural networks (DCNN) have become popular in medical image analysis6 7 and its application is extended to the generative tasks such as generative adversarial networks (GAN).8 Considering its ability of feature abstraction, we think DCNN can be used for the automated interpretation of CAS images and enhance the outreach of this procedure. In this study, we aimed (1) to develop a data-driven prediction model for CAS findings as a diagnostic support system and (2) to synthesise realistic CAS images for educational purposes using GAN, that may in turn improve the performance of diagnostic system. Additionally, we demonstrated the outcome of conditional image synthesis according to the CAS findings.
Methods
Image acquisition from patients
We retrospectively assessed 107 consecutive lesions after stent implantation using CAS for 47 patients who had undergone PCI between February 2014 and October 2017 at Ehime Prefectural Imabari Hospital. Detailed patient characteristics are indicated in online supplementary table S1. Catheterisation was performed with a radial, brachial or femoral approach using ≥6 F guiding catheters. CAS was performed with the FT-203F (FiberTech, Tokyo, Japan) non-obstructive coronary angioscope system and the VISIBLE (FiberTech) optical fibre as previously reported.9
Supplemental material
Evaluation of the angioscopy
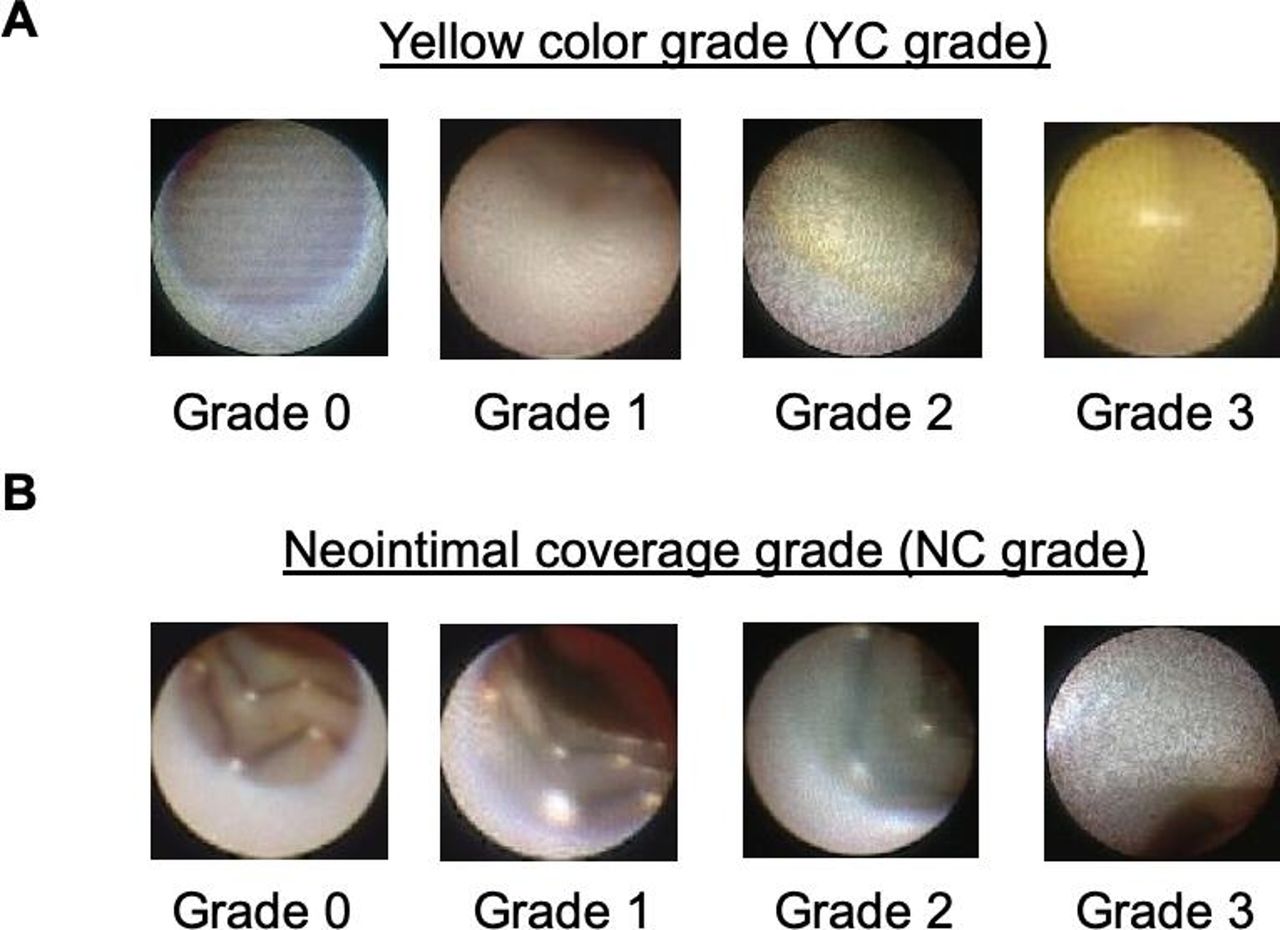
Each CAS analysis was performed as agreed by two independent cardiologists. Neointimal coverage (NC) grade was evaluated using a 4-point grading scale, from 0 (no coverage) to 3 (complete coverage). Plaque yellow colour (YC) was assessed using a 4-grade system, from 0 (white) to 3 (bright yellow). The presence of red thrombus was also assessed as previously described.10 Representative CAS images for each grade are shown in figure 1.

Definitions of CAS findings. (A) Shows the representative images for each YC grades. (B) Is for the NC grades. All shown images are converted to 96×96 pixels. CAS, coronary angioscopy.
Additional image collection from MEDLINE-indexed articles
In order to address the class imbalance problem, we additionally collected angioscopic images using PubMed search. We used the keyword ‘coronary’ and ‘angioscopy’ to search articles written in English published between April 2000 and April 2019. This initial search yielded 507 records. After manually excluding the articles which do not include any coronary angioscopic image, 142 articles met the criteria (see online supplementary table S2). In each article, pictures with excessive modifications or annotations (eg, lines and arrows) were excluded from the analysis. Duplicate images were also excluded. If the diagnosis for the image is provided in the literature, we adopted it as a true label. Otherwise, image-level diagnosis was de novo made by cardiologists as above described. Since not all pictures were obtained from the stent implanted site, the NC grades were uniformly defined as three when stent struts were not observed. In order to get the perspective on the collected images, principal component analysis (PCA) was used for the data visualisation (see online supplementary figure S3).
Image data preprocessing
All collected images were converted to the Joint Photographic Experts Group format with 24-bit colour data and resized to 96×96 pixel size with the image processing tool of Python interpreter (Pillow; Alex Clark and Contributors). In reference to the previous report,11 we employed geometric data augmentation; rotation with four different angles. For the appropriate cross-validation, training and test datasets were properly separated, so as not to share the same image source.
Structure of the prediction models
We designed a simple 4-layer DCNN model which can be universally used for the assessment of YC grade, NC grade and red thrombus. Mean squared error as used as a loss function for the regression tasks (predicting the grade scores). For the binary classification, we set sigmoid function as the final activation function and used binary cross entropy as a loss function. Adaptive moment estimation as used in the all prediction models as an optimisation algorithm.
For the sake of comparison, we assessed the performance of other machine learning algorithms; support vector machine (SVM) implementation in scikit-learn (a python library) was used for both regression task and classification task. Before the model training, the dimensionality of the image data was reduced to 100 components by PCA. We used default parameters of the scikit-learn for simplicity.
Structure of the GAN models
We designed a standard deep convolutional GAN and a conditional GAN model, according to the original articles.12 13 Figure 2 shows the schematic representation of the conditional GAN model in this study. All CAS findings were used as the conditioning information to train the model. For the standardisation, YC and NC grades were divided by three to be ranged between 0 and 1. The conditioning vector was concatenated with a Gaussian noise and passed to the generator network. For the discriminator network, conditions were combined with the image data as input and also passed to the fully connected layer.

Schematic representation of the conditional GAN model. CAS findings are converted to condition vector and passed to both generator and discriminator networks. CAS, coronary angioscopy; GAN, generative adversarial network; NC, neointimal coverage; YC, yellow colour; RGB, Red-green-blue color values.
Evaluation method for the performance of GAN models
For the standard GAN model, Inception scores were calculated for a randomly selected 1000 images from the original data and for the 1000 generated images, respectively. We employed a blinded visual scoring system for the evaluation of the conditional GAN model. Two experts were asked to grade the generated pictures without any information about the given conditions. Per each grade, 12 images were generated by the conditional GAN. These blinded scores were compared with the given conditions and the correlation coefficient was calculated.
Method for the GAN-based data augmentation
In order to test the capability of GAN-based image synthesis as a data augmentation method, we split the dataset differently from the previous experiment. Namely, images from our hospital were used as a fixed validation dataset (n=107) and the prediction model was trained on the online-collected images (n=864) or on the augmented dataset where the original images were combined with the same number of synthesised images (n=1728). To see the pure effect of this augmentation method, no geometrical transformation was conducted for this experiment. The standard GAN was trained only on the online-collected images to prevent the possible overfitting phenomenon. Model training was repeated five times with different random seeds and the mean performance indices were calculated.
Statistical analysis
Data are presented as mean±SE. Fivefold cross-validation was used to evaluate prediction models. For the assessment of regression models, we employed Pearson’s correlation coefficient (r value) and mean absolute error (MAE) as indicators of the model performance. R values higher than 0.7 were considered to show strong positive linear relationships. For the binary classification task, we used precision, recall, specificity, negative predictive value and F1-scores as indicators. Receiver operator characteristics (ROC) curve and the area under the curve (AUC) were also analysed. P values less than 0.05 were regarded as statistically significant. All analyses were performed using SciPy module in the python library.
Results
Characteristics of the articles in the PubMed search
A total 864 different angioscopic images were obtained from 142 articles (see online supplementary table S2). Among these 142 articles, 82 (57.7%) were original articles and 44 (30.9%) were case reports. Twelve review articles, two letters a rapid communication and an editorial article were also included. Among them, 89 (62.7%) articles provide images of stented lesions, and the rest were about de novo lesions. On average, seven pictures were available from an original article and 4.4 pictures from a case report. Circulation Journal (29 articles, 20.4%), JACC Cardiovascular Intervention (16 articles, 11.3%) and International Journal of Cardiology (nine articles, 6.3%) were the top three most frequently found journals through the online search.
Distributions of CAS findings
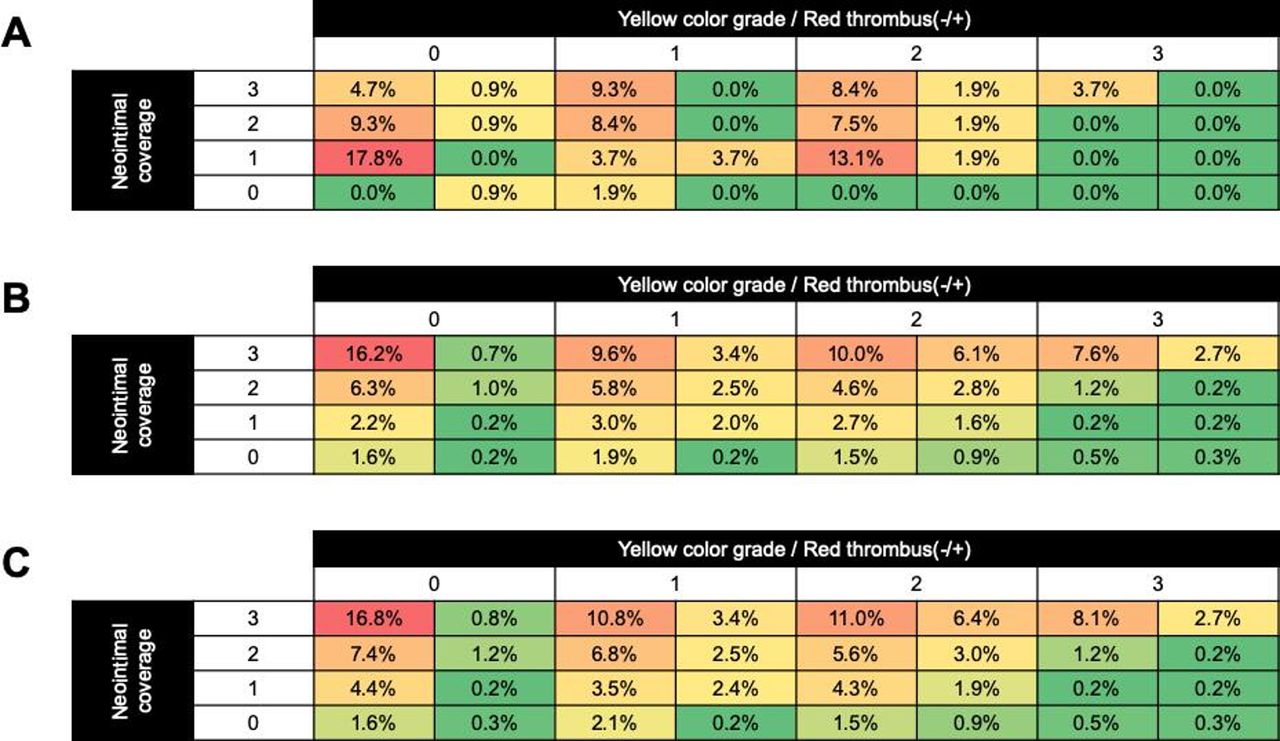
In our hospital data, the most frequently observed finding was YC grade 0, NC grade 1 without any thrombus (17.8% of the total 107 images). YC grade 3 was not observed except in NC grade 3 without thrombus. Red thrombi were most frequently observed in YC grade 1, NC grade 1 area (figure 3A). On the other hand, YC grade 0, NC grade 1 is the most frequent finding among the images collected through PubMed search (16.2% of the total 864 images). (figure 3B). On the whole, lower NC grades were more frequently found in the published articles’ pictures. Distribution in the mixed data is shown in figure 3C.
Diagnostic prediction model for the angioscopic findings with DCNN
In both the YC grade and NC grade prediction model, we observed strong and significant correlations between the true grades and the predicted values (YC grade, average r=0.80±0.02, p=<0.001, average MAE=0.16±0.01; NC grade, average r=0.73±0.02, p<0.001, average MAE=0.17±0.01). Representative box-whisker plots are shown in figure 4. The binary classification model for the red thrombus achieved 0.87±0.04 in precision, 0.62±0.06 in recall, resulting in 0.71±0.03 F1-score. The specificity was 0.96±0.01 and the negative predictive value was 0.89±0.01. Average AUC was 0.91±0.02, calculated from ROC curves of fivefold cross validation (see online supplementary figure S1).
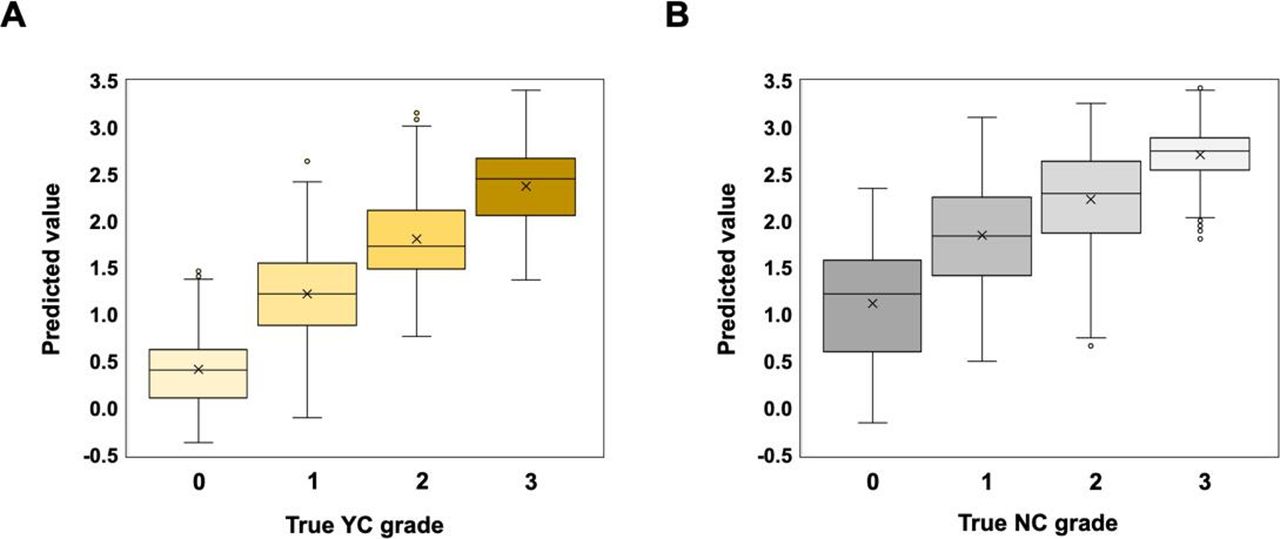
Representative box-whisker plots from the fivefold cross-validation. The data distribution of the predicted values according to the true values were visualised for yellow grade score (A) and neointimal coverage score (B). NC, neointimal coverage; YC, yellow colour.

Heatmaps for the distribution of the angioscopic findings. The percentage of the population with the specific finding was shown for the images obtained from our hospital (A), PubMed search (B) and in the merged dataset (C). In each area of the matrix, the right-sided cell indicates the population with red thrombus. Cells with higher percentage were highlighted with red background colour as a heatmap (colours are assigned independently for each panel).
On the other hand, the support vector regression models yielded 0.74±0.02 in r value for YC grades and 0.50±0.03 in r value for NC grades, the latter was significantly lower than the performance of DCNN (p=0.0011). The support vector classification model showed 0.74±0.02 in ROC AUC for thrombus detection. Comparison results were summarised in table 1.
Comparison of the model performance between DCNN and SVM
Synthesised CAS images by the GAN models
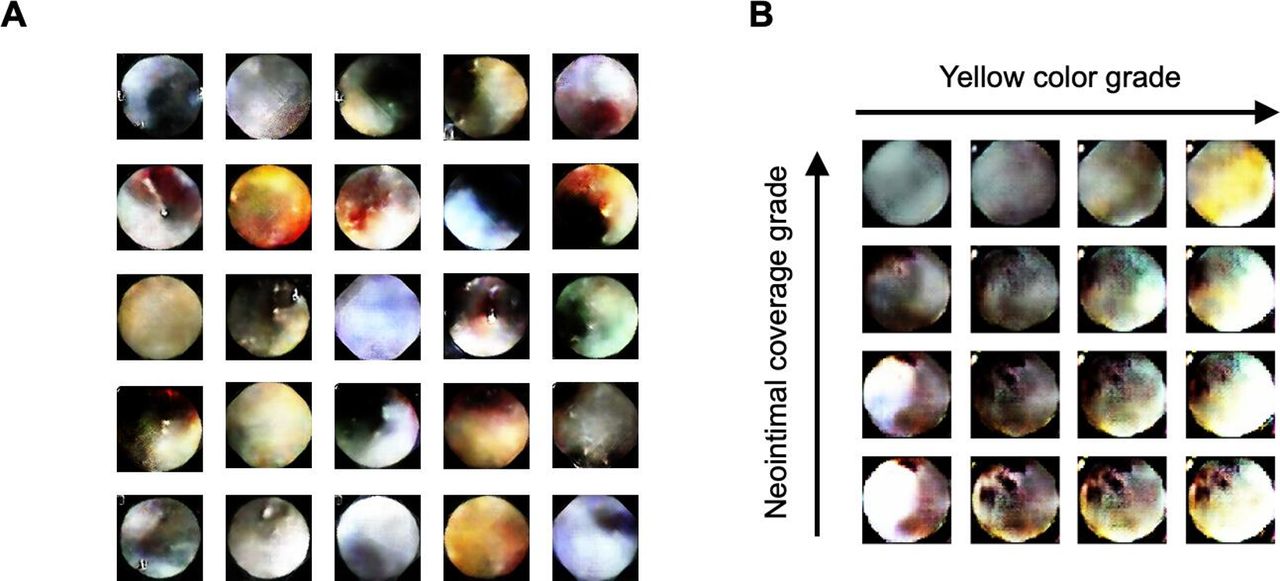
The standard GAN model generated a variety of angioscopic images (figure 5A) with the average Inception score of 3.57±0.06. Images were visually realistic allowing us to do the annotation, but the score was significantly lower than the original dataset (3.90±0.01, p<0.01).
Representative output images. (A) Shows representative output images of the standard GAN model. (B) Longitudinal axis corresponds to the gradual change of neointima coverage grade and the horizontal axis indicates the grade of yellow colour. The thrombus conditions were randomly assigned. GAN, generative adversarial network.
Incremental effect of GAN-based data augmentation on the prediction model
The baseline performance of the regression model and the effect of GAN-base data augmentation are shown in table 2. Data augmentation achieved 37.0% increase in the correlation coefficient and reduced 14% in the MAE for the NC grade prediction. In contrast, this method did not significantly affect the performance of YC grade prediction.
Effect of GAN-based data augmentation on the regression tasks
In the binary classification for the red thrombus, the data augmentation increased 57.9% in F1-score and 5.2% in AUC, owing mainly to the substantial increase of the sensitivity as shown in table 3.
Effect of GAN-based data augmentation on the binary classification task
Performance of the conditional GAN model
Using the conditional GAN architecture, we could control the output images by giving the conditions as shown in figure 5B. There were significant and strong correlations between given conditions and experts’ score in YC grades (r=0.84, p<0.001) and the interobserver agreement for the grading was r=0.67 (p<0.001). However, we did not reach agreement on the NC grades in synthesised images (r=−0.31, p=0.011), and there was only a weak correlation between the given conditions and average score (r=0.42, p<0.001).
Discussion
CAS is a useful device which allows for the direct visualisation of the internal surface of the lumen, providing information about the characteristics of the plaque and thrombus. Previously, we presented evidence that some CAS findings correspond to pathological change14 and provide an explanation for the other imaging modalities such as optical coherence tomography.2 Angioscopy is also a useful tool to follow up on stent implanted lesions.15 However, due to the limited medical resources, CAS usage is mostly limited for research purposes. Therefore, we believe diagnostic support systems or simulation systems could be beneficial for general cardiologists.
Along with the recent advancement in machine learning algorithms, there are an increasing number of reports concerning the application of artificial neural networks in diagnostic imaging.16 In particular, deep generative modelling has emerged as an effective approach to simulate the complex data structure of medical images.17–20 We recently reported that the deep convolutional encoder–decoder model can be used to reconstruct the apical two-chamber view in an echocardiogram.21 Considering the DCNN's ability to expand the potential of diagnostic modalities, we thought that such technologies can be also applicable to broaden the usage of CAS. In this study, we demonstrated the utility of DCNN for the interpretation of CAS views through both prediction tasks and generative modelling.
To begin with, we evaluated the performance of diagnostic prediction models. As previously discussed, one of the principal problems of deep learning in the health science field is the paucity of large training datasets.22 In order to address this issue, we used the MEDLINE database to collect angioscopic images. Because the distribution patterns of the CAS findings were different between the hospital data and literature data, the model’s generalisation capacity was expected to increase when the datasets were combined. As a result, the trained models could achieve acceptable performance in YC grade and NC grade prediction. Especially, DCNN model showed significantly higher predictive performance in NC grade compared with SVM model with dimensionality reduction. However, the sensitivity in the red thrombus detection model remained relatively low. This might be ascribed to the low incidence of red thrombus in the entire dataset23 and could be resolved by increasing the sample number or appropriate data augmentation methods.
We next developed a generative model with GAN algorithm to synthesise realistic CAS images. Medical image simulation should be one of the most intuitive applications of generative modelling.24 Recently, Tom and Sheet proposed a novel approach to simulate the intravascular ultrasound images with a stacked GAN-based framework.25 The authors believe that a simulation model can serve as an aid for doctors to learn rare diseases. Actually, it has been reported that simulation-based training improves cardiology fellows’ skills in cardiac catheterisation.26 Since realistic visualisation is an essential component of practical simulation,27 our approach to generate CAS images with GAN should be a promising option for the medical simulation method.
The medical image synthesis is not limited to educational purposes, but also implicated in the improvement of automatic diagnosis systems. To this date, it has been reported that medical image synthesis by GAN is as effective as a data augmentation method in a classification task.28 Gupta et al reported that GAN-based data augmentation could address the class imbalance in the training data and achieved better performance in the bone lesion classification in X-rays.29 Similarly, we could see significant improvement in the performance of the regression model for NC grade and the classification model for the red thrombus by GAN-based image augmentation. Although the validation data size was quite small, our data adds evidence that support the efficacy of this method.
In this study, we also showed the potential of conditional GAN to control the output images according to the CAS findings. With this model, we could change the YC and NC grades of the output image at the same time, by giving the multidimensional condition. Although we were not able to control NC grades at this point, this method holds a potential to reduce the burden of annotation tasks for the synthesised images. Aside from that, conditional GAN could be used to further develop a non-invasive virtual CAS system.30 As Nishimoto et al reported in 2017, there are some clinical factors which can determine the CAS findings.10 Therefore, if we can select appropriate variables to predict the pathological state from the individual patient data, it might be possible to generate patient-specific virtual CAS images.
Limitations
This combined dataset may not be reflective of the contemporary cohort of coronary artery disease patients, as the therapeutics for coronary interventions have experienced a drastic change over the last couple of decades. In addition, considerable publication bias is inevitable due to our image collection method. Therefore, it is highly possible that our synthesised images do not reflect the real-world distribution of pathological findings. In fact, we observed higher incidence of red thrombus in the synthesised images than in our hospital data. On the other hand, this publication bias should not have negative influence on the image recognition task, because the collected images were better curated and include more representative findings than our raw data, which can lead to the increased the versatility of our prediction model. The second limitation is the inherent subjective nature of angioscopy itself. Although our 4-point grading scale is widely accepted, there should be a certain degree of intraobserver and interobserver variability.31 Quantitative colorimetry is known to be an objective method to assess the plaque colour,32 but it was not effective for the YC grade prediction in our data (see online supplementary figure S2). Therefore, our future work should directly focus on the accordance with pathological findings, such as fibrous cap thickness. Finally, the metrics for the generative model in terms of image quality are not complete. Since all the authors were well versed in angioscopy, Visual Turing test33 was not applicable this time and we only used Inception score. However, the result of GAN-based data augmentation may indirectly indicate the quality of synthesised images.
Conclusion
DCNNs are useful in diagnostic prediction for the CAS findings which outperformed the SVM models. In addition, image generation by DCNNs can improve the performance of prediction models. DCNN could be the most promising method to develop an automated diagnostic support system for CAS.
Acknowledgments
Brandon Shokoples provided constructive comments on the expression in this manuscript.
References
Footnotes
Contributors TM contributed to collecting the patient data, data annotation and writing the original draft. AH contributed to conceptualisation, development of methodology, implementing computer programmes and reviewing the manuscript. HK has contributed to the supervision of the research activity. OY has contributed to the project administration.
Funding The authors have not declared a specific grant for this research from any funding agency in the public, commercial or not-for-profit sectors.
Competing interests None declared.
Patient consent for publication Not required.
Ethics approval This retrospective observatory study was performed following the principles of the Declaration of Helsinki and the Japanese ethical guidelines for clinical research. The study protocol was approved by the institutional review boards and the ethics committees of Ehime Prefectural Imabari Hospital.
Provenance and peer review Not commissioned; externally peer reviewed.
Data availability statement Data are available in a public, open access repository. Data are available on reasonable request. Source codes used in this study are available from the online repositories: Mendeley, http://dx.doi.org/10.17632/9dx23j5d64.1, DOI: 10.17632/9dx23j5d64.2. Anonymised image data which is used in this study can be obtained from the corresponding author (akinori.higaki@mail.mcgill.ca) on reasonable request such as reproducibility assessment.