Article Text

Abstract
Background Myocardial infarction (MI) has been shown to induce fibrotic remodelling of the mitral and tricuspid valves. It is unknown whether MI also induces pathological remodelling of the aortic valve and alters aortic stenosis (AS) progression. We thus compared AS progression after an acute MI and in patients with/without history of MI, and assessed post-MI pathobiological changes within the aortic valve leaflets in a sheep model.
Methods Serial echocardiograms in human patients with AS were retrospectively analysed and compared between 3 groups: (1) acute MI at baseline (n=68), (2) prior history of MI (n=45) and (3) controls without MI (n=101). Annualised progression rates of AS severity were compared between these 3 groups. In addition, aortic valves were harvested from 15 sheep: (1) induced inferior MI (n=10) and (2) controls without MI (n=5), for biological and histological analyses.
Results In humans, the acute MI, previous MI and control groups had comparable baseline AS severity. Indexed aortic valve area (AVAi) declined faster in the acute MI group compared with controls (−0.07±0.06 vs −0.04±0.04 cm2/m2/year; p=0.004). After adjustment, acute MI status was significantly associated with faster AVAi progression (mean difference: −0.013 (95% CI −0.023 to −0.003) cm2/m2/year, p=0.008). In the post-MI experimental animal model, aortic valve thickness and qualitative/quantitative expression of collagen were significantly increased compared with controls.
Conclusions The results of this study suggest that AS progression is accelerated following acute MI, which could be caused by increased collagen production and thickening of the aortic valve after the ischaemic event.
- myocardial infarction
- echocardiography
- aortic valve stenosis
This is an open access article distributed in accordance with the Creative Commons Attribution Non Commercial (CC BY-NC 4.0) license, which permits others to distribute, remix, adapt, build upon this work non-commercially, and license their derivative works on different terms, provided the original work is properly cited, appropriate credit is given, any changes made indicated, and the use is non-commercial. See: http://creativecommons.org/licenses/by-nc/4.0/.
Statistics from Altmetric.com
WHAT IS ALREADY KNOWN ON THIS TOPIC
The association between coronary artery disease and aortic stenosis has been inconsistent, while myocardial infarction has been shown to induce pathobiological changes within the mitral and tricuspid valve leaflets.
WHAT THIS STUDY ADDS
This study demonstrated an accelerated progression of aortic stenosis in the period following an acute myocardial infarction, which could be possibly related to adverse pathobiological changes observed in the aortic valve leaflets of experimental animal models.
HOW THIS STUDY MIGHT AFFECT RESEARCH, PRACTICE AND/OR POLICY
These findings suggest that patients with aortic stenosis who suffer from a myocardial infarction may exhibit faster valvular disease progression and may require closer follow-up.
Moreover, the association between myocardial infarction and aortic leaflet changes in our experimental model could lead to the identification of new pathophysiological pathways implied in the progression of aortic stenosis.
Introduction
Aortic stenosis (AS) affects 2%–5% of the population >75 years old.1 2 Factors influencing AS progression remain poorly understood. Age, bicuspid valve, chronic kidney disease and advanced stenosis severity have been associated with faster progression.3 There is a strong epidemiological association linking AS and coronary artery disease (CAD). Large populational studies have shown that aortic sclerosis and calcification are correlated with an increased risk of cardiovascular events, while CAD has been associated with an increased prevalence of AS.4–8 AS pathophysiology shares similarities with atherosclerosis, with alteration of endothelial function, lipid metabolism and inflammation.9 Yet, there are mechanistic differences between these entities, with enhanced calcification processes and greater fibrotic remodelling in AS.3 10 Also, treatments known to affect atherosclerosis (eg, statins) are ineffective in AS.11
Recent studies suggest that an ischaemic event can impact valvular biology. It has been demonstrated that myocardial infarction (MI) induces pathological remodelling of the mitral valve in experimental models.12 MI was related to increased mitral valve thickness and mitral regurgitation in a clinical observational study.13 Similar changes were also noted in tricuspid valve tissue.14 However, the role of MI on aortic valve remodelling and AS progression has never been studied.
We hypothesised that MI promotes pathological aortic valve remodelling and accelerates AS progression. Our goal was to retrospectively assess the impact of an acute MI on AS progression in patients followed with serial echocardiograms. In a related large animal experimental study, aortic valve thickness and collagen expression/quantification were assessed post-MI and compared with controls.
Methods
We performed a retrospective cohort analysis of patients with AS at the Quebec Heart and Lung Institute (2005–2020). Patients were identified by keyword search through medical records. Inclusion required a diagnosis of AS (aortic peak jet velocity (Vpeak) ≥2 m/s, mean aortic gradient (MG) ≥20 mm Hg or aortic valve area (AVA) ≤1.5 cm2), with or without history of MI (defined by ST changes, elevated troponins, wall motion abnormality in ≥2 contiguous segments on echocardiogram and coronary obstruction on angiography). At least two echocardiographic examinations performed 1–2 years apart were required. Patients were divided into three groups according to the presence and timing of MI: (1) acute MI (baseline examination ≤1 week from the index event); (2) previous MI (MI ≥2.5 years before the baseline echocardiogram) and (3) control patients without MI (online supplemental figure I). In the acute MI group, we collected data from subsequent echocardiograms (≥6 months after the first follow-up study post-MI) to compare progression of AS early versus late after MI, as well as available echocardiograms performed ≥6 months prior to the MI to compare pre-MI progression rate of AS. Maximal troponin level during MI was collected through review of medical records. Patients without obstructive CAD as the cause of their MI or with a history of rheumatic fever, valve surgery, hypertrophic cardiomyopathy or chest radiation were excluded. Patients and public were not involved in the accomplishment of this project.
Supplemental material
Echocardiography
Echocardiograms were reviewed by a cardiologist blinded to the patients’ group. The left ventricular outflow tract velocity-time integral (VTI) and aortic valve gradients were measured separately, in a blinded fashion, to avoid group recognition by assessment of the left ventricular ejection fraction (LVEF). AS measurements included MG, Vpeak, VTI ratio, left ventricular ejection time (LVET) and AVA calculation by the continuity equation, according to guidelines.15 Annual progression rate of AS parameters was calculated by the difference between follow-up and baseline measurements, divided by the time elapsed between studies. Stroke volume was calculated using left ventricular outflow track diameter and VTI, indexed to body surface area (SVi). Low flow was determined asan indexed stroke volume <35 mL/m2. Transvalvular flow rate was calculated by division of the stroke volume with the LVET. LVEF was computed using the Simpson method.16
Ancillary animal study
As part of a parallel study, MI was induced in 10 adult Dorsett hybrid sheep (50% female, >35 kg) under general anaesthesia, by left thoracotomy and ligation of the second and third marginals. An additional five animals of the same age and weight were used as controls. The animals were sacrificed 10 days later, and their aortic valves were harvested. All harvested valves were included in the analysis. Collagen type 1 α−1 (COL1A1) and its expression were quantified in aortic leaflets using western blot analysis (quantitative comparison with extracellular signal-regulated kinase (ERK1/2)) and quantitative real-time PCR. Transversal sections of the aortic valves were obtained, and Masson trichrome staining was performed for overall morphology. Leaflet thickness was averaged after the measurement of the 10 thickest areas of the leaflets. Detailed descriptions of the experimental methods are presented in the online supplemental methods.
Statistical analysis
Continuous data were assessed for normality (Shapiro-Wilk test) and presented as mean±SD or median (IQR) accordingly. Differences between the three groups of patients were tested with the global Fisher’s test (analysis of variance), with Tukey method for multiple comparisons. Categorical data are presented as proportions and were compared with the Pearson’s χ2 or Fisher’s exact tests when appropriate. Different troponin assays were compared using the ratio of the maximal value divided by its upper normal limit (ULN). Data regarding bicuspid valve morphology were missing for two individuals and was replaced with mean imputation. Univariate and multivariate linear regression analyses were performed comparing the acute MI, previous MI and control groups, to evaluate the association between MI status and the annual progression rates of AVA indexed to body surface area (AVAi), AVA, VTI ratio, MG and Vpeak. Models were adjusted for known AS risk factors (age, sex, smoking history, diabetes, hypertension, dyslipidaemia and chronic kidney disease) and potential confounders for disease progression (bicuspid valve, annual change in SVi, baseline AS severity, medication). Regression coefficients are presented as mean differences (MD) with their 95% CIs. A paired analysis was conducted to compare progression of AS severity parameters in the acute MI group at early versus late follow-up times post-MI. The association was tested with a Wilcoxon signed rank test given the low number of pairs. Intra-observer and inter-observer variabilities were evaluated on AVA measurement using a mixed two-way intraclass correlation coefficient, with the respective results of 0.93 and 0.87. A p value <0.05 was considered statistically significant. The statistical analyses were performed using the JMP software V.14.
Results
The acute MI, previous MI and control groups included respectively 68, 45 and 101 patients, with 40%, 13% and 46% of women (p<0.01, table 1). The acute MI and previous MI groups were similar in most of their baseline characteristics, except for a higher prevalence of angiotensin II receptor blocker in the latter (p=0.005). When compared to patients with acute MI, controls had a lower prevalence of cardiovascular risk factors (smoking, diabetes and chronic kidney disease, all p<0.05). Thirty-four per cent of them had a history of CAD (coronary stenosis or ischaemia without MI), and fewer patients were on antihypertensive medication and statins (p<0.05). Prevalence of bicuspid aortic valve was similar between groups (p=0.68).
Baseline clinical and echocardiographic characteristics
Baseline echocardiographic measurements are presented in table 1 (follow-up measurements can be found in the online supplemental table I). Mean duration time up to the early follow-up was 1.35±0.58, 1.61±0.56 and 1.61±0.61 years for the acute MI, previous MI and control groups, respectively (shorter duration for the acute MI group, p=0.01). Baseline AVAi, AVA, VTI ratio and MG were comparable between groups. Vpeak, LVEF and SVi were lower in the acute MI group at baseline (p<0.05), with a mean LVEF of 50.0%±10.6%.
Comparison of progression rates between groups
The acute MI group showed faster annual reduction in AVAi when compared with the control group (−0.068±0.063 vs −0.042±0.039 cm2/m2/year, p=0.004, figure 1 and table 2). Faster AS progression in the acute MI group was also supported by the annual changes in AVA and VTI ratio (table 2). There was a numerical but not statistically significant increase in the progression rates of the MG and Vpeak in the acute MI group. AS progression rates were similar between the previous MI and control groups.

Indexed aortic valve area progression rate by patient group. Box plot graph comparing indexed aortic valve area annual progression rates between the three groups. AVAi, indexed aortic valve area; MI, myocardial infarction.
Annual progression rate of aortic stenosis severity parameters
LVEF improved or remained stable for most patients in the acute MI group, while it did not significantly change in the other groups. In the acute MI group, AVAi progression rates were similar (p>0.15) for patients who increased (n=26) vs patients who decreased their SVi at follow-up (n=42), whereas MG and Vpeak progressed faster in patients who increased their SVi (MG: 4.82±0.74 vs 1.44±0.94 mm Hg/year, p=0.006; Vpeak: 0.35±0.37 vs 0.13±0.43 m/s/year, p=0.03). Patients who had low flow at follow-up did not show a faster decline in AVAi compared with patients with normal flow (p=0.34). Patients with higher ratio of maximal troponin to ULN (>median) versus lower ratio (≤median) did not exhibit different rates of AS progression for all parameters (p>0.21).
Univariate linear regression analysis showed a significant association between the acute MI status and faster deterioration in AVAi, AVA, VTI ratio and Vpeak (table 3). After comprehensive adjustment, acute MI status and baseline AVAi were the only two factors associated with a faster reduction in AVAi, AVA and VTI ratio (table 3 and online supplemental table II). There was no statistically significant association between the previous MI status and progression of AS severity parameters. The aforementioned associations remained consistent using different multivariate models (online supplemental table II). Sex did not have a statistically significant impact on AS progression.
Univariate and multivariate linear regression analysis of the association between MI and annual progression rate of aortic stenosis
Pre-MI, early and late post-MI progression rates in the acute MI group
Fourteen out of the 68 patients in the acute MI group had an available imaging study prior to MI. Mean AVAi progression rate was then −0.048±0.078 cm2/m2/year. Twenty-eight patients in the acute MI group had a second follow-up echocardiogram available (late post-MI evaluation). Other patients in this group either underwent aortic valve replacement, died or did not have a follow-up echocardiography at our centre during the required time frame (online supplemental table III). Mean follow-up duration from early follow-up to late follow-up examination was 2.65±1.36 years (3.97±1.52 years from baseline). Comparison of early and late post-MI annual AS progression rates is shown in table 4, figure 2 and online supplemental figure II. All AS severity parameters showed slower progression rates at late follow-up post-MI when compared with early follow-up time (p<0.05).
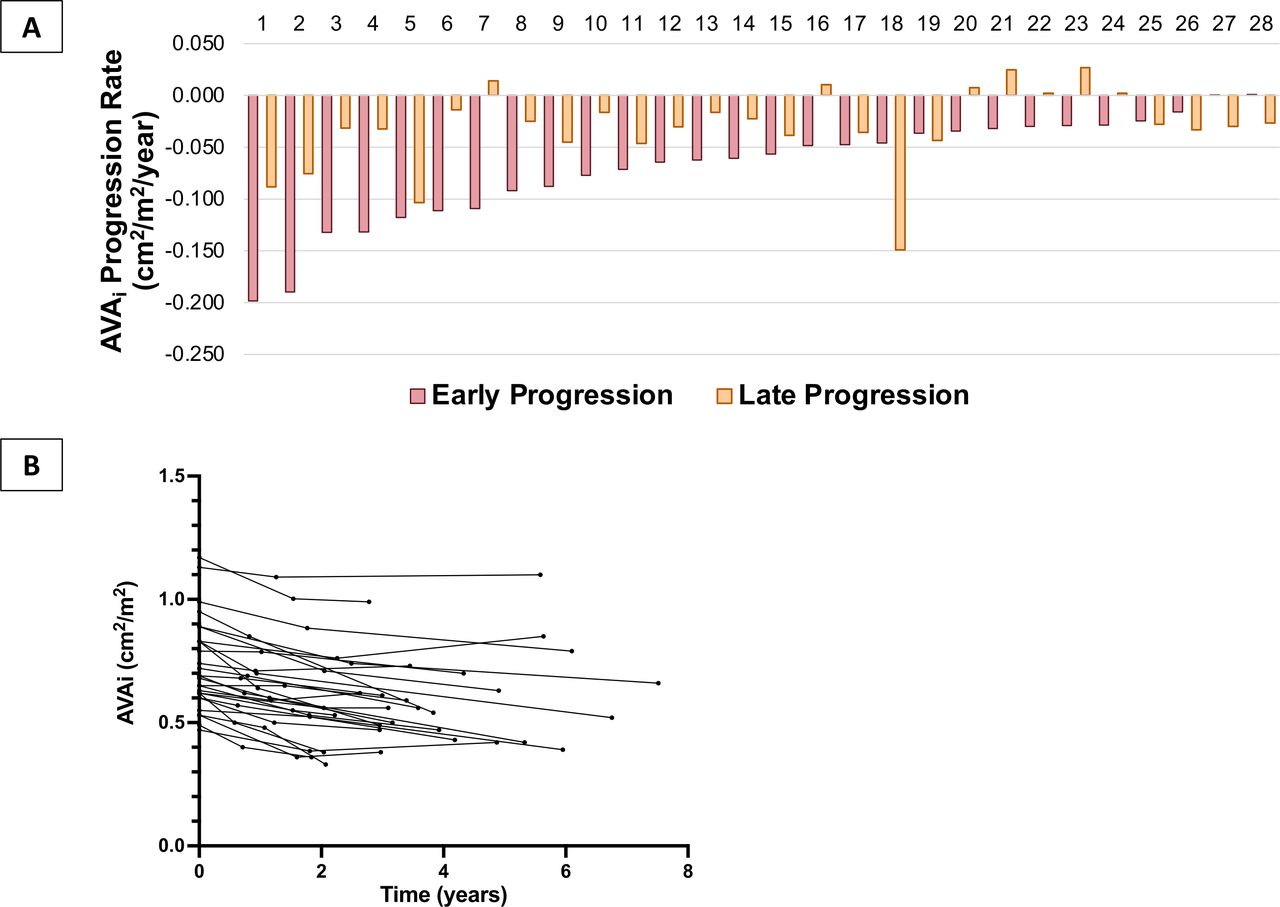
Annual progression rate of indexed aortic valve area at early versus late follow-up postmyocardial infarction in the acute myocardial infarction group. (A) Bar chart presenting the annual indexed aortic valve area progression rate in the acute MI group, comparing for early versus late postmyocardial infarction progression rates for each individual; (B) multiple line graph of indexed aortic valve area measured at each timepoint for each individual. AVAi, indexed aortic valve area.
Early versus late progression rate of aortic stenosis severity parameters in the acute myocardial infarction group
Experimental animal study
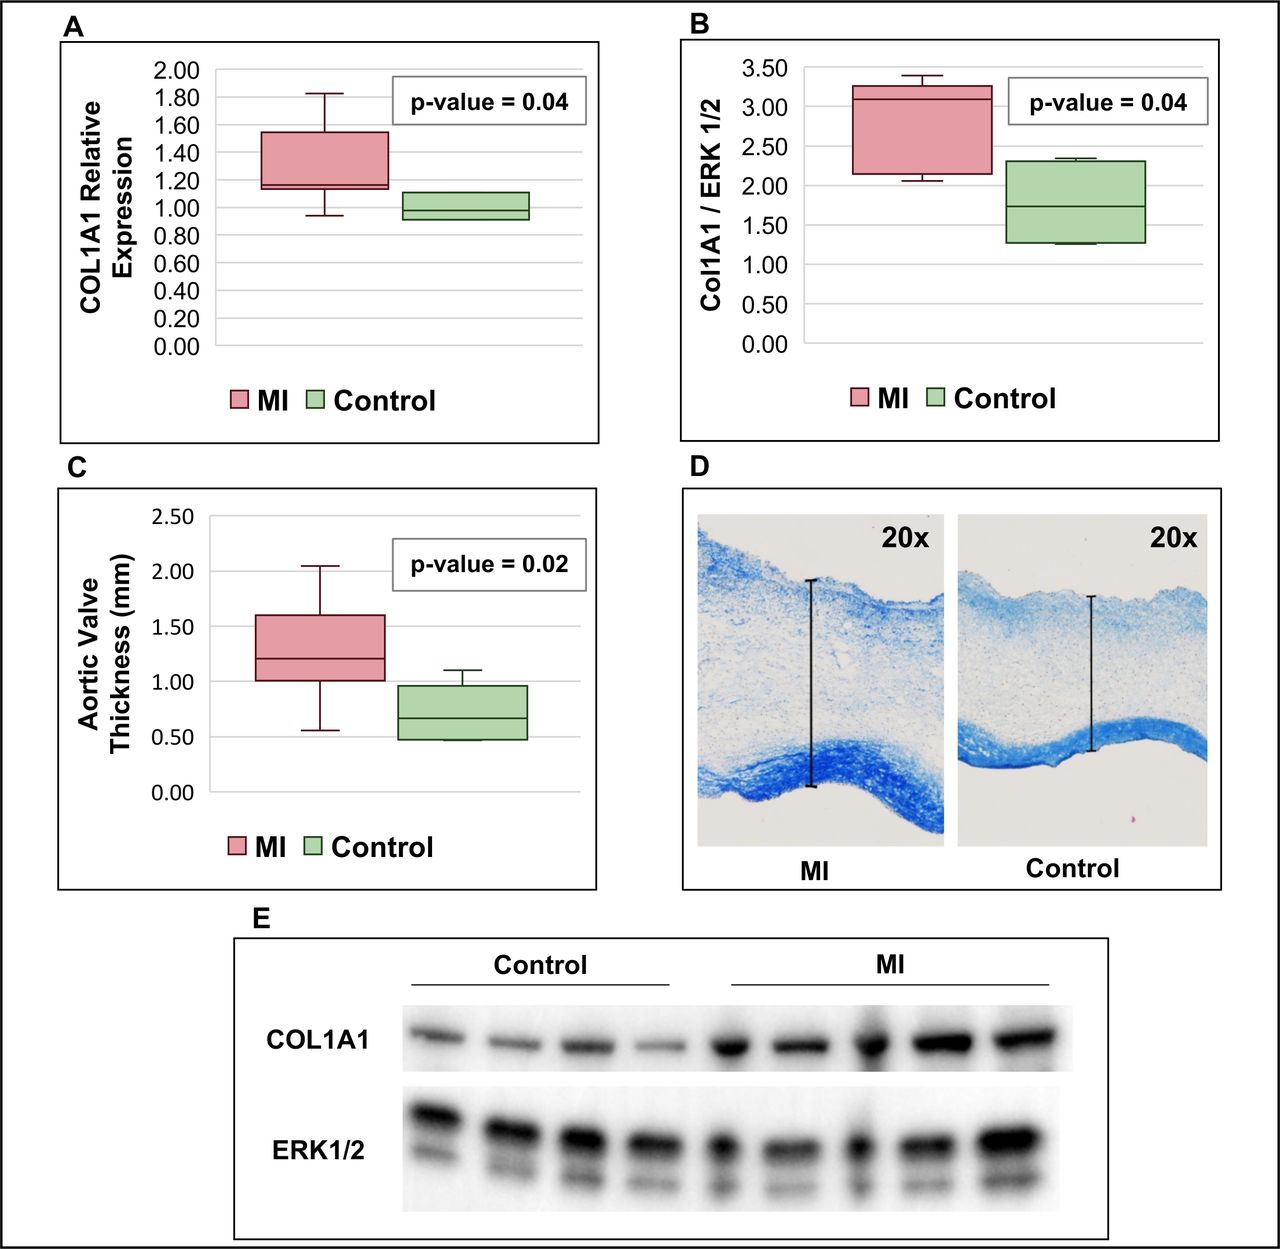
The relative expression of COL1A1 RNA was significantly increased in the aortic valves harvested 10 days post-MI (n=10) vs controls (n=5), (1.70±0.40 vs 1.00±0.38 fold change, p=0.042, figure 3). Western blot analysis confirmed increased collagen content in post-MI models versus controls (2.78±0.59 vs 1.77±0.57 background corrected signal density, p=0.038). Histological analysis revealed increased aortic leaflet thickness in post-MI valves versus controls (1.27±0.48 vs 0.72±0.25 mm, p=0.02).

Results of the experimental studies. Box plots and figures comparing animal models with induced MI with controls: (A) quantitative real-time PCR of COL1A1 mRNA expression; (B) western blot analysis of COL1A1 quantification; (C) measurement of aortic valve leaflet thickness; (D) example of aortic valve leaflet thickness measurement; (E) representative western blot analysis of COL1A1 quantification comparing the control and MI groups. COL1A1, collagen α−1 type 1; ERK 1/2, extracellular signal-regulated kinases 1 and 2; MI, myocardial infarction group.
Discussion
These results suggest faster decline of AVAi, AVA and VTI ratio following an acute MI compared with patients with a remote history of MI or without MI. This association remained significant after adjustment for baseline factors associated with AS prevalence and progression. The early versus late progression analysis in the acute MI group suggests that this accelerated progression might be transient, with a return to progression rates similar to controls few years after MI. The large animal experimentations indicate increased collagen production in the days following the MI, suggesting active valve remodelling following the MI.
There was a numerically faster progression of MG and Vpeak early after MI, however without statistical significance. Most AS quantification parameters are dependent on flow, which can evolve following MI (systolic dysfunction and/or associated therapy). The MG and Vpeak are directly related to valvular flow, while VTI ratio and AVA (continuity equation) are less impacted by correcting for prevalvular flow.17 The faster decline of AVAi in the acute MI group was observed despite a significant increase of the mean SVi at follow-up. This decline was similar in patients who increased or decreased their SVi in time, and in those who had low flow at follow-up.
The difference observed in AVAi progression rates between groups was quantitatively small but expected and consistent with previous reported data.11 18 Moreover, the present study is the first to describe the impact of an acute ischaemic event on AS progression. We included a second comparative group of patients with a remote history of MI as an attempt to balance for different risk factor profiles between acute MI and control patients. Similarities between the previous patients with MI and the controls suggest that acute MI could be by itself a trigger for AS progression. The subgroup of patients with serial observations early and late after MI supports this idea: annual changes of AS parameters were about twice as fast in the period closer to the MI than the period occurring later. This difference in time could not be explained by changes in left systolic function or SVi. Considering that AS usually evolves faster as it becomes more severe, the observed deceleration in AS progression late after MI underlines the significance of the acceleration happening shortly after the ischaemic event. Pre-MI imaging data were available in only a small number of patients but revealed AS progression rates numerically comparable to the previous MI and control groups.
The idea of valvular changes induced by the MI is also supported by our experimental model, showing post-MI aortic valve changes, with increased thickness and increased collagen production. This phenomenon can contribute to the clinically detected progression in AS. This is consistent with previous data showing altered valvular biology post-MI in the mitral and tricuspid valves. These changes and those observed in the aortic valve likely share a common mechanistic explanation, whose origin is still under exploration.12–14 Neurohumoral activation including renin-angiotensin-aldosterone system has been identified as a potential element explaining the changes in valve biology after MI.19 The progression of AS is complex, with numerous distinct mechanisms involved in its initiation, progression, development of fibrosis and calcification. The animal study suggests MI-associated stimulation of fibrotic pathways in an initially normal valve. While calcification was not observed, longer follow-up duration would likely be necessary to explore this component. The clinical retrospective study shows accelerated progression in patients with abnormal valve at baseline—the distinction between fibrotic remodelling and/or accelerated calcification could not be explored with echocardiography, and future studies involving serial measurement of aortic valve calcium with CT could help to better characterise the mechanisms (fibrosis and/or calcification) involved in AS progression.
Limitations
This was a retrospective cohort study of echocardiograms performed in a clinical setting. Therefore, efforts to reach the maximal Doppler signal may have varied between individuals and in time. While risk factor profiles differed between study groups, a subset of the acute MI group was followed serially (pre-MI, early and late post-MI) and showed similar results to the entire cohort analysis. The early and late post-MI periods were arbitrarily determined and, thus, the exact timing and duration of accelerated AS progression post-MI could not be determined based on the current data. The variation of MG and Vpeak did not reach statistical significance, possibly related to a lack in power. Similarly, we could not demonstrate a dose-response relationship between the severity of MI (as determined by troponin elevation) and AS progression rate, possibly related to a lack in power, presence of multiple troponin assays and different timing of measures after MI; those factors are inherently related to the retrospective design of our study. Also, our cohort included mostly patients with mild-to-moderate AS. It is known that for comparable changes in AVA, the MG and Vpeak increase more when AVA is severely reduced than at milder stages of the disease.20 Prospective validation in a larger cohort of patients would provide support for those findings and better define their clinical impact. Our large animal experimental model did not have AS at baseline, and the observed changes at 10 days did not impact valvular function. Longer animal studies are needed to confirm the development of AS and demonstrate the mechanisms of post-MI changes in the aortic valve.
Conclusion
This work suggests that patients with AS who suffer from an acute MI may be at increased risk of faster progression of aortic valve disease in the year(s) following the ischaemic event. Closer follow-up of these patients could be indicated. Prospective studies are needed to confirm this hypothesis and to evaluate if these patients reach indication for aortic valve replacement sooner. Moreover, a better understanding of the pathophysiological pathways involved in AS progression following MI may lead to identification of new potential pharmacotherapeutic targets.
Ethics statements
Patient consent for publication
Ethics approval
This study was approved by the Laval University Animal Protection Committee according to the recommendations from the Canadian Council on Laboratory Animal Care. Patient informed consent was waived due to the retrospective nature of the study.
References
Supplementary materials
Supplementary Data
This web only file has been produced by the BMJ Publishing Group from an electronic file supplied by the author(s) and has not been edited for content.
Footnotes
Twitter @ppibarot
Contributors AP contributed to the design of the study, collected the data, carried out the analyses and drafted, reviewed and revised the manuscript. OM realised the animal experimental study, collected the data and participated in manuscript revision. VD participated in the experimental study and data collection. M-AC supervised the animal experiments and participated in critical review of the manuscript. CR assisted in data collection. MC assisted in data presentation. DR and SH participated in critical review of the manuscript. EA, RAL and PP participated as senior collaborators in critical review of the manuscript. JB conceptualised and designed the study, supervised human and animal data collection, critically revised the manuscript and is the guarantor. All authors approved the final manuscript as submitted and agreed to be accountable for all aspects of the work.
Funding AP is recipient of a scholarship from the Canadian Institutes of Health Research and of the Fond de recherche du Quebec–Sante grant for Specialty Medicine Residents with an Interest in Pursuing a Research Career (Canada). M-AC received a New National Investigator award from the Heart and Stroke Foundation of Canada and an Early Career Investigator award from the Canadian Institutes for Health Research (Canada). JB is funded by the Fonds de Recherche Quebec–Sante (Canada). His work is funded by the Canadian Institutes for Health Research (grant #399323) and the Fondation de l’Institut universitaire de cardiologie et de pneumologie de Quebec (Canada). This work is supported by National Institute of Health grants R01 HL147095 (EA), R01 HL136431 (EA) and R01 HL141917 (RAL, EA) (USA).
Competing interests None declared.
Provenance and peer review Not commissioned; externally peer reviewed.
Supplemental material This content has been supplied by the author(s). It has not been vetted by BMJ Publishing Group Limited (BMJ) and may not have been peer-reviewed. Any opinions or recommendations discussed are solely those of the author(s) and are not endorsed by BMJ. BMJ disclaims all liability and responsibility arising from any reliance placed on the content. Where the content includes any translated material, BMJ does not warrant the accuracy and reliability of the translations (including but not limited to local regulations, clinical guidelines, terminology, drug names and drug dosages), and is not responsible for any error and/or omissions arising from translation and adaptation or otherwise.