Article Text

Abstract
Objectives Although cardiovascular magnetic resonance (CMR) is increasingly used to diagnose pericardial inflammation, imaging can still be challenging using conventional CMR techniques. Parametric mapping (T1/T2 mapping) techniques have emerged as novel methods to quantify focal and global changes of the myocardium without contrast agent. The aim of the present study was to implement parametric mapping to facilitate diagnostic decision-making in pericardial inflammation.
Methods Twenty patients with pericardial inflammation underwent CMR (1.5T system) including T1-weighted/T2-weighted imaging, T1/T2 mapping and late gadolinium enhancement. T1/T2 mapping was performed in end-diastole covering three short-axis slices. Diagnosis of pericardial inflammation was made according to recent guidelines. T1/T2 measurements were pursued by manually drawing regions of interest (ROIs) in the thickened, diseased pericardium carefully avoiding contamination by other cardiac structures. Parametric values were correlated to further markers of pericardial inflammation, such as pericardial thickening and inflammatory parameters.
Results On average, the pericardium displayed a thickness of 4.8±1.0 mm. Mean T1 value was 1363.0±227.1 ms and T2 value was 123.3±52.6 ms, which were above patient’s myocardial values (myocardial T1: 998.7±81.0 ms, p<0.001, median 1014.46 ms; T2: 68.0±28.9 m,p<0.001) and the values of a group of four patients with chronic pericarditis (T1: 953.0±16.7 ms; T2: 63.2±10.1 ms). T1 and T2 showed a correlation to the extent of the thickened pericardium (R=0.64, p=0.002 for T1, R=0.72, p=0.005 for T2). There was no correlation of pericardial T1/T2 to blood markers of inflammation, myocardial injury (C reactive protein, troponin, creatine kinase) or further CMR parameters.
Conclusions In patients with pericardial inflammation, parametric mapping showed elevated T1 and T2 values. Parametric mapping may help to facilitate diagnosis of pericardial inflammation if conventional parameters such as pericardial hyperintensity in T1-weighted or T2-weighted imaging or contrast agent uptake are heterogeneous.
- magnetic resonance imaging
- inflammation
- pericarditis
Data availability statement
Data are available upon reasonable request.
This is an open access article distributed in accordance with the Creative Commons Attribution Non Commercial (CC BY-NC 4.0) license, which permits others to distribute, remix, adapt, build upon this work non-commercially, and license their derivative works on different terms, provided the original work is properly cited, appropriate credit is given, any changes made indicated, and the use is non-commercial. See: http://creativecommons.org/licenses/by-nc/4.0/.
Statistics from Altmetric.com
WHAT IS ALREADY KNOWN ON THIS TOPIC
Despite the growing knowledge about the pathophysiology of pericardial diseases and increased availability of diagnostic tools including technical developments, imaging of pericardial inflammation still remains challenging. Diagnosis of pericardial inflammation by cardiovascular magnetic resonance is usually made through visualisation of thickened pericardium, pericardial oedema and contrast agent uptake. Parametric mapping (T1/T2 mapping) techniques have emerged as novel methods to quantify focal and global changes of the myocardium without contrast agent.
WHAT THIS STUDY ADDS
Parametric T1 and T2 mapping is feasible and was able to strengthen the diagnosis of pericardial inflammation in the studied cohort of patients.
HOW THIS STUDY MIGHT AFFECT RESEARCH, PRACTICE AND/OR POLICY
Parametric T1 and T2 mapping may help to guide decision-making in the diagnosis of pericardial inflammation in clinical routine, especially in patients with contraindications for contrast agent administration.
Introduction
Pericardial inflammation is heterogeneous in its symptoms and has a wide range of causes that involve or damage the pericardium.1 Due to the increasing morbidity and mortality of pericardial diseases, imaging becomes important for an appropriate diagnosis. Despite the growing knowledge about the pathophysiology of pericardial diseases and increased availability of diagnostic tools including technical developments, imaging of pericardial inflammation still remains challenging. In daily routine, three main non-invasive imaging modalities are used to assess the pericardial changes: transthoracic echocardiography (TTE), cardiac CT and contrast-enhanced cardiovascular magnetic resonance (CMR).1 2
TTE is used as first-line imaging technique in daily clinical practice and CT scan has an important role in detecting pericardial calcifications.2–4 For a comprehensive view and to estimate the extent of pericardial inflammation in terms of an accurate measurement of pericardial or surrounding structures, for example, myocardial involvement, CMR is increasingly used.5–7 Diagnosis of pericardial inflammation by CMR is usually made through the visualisation of thickened pericardium, pericardial oedema and contrast agent uptake.3 8 T1-weighted and T2-weighted imaging does not require contrast agents for the visualisation of inflammation and parametric mapping (T1/T2) techniques have emerged as novel methods to visualise and even quantify focal and global changes of the myocardium without contrast agent.9 In this context, T1 and T2 mapping have already proven their value in the diagnosis of myocarditis and even found their way into the updated Lake Louise criteria for the recommendations of CMR criteria to detect myocardial inflammation.8 10 11
Due to the thin diameter of healthy pericardium and a potential partial volume effect, objective quantification of pericardial T1/T2 values remains challenging.5 As inflammatory pericarditis causes pericardial thickening due to granulating tissue with fibrin depositions and measurements of healthy thin pericardium are hampered, the purpose of the present study was to investigate the potential of parametric T1/T2 mapping for the diagnosis of pericardial inflammation.
Methods
Study design
The study was conducted in a retrospective design. Exclusion criteria were thin pericardium hampering the positioning of a region of interest (ROI) or insufficient image quality. Nine patients were excluded due to impaired ROI positioning and three due to impaired image quality. Myocardial involvement was not an exclusion criterion. Therefore, 20 consecutive patients (17 male, 46±21 years) with pericardial inflammation were retrospectively included between February 2016 and March 2019. Height and weight of all patients were obtained to calculate body surface area. Four patients with chronic pericarditis (including two of the acute patients with a follow-up) were included as reference group.
CMR data acquisition
Imaging was performed on a clinical 1.5T system (Achieva, Philips Healthcare, Best, the Netherlands) using a five-channel cardiac receiver coil.
Cardiac function and dimension were assessed by applying a stack of electrocardiography-triggered, balanced steady-state free precession (bSSFP) short-axis cine images covering the entire left ventricle and long-axis cine images in two-chamber, three-chamber and four-chamber views.
T1/T2 black blood imaging with fat suppression (spectral presaturation with inversion recovery) was performed for the detection of pericardial or myocardial oedema. Sequence parameters for T1 mapping were mean repetition time (TR) 2.3 ms, echo time (TE) 0.9 ms, flip angle (FA) 35° and mean voxel size 1.2×1.2×10 mm3, one slice per breathhold. For T2 mapping, parameters were mean TE 728 ms, mean TR 9.4 ms, FA 90° and mean voxel size 1.1×1.1×10 mm3, one slice per breathhold. Both T1 and T2 mapping were performed in end-diastole covering three short-axis slices using single breathholds for respiratory motion compensation. If eligible, patients received gadolinium-based contrast agent (0.2 mmol/kg, Gadovist, Bayer Healthcare, Berlin, Germany) for late gadolinium enhancement (LGE) in order to detect myocardial or pericardial scarring/fibrosis. Anatomy for LGE was taken from bSSFP images in long-axis and short-axis orientation.
CMR data postprocessing
The diagnosis of acute pericardial inflammation was made according to recent guidelines using thickened pericardium, hyperintense signals in T1-weighted/T2-weighted imaging and pericardial signal enhancement in LGE imaging.3 Perimyocarditis was deemed if patients fulfilled updated Lake Louise criteria.8 There were two main criteria: (1) an increase in T2-weighted imaging/mapping and (2) an increase in T1 mapping, extracellular volume or presence of LGE suggestive of myocarditis. One criterion in each of the categories needed to be positive for a diagnosis of myocardial involvement.
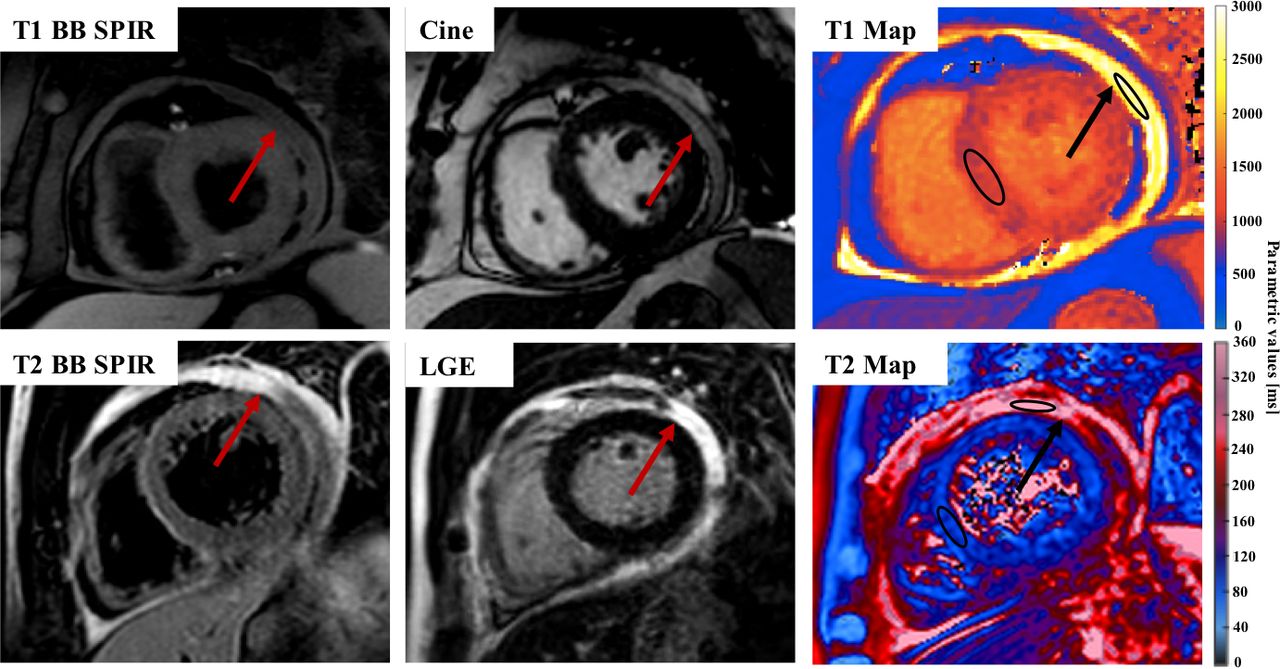
Postprocessing was performed offline using dedicated software with respective calculation algorithms for the T1/T2 fitting curves (GTVolume, GyroTools LLC, and IntelliSpace Portal, Philips). Pericardial thickening was measured in T1-weighted images at maximum pericardial extent. This was due to a better differentiation between the inflamed (hyperintense) pericardium in contrast to the hypointense pericardial effusion or epicardial fat. Prior to T1 calculation and to compensate for residual motion, T1 mapping images were motion registered using a non-rigid groupwise image registration method, if possible.12 T1/T2 measurements were performed by manually drawing a freehand ROI according to the shape of the pericardium in slices showing thickened pericardial layers while carefully and visually avoiding inclusion of other anatomical structures, for example, pericardial effusion or epicardial fat (figure 1).9 In addition, another ROI was placed in the interventricular septum of all slices to acquire myocardial values. As recently recommended, a minimum size for the ROIs was pursued.9 To increase quality, ROIs were checked and positioned by two experienced observers. Normal myocardial values for T1 and T2 mapping were taken from current literature according to age and gender.13–15

Exemplary T1 black blood (BB) SPIR, cine image (bSSFP) and T1 map (upper row, one patient with high values) and T2 BB SPIR, LGE and T2 map (lower row, second patient) for the visualisation of pericarditis with thickened pericardium and elevated T1 and T2 mapping values. Red/black arrows indicate the thickened pericardium, exemplary ROIs are drawn in the pericardium and myocardial septum. bSSFP, balanced steady-state free precession; LGE, late gadolinium enhancement; ROI, region of interest; SPIR, spectral presaturation with inversion recovery.
Statistical analysis
Statistical analyses were conducted using SPSS V.25.0 (IBM, Armonk, New York, USA). Unless otherwise stated, continuous variables are presented as mean±SD. Normal distribution was tested using the Shapiro-Wilk test. Differences between parametric values as well as blood and CMR parameters were assessed by paired and unpaired t-tests or respective non-parametric tests if data were not normally distributed. Due to the low number of only four patients in the control group and hampered statistics due to two patients in follow-up and two new patients requiring both, paired and unpaired t-tests, their data will just be reported. To determine statistical associations between the different parameters, Pearson correlation for normally distributed or Spearman correlation analysis for not-normally distributed data was performed. In the end, receiver operating characteristics were used to generate cut-off values to identify more pronounced elevated pericardial values above the third quartile.16 A p value less than 0.05 was considered statistically significant.
Results
Patient characteristics
T1 mapping was performed in all subjects and T2 mapping was performed in 13 patients due to retrospective data collection. In addition to acute pericardial inflammation, seven patients showed myocardial involvement and four patients constrictive pericardial inflammation. Pericardial effusion was present in six patients. Most patients with myocardial involvement presented with regional LGE uptake and either hyperintensity in T2-weighted images or elevated T2 values according to Lake Louise criteria and published literature on normal T2 values.8 14 Pericardial inflammation had different causes such as reactive pericarditis after ST-segment myocardial infarction, pure infection or comorbidities such as lymphomas. Baseline characteristics of the study population are summarised in table 1. Five patients presented with a reduced left ventricular ejection fraction (LVEF, below 50%). Regarding laboratory parameters, 9 patients showed an elevated level of troponin (≥0.014 ng/mL), 16 patients showed an elevated N-terminal pro-B-type natriuretic peptide (NTproBNP, ≥125 ng/L), 15 patients showed an elevated C reactive protein (CRP, ≥5 mg/L) and 3 showed an elevated creatine kinase (CK, ≥170 U/L).
Baseline characteristics of the study population
CMR characteristics
All patients presented with pericardial hyperintensity in T1-weighted/T2-weighted imaging and pericardial LGE.
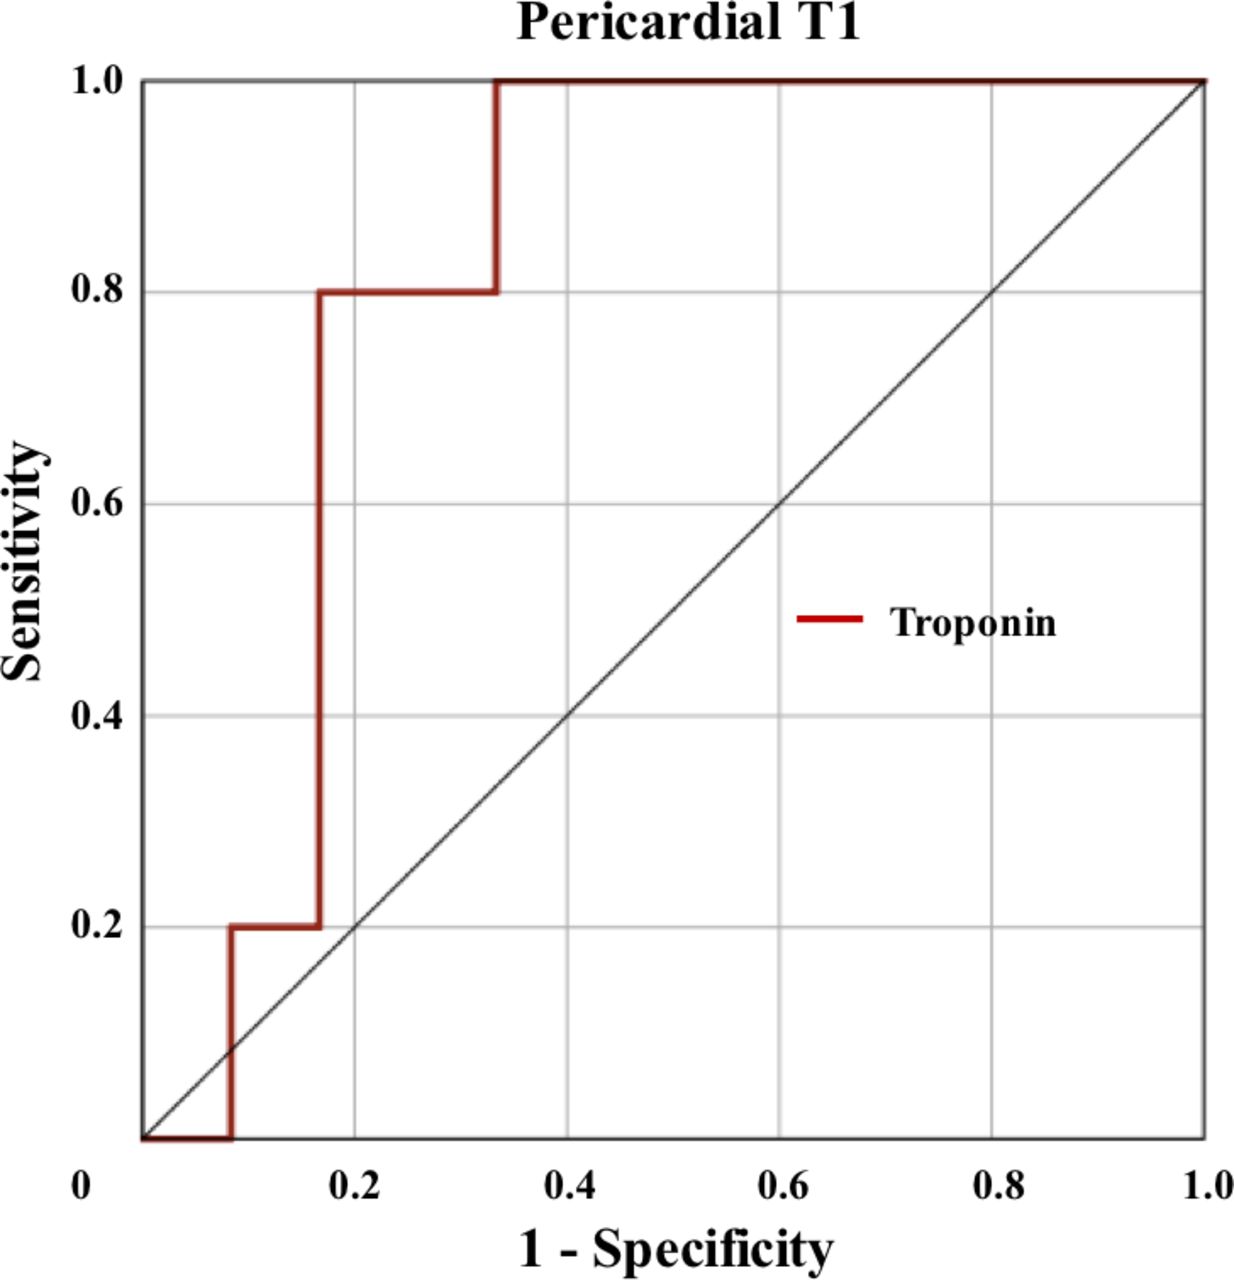
On average, the mean thickness of the pericardium was 4.8±1.0 mm (range: 2.9–7.1 mm). Mean pericardial T1 mapping value was 1363.0±227.1 ms (median 1346.82 ms) with an average ROI voxel size of 16.7±5.8. This was higher than myocardial values in the septal ROI (myocardial T1 mapping 998.7±81.0 ms, p<0.001, median 1014.46 ms) (figure 2). Patients with pericardial effusion exhibited higher T1 values (1428.5±288.4 vs 1335±201.4). This did not reach statistical significance, potentially due to low numbers in the pericardial effusion group. In patients with myocardial involvement, myocardial T1 values were higher compared with patients without myocardial involvement not reaching statistical significance (no vs myocardial involvement: 976.6±86.7 vs 1039.8±48.6 ms, p=0.075). According to recent literature, patients with myocardial involvement presented with higher T1 values (literature 975±25 ms).13 Compared with those patients with chronic pericarditis, patients with acute pericarditis showed elevated T1 values (chronic T1 values: 961.0±7.2 ms) (figure 3). Mean pericardial T2 mapping value was 123.3±52.6 ms (median 125.93 ms) and the average number of voxels was 25.4±19.2, which again was above myocardial values (myocardial T2 mapping: 68.0±28.9 ms, p<0.001, median 52.07 ms) (figure 2). Only two patients with pericardial effusion had T2 mapping. T2 values of patients with and without pericardial effusion were 113.1±34.1 and 125.1±56.4 ms, respectively. In patients with myocardial involvement, myocardial T2 values were higher compared with patients without myocardial involvement not reaching statistical significance (no vs myocardial involvement: 65.7±29.6 vs 70.2±30.6 ms, p=0.366). According to recent literature, patients with myocardial involvement presented with higher T2 values.14 15 Compared with those patients with chronic pericarditis, patients with acute pericarditis showed elevated T2 values (chronic T2 values: 63.2±10.1 ms) (figure 3). There was no difference in pericardial T1 and T2 mapping values comparing patients with isolated pericarditis and patients with additional myocardial involvement, as well as comparing patients with reduced LVEF to those with preserved LVEF. Both pericardial T1 and T2 mapping values showed a positive correlation to the extent of pericardial thickening (R=0.64, p=0.002 for T1; R=0.72, p=0.005 for T2) and among themselves (R=0.85, p<0.001). Pericardial and myocardial T1/T2 values did not correlate to the voxel sizes of the ROI. There was neither a correlation of pericardial T1/T2 values or pericardial thickening to blood markers of inflammation and myocardial injury (CRP, troponin, CK, NTproBNP) nor to further CMR parameters (left/right ventricular ejection fraction, left/right ventricular end-diastolic volume, left ventricular indexed mass). Myocardial T1 mapping values showed a significant correlation to NTproBNP (R=0.505, p=0.039). Only a troponin value≥27 ng/L predicted T1 values above the third quartile (1556.7 ms) with a sensitivity of 80% and specificity of 83% (area under the curve 0.82, p=0.045) (figure 4).

Comparison of mean pericardial and myocardial T1/T2 values. The third quartile of diseased, pericardial T1 was 1556.7 ms and of T2 was 158.5 ms. Normal values for myocardial parametric mapping were taken from literature (T1 values: 957±25 ms T2 values: 58.6±4.2 ms).9 14 28

Comparison of mean acute and chronic pericardial T1/T2 values.

ROC analysis to differentiate patients with elevated pericardial T1 values above the third quartile according to troponin levels. ROC, receiver operating characteristics.
Discussion
In this retrospective study, parametric T1/T2 mapping was able to support the diagnosis of pericardial inflammation by T1-weighted/T2-weighted and LGE imaging and showed a good correlation to the extent of the thickened pericardium, but did not correlated to further markers of cardiac inflammation or injury. As imaging of pericardial inflammation still remains challenging, this may strengthen the diagnosis of pericardial inflammation with the advantage of a preserved CMR duration, especially in patients in which contrast administration is hampered.
Nowadays, myocardial tissue characterisation in CMR has become even more advanced due to a parametric mapping techniques and their expanding use in daily clinical practice.17 18 T1 mapping serves for the quantification of myocardial T1 relaxation times. High values are observed in the presence of diffuse myocardial and reactive fibrosis (collagen), protein or water, lower values are observed in the presence of lipids and iron.19 Currently, the use of T1 mapping in the diagnostic process of acute myocarditis, clinical suspicion of amyloidosis (high values) or Fabry disease (low values) is rapidly growing worldwide.19–21 T2 mapping (quantification of myocardial T2 relaxation times) estimates myocardial water content. Therefore, T2 mapping is becoming an appreciated diagnostic tool for the detection of myocardial oedema.18 21 The main limitation of a global use of parametric mapping is that dedicated postprocessing is needed, which makes its use still restricted to modern CMR laboratories.17 18
Conventional T1-weighted and T2-weighted imaging is able to visually identify pericardial and myocardial inflammation. However, only parametric mapping offers quantification of myocardial relaxation values. From myocardial mapping studies it is already known that T2 mapping may identify patients with dilated cardiomyopathy and biopsy-proven inflammation when increased above a certain cut-off.22 A cut-off has as well been applied to identify patients with myocarditis who are at an increased risk of adverse events, for example, heart failure hospitalisation.10 This may help to grade pericardial disease severity as outlook for future studies.
From myocardial studies it is indicated that diseases with myocardial thinning with partial volume effects, such as dilative cardiomyopathy, are important factors leading to changes in parametric mapping values and causing alterations related to structural thickness even without changes in the tissue structure.9 23 Although parametric mapping has increasingly been used for the diagnosis of myocardial diseases, pericardial mapping is still hampered due to the thin nature of the healthy pericardium surrounded by high-intensity epicardial fat and medium-intensity myocardium.24–26 To further assess the clinical value of T1/T2 mapping beyond a convoluted way of measuring structural thickness, those parameters should be evaluated against each other and regressed for. This requires an increase of the resolution of parametric mapping techniques as partial volume effects can occur and adequate ROI positioning is hampered. An increase of the resolution was not achieved in the current study, but motion correction was performed before ROI positioning in T1 mapping to overcome partial volume effects and only thickened, diseased pericardium was analysed thereby excluding slices with thin pericardium, usually apical.12 27 In addition, two experienced observers with >1 and 3 years performed ROI positioning. The problem with partial volume effects also explains why no similar studies for a comparison of pericardial values exist.
The dependence on structural thickness could as well partially be seen in the linear relation of pericardial thickness and parametric mapping values although correlations were not strong. In the end, it remains unclear whether pericardial thickening causes a pure increase of pericardial, parametric values and whether partial volume effects play a relevant part. However, as parametric values did not show a clear correlation to the voxel size, the effect of partial volume effects is indicated to not play a substantial role in for the current results. As a future perspective, one aim should be the implementation of high-resolution parametric mapping for the acquisition of T1 and T2 values in a healthy control group without thickened pericardium. This is underlined by the fact the only four patients with chronic pericarditis were able to serve as an adequate control group. In patients with chronic pericarditis, an adequate ROI positioning was even more complicated, especially using T2 mapping.
For a better comparison among patients, the myocardial ROI size was chosen>20 pixels as suggested from literature.9 No recommendations for pericardial ROI sizes exist and therefore, a ROI size>10 voxel was pursued. In addition, T1-weighted/T2-weighted sequences and LGE were used to exclude pericardial effusion, epicardial fat or myocardium from the area of the ROI.
Myocardial T1 values were comparable to normal values from literature.9 28 Myocardial T2 values were above normal reference values.14 This might be due to the fact that three patients had exceptional high T2 mapping values (T2 of ≈ 100 ms). Quality control could not reveal obvious technical problems. One possible explanation could be that two of these patients had myocarditis as well, one had constrictive pericarditis. However, the exact cause of these values or an additional myocardial disease remains unclear.
Limitations
Our study is a preliminary report of a new approach in detecting pericarditis in a small number of patients using values of the T1 and T2 mapping in the inflamed pericardium. Further studies are needed to confirm our findings and to evaluate the predictive value of pericardial mapping techniques on a bigger cohort of patients and more homogenous aetiology of pericarditis, preferably as a multicentre study due to the few cases of pericarditis per single centre. Different types of scanners should be evaluated as T1 and T2 values can be influenced by the scanner type.9 Repetitive CMR scanning throughout the course of pericarditis should be pursued as well.
Limitations of our study are given by its retrospective design and the relative low number of included patients (acute and chronic pericarditis). This is also why only 13 patients had retrospective T2 mapping data available. In addition, only short axis slices were used to measure T1 and T2 values and no long axis views which may be useful to depict more precisely the pericardium and the connections with the surrounding tissues.
As patients had more often T1 mapping than T1 and T2 mapping together, there is still a small chance of T1 values describing pericardial fibrosis.24 Included patients had acute pericardial inflammation, T2 values were high and there was a strong correlation of T1 compared with T2 values. This makes increased T1 values due to pericardial inflammation more likely.
Conclusions
In conclusion, parametric T1 and T2 mapping is feasible and was able to strengthen the diagnosis of pericardial inflammation in the studied cohort of patients. So far, no evidence can be given on the severity of the inflammation using parametric mapping. Further studies need to be performed to evaluate the value of T1 and T2 mapping to overcome an additional LGE imaging and to assess its predictive value.
Data availability statement
Data are available upon reasonable request.
Ethics statements
Patient consent for publication
Ethics approval
The study was conducted in accordance with the Declaration of Helsinki. All data used for this study were acquired for clinical purposes. The study was conducted in a retrospective design. Written informed consent was waived by the institutional review board.
References
Footnotes
MG, JMS and MP are joint first authors.
Twitter @rmanka_
Contributors M.G.: conceptualization, methodology, investigation, collecting data, statistical analysis, writing- original draft preparation, reviewing and editing, responsible for the overall content as guarantor. J.M.S.: conceptualization, methodology, investigation, collecting data, statistical analysis, writing- original draft preparation, reviewing and editing, responsible for the overall content as guarantor. M.P.: methodology, investigation, collecting data, statistical analysis, reviewing and editing, responsible for the overall content as guarantor. A.G.: conceptualization, methodology, served as scientific advisor, critically reviewed the study proposal, reviewing. J.v.S.: conceptualization, methodology, served as scientific advisor, critically reviewed the study proposal, reviewing. H.A.: conceptualization, methodology, served as scientific advisor, critically reviewed the study proposal, reviewing. S.K.: conceptualization, methodology, served as scientific advisor, critically reviewed the study proposal, reviewing. R.M.: conceptualization, methodology, investigation, served as scientific advisor, critically reviewed the study proposal, original and revised draft, responsible for the overall content as guarantor. All authors have read and agreed to the published version of the manuscript.
Funding This study was funded by Deutsche Forschungsgemeinschaft (GA 2621/1-1). J.M.S. is a beneficiary of the Polish National Agency for Academic Exchange (NAWA) in ‘The Iwanowska Programme’ at the Department of Cardiology, University Hospital Zurich, Switzerland.
Competing interests None declared.
Provenance and peer review Not commissioned; externally peer reviewed.