Article Text

Abstract
Objective Short-term ambient fine particulate matter (PM2.5) is associated with adverse cardiovascular events including myocardial infarction (MI). However, few studies have examined associations between PM2.5 and subclinical cardiomyocyte damage outside of overt cardiovascular events. Here we evaluate the impact of daily PM2.5 on cardiac troponin I, a cardiomyocyte specific biomarker of cellular damage.
Methods We conducted a retrospective cohort study of 2924 patients identified using electronic health records from the University of North Carolina Healthcare System who had a recorded MI between 2004 and 2016. Troponin I measurements were available from 2014 to 2016, and were required to be at least 1 week away from a clinically diagnosed MI. Daily ambient PM2.5 concentrations were estimated at 1 km resolution and assigned to patient residence. Associations between log-transformed troponin I and daily PM2.5 were evaluated using distributed lag linear mixed effects models adjusted for patient demographics, socioeconomic status and meteorology.
Results A 10 µg/m3 elevation in PM2.5 3 days before troponin I measurement was associated with 0.06 ng/mL higher troponin I (95% CI=0.004 to 0.12). In stratified models, this association was strongest in patients that were men, white and living in less urban areas. Similar associations were observed when using 2-day rolling averages and were consistently strongest when using the average exposure over the 5 days prior to troponin I measurement.
Conclusions Daily elevations in PM2.5 were associated with damage to cardiomyocytes, outside of the occurrence of an MI. Poor air quality may cause persistent damage to the cardiovascular system leading to increased risk of cardiovascular disease and adverse cardiovascular events.
- Myocardial Infarction
- Epidemiology
- Electronic Health Records
- Biomarkers
Data availability statement
Data are available upon reasonable request. Data access to electronic health records from the University of North Carolina Healthcare System is through an internal data use agreement. PM2.5 data was obtained through collaboration with Drs Joel Schwartz (Harvard TH Chan School of Public Health) and Qian Di (Tsinghua University). For general data sharing inquiries, contact ward-caviness.cavin@epa.gov.
This is an open access article distributed in accordance with the Creative Commons Attribution Non Commercial (CC BY-NC 4.0) license, which permits others to distribute, remix, adapt, build upon this work non-commercially, and license their derivative works on different terms, provided the original work is properly cited, appropriate credit is given, any changes made indicated, and the use is non-commercial. See: http://creativecommons.org/licenses/by-nc/4.0/.
Statistics from Altmetric.com
WHAT IS ALREADY KNOWN ON THIS TOPIC
Exposure to particulate matter (PM2.5) is associated with cardiovascular-related mortality and increased risk of myocardial infarction (MI).
Limited evidence for elevations of cardiac-specific troponins (a highly sensitive indicator of cardiac tissue damage) in relation to short-term air pollution exposure.
Few studies have used cardiac specific troponins to assess air pollution associated impacts, particularly outside of a triggered MI.
WHAT THIS STUDY ADDS
Evaluation of the association between PM2.5 exposure and cardiac-specific troponins in a large cohort study.
Understanding of age, race and sex-specific associations which have yet to be evaluated.
Validation that associations between PM2.5 and cardiac-specific troponins are not solely driven by the occurrence of a clinically diagnosed MI.
HOW THIS STUDY MIGHT AFFECT RESEARCH, PRACTICE AND/OR POLICY
Our findings indicate that poor air quality may cause continual damage to the cardiovascular system leading to accelerated cardiovascular disease and increase risk of future adverse events.
Clinicians should consider communicating environmental health risks to patients who might be particularly sensitive to poor air quality, including those with a history of MI.
Introduction
Air pollution, particularly elevated concentrations of particulate matter <2.5 µm in diameter (PM2.5), is responsible for nearly 4 million deaths annually, of which over 2 million are cardiovascular related.1 PM2.5 has been repeatedly associated with cardiovascular events and mortality and is proposed to have a causal effect on the development of cardiovascular disease.2–4 Observations from animal and controlled human exposure studies have explored mechanisms through which short-term PM2.5 exposures prompt both acute cardiovascular events and disease progression by examining subclinical biochemical and physiological changes in response to PM exposure.5 Understanding factors that influence disease progression is important and one-way to assess progression is to use a proxy measure of cardiovascular damage outside of acute events, troponin.
Cardiac-specific troponins (troponin I and troponin T) are regulatory proteins that are released when damage to cardiac muscle cells occur. In normal conditions they occur in very small concentrations in the blood; however, insults that damage cardiomyocytes can rapidly increase the concentration of troponins in the blood.6 7 Elevation of troponin T can also be associated with damage to other tissues such as renal tissue. However, troponin I is only found in cardiomyocytes and is considered to be a highly specific biomarker for cardiac tissue damage.8 9 Elevated levels of these proteins can be used to detect the occurrence of a myocardial infarction (MI)10 and may also detect damage to the myocardium without meeting the clinical criteria of an MI.11 Despite the evidence that air pollution may cause continual damage to cardiac tissue, only a few studies have used cardiac specific troponins to investigate the damage that air pollution may cause outside of an MI. In a study of patients who underwent a cardiac catheterisation, short-term PM2.5 exposure was associated with significant increases in troponin T. Similar results for cardiac troponin I have been observed in both an observational study of healthy, young adults12 as well as a controlled exposure study of diesel exhaust particulates.13
Here we examine the association between short-term exposure to PM2.5 and the cardiac-specific troponin, troponin I, in a large cohort of MI survivors. We use a repeated measures analysis to estimate the immediate and delayed association between PM2.5 and troponin I. A novel aspect of this study is that it uses electronic health records to exclude time periods before and after the occurrence of an MI, in order to specifically examine effects outside of the occurrence of an MI, which will provide evidence on cardiac tissue damage from PM2.5 distinct from its known association with acute MI. Observations from this study should provide additional information on cardiovascular risks associated with short-term air pollution exposure.
Methods
Cohort and health outcome description
The participants in this study came from the Environmental Protection Agency Clinical and Archived records Research for Environmental Studies (EPA CARES) resource which has been previously described.14 15 EPA CARES is a collection of electronic health records from the University of North Carolina Healthcare System (UNCHCS), collected via a series of queries to extract patient data sets based on specific characteristics. These electronic health records are then cleaned and merged with environmental data to power a variety of environmental health studies using the detailed clinical phenotyping and longitudinal follow-up from electronic health records. Previous analyses of EPA CARES focused on patients with heart failure; however, this analysis examined a patient cohort of individuals with a prior MI. Patients were selected randomly from all patients who had a recorded MI in UNCHCS from 1 July 2004 until 31 December 2016, and then further restricted to those with troponin data available. As troponin data only became available in 2014 this restricted our patient cohort to individuals observed between 2014 and 2016. Figure 1 gives a flowchart of the cohort selection.

Inclusion and exclusion criteria used to select study population. cTnI, cardiac troponin I; MI, myocardial infarction.
Daily PM2.5 exposure was assessed using an ensemble model that included aerosol optical depth measurements from satellite monitoring, land use regression and ground based PM2.5 monitors. PM2.5 was estimated at 1 km×1 km resolution for the entire continental USA. This model had high agreement with ground-based monitoring with an R2 of 0.89 for the Mid-Atlantic region where this study takes place.16 We linked individuals with a prior MI to PM2.5 exposure based on their residential address at the time of troponin I measurement. Residential address was determined according to hospital records which were updated during patient interactions (eg, hospital visits).
The troponin I measurements used in this analysis came from the patient’s electronic health records. Troponin I data were only available from 2014 to 2016 were used, which is after the introduction of high sensitivity troponin measurements into hospital systems. However, since the exact method of measurement was not attached to patient records some measurements may have been taken under older troponin assays, though we expect this to be minimal. Though troponin T and troponin I are both used for diagnoses of MI and may be used as indicators of cardiomyocyte damage, troponin I was chosen as the primary endpoint over other forms since only troponin I is inherently specific for cardiac tissue, with high specificity for myocardial injury.17 18 Additionally, the use of a single biomarker simplified the data harmonisation and helped to prevent potential cross-assay biases.
This analysis focused on troponin measurements taken outside the period immediately before or after a clinically diagnosed acute MI. The primary exclusion period was defined by excluding troponin I measurements that occurred 7 days before or after a clinically diagnosed MI event, which was determined using International Classification os Disease, tenth revision (ICD-10) codes (I21.*, I22.*). MI events including MI or ischaemic damage cause large increases in troponin I concentrations that can remain elevated for days. The half life of troponin I is approximately 2 hours19 and blood concentrations typically return to baseline after 4–10 days.20 Assay specific information such as the manufacturer, assay kit and associated limit of detection for troponin I measurements was not recorded in the electronic health records. The minimum non-zero value observed within our data set was 0.01 ng/mL which is at or below most reference ranges for high sensitivity troponin I assays.21 Typical concentrations of troponin I are often and the limit of detection can serve as a cut-off for acute MI.21 For this analysis we retained all troponin values so as to not bias analyses by excluding healthy individuals with undetectable troponin I.
Statistical analysis
The association between daily PM2.5 and troponin I was examined using immediate (lag 0) and delayed (lags 1–4) PM2.5 effects assessed via unconstrained distributed lag models with a linear lag-response. As the troponin I distribution was skewed values were log-transformed prior to analyses. As undetectable troponin was reported as a value of 0 we added 0.001 (1/10 of the minimum observed value) to all values to avoid losing healthy individuals and biasing towards a less healthy population. Distributed lags for PM2.5 as well as time-varying meteorological variables allowed us to evaluate immediate (same day) and delayed effects. We also examined the 5-day average (average PM2.5 on lags 0–4) to determine if average air quality over the preceding days is associated with troponin I. Models were adjusted for sex, race, age at troponin I measurement, temperature, relative humidity and census block group-level socioeconomic (SES) variables and included a random intercept for patient to account for repeated measurements. SES variables were based on the 2010 census and included median income, median house value, percentage of individuals on public assistance, urbanicity and percentage of households below the federal poverty line. Temperature and relative humidity were included as natural splines with 3 df.
In secondary analyses, we stratified models to assess potential effect modification by sex, race, age at first incidence of MI and urbanicity as all of these might be expected to modify the relationship between air quality and health outcomes. Greater associations have been observed in older and more rural patients in similar cohorts in this study region. Age at first incidence of MI was assessed for two age groups, <65 years and ≥65 years. Urbanicity was evaluated for patients residing in fully urban (100% urban) and less than fully urban (<100% urban) areas.
Sensitivity analyses were performed to assess the robustness of PM2.5 estimates with respect to the time window around MI events excluded from analyses, lag consideration, dose-response relationship, adjustment for a time trend and troponin I values above and below the median patient troponin I level. Models using rolling averages in 2-day intervals, and the average of the 5-day period before troponin I measurement were used to evaluate cumulative effects. Sensitivity to non-linear associations with PM2.5 were also examined by substituting the linear term for PM2.5 in the main model with a natural cubic spline for PM2.5.
All analyses were performed using R (V.4.0.4).22 Results are presented as the per cent increase in troponin I per 1 µg/m3 increase in PM2.5 and the associated 95% CI.
Results
Characterisation of clinical cohort, clinical events and daily ambient PM2.5
As described in the Methods the study cohort was comprised of individuals who had a prior MI. There were 8677 individuals with a prior MI who had at least one recorded troponin I measurement. Mean troponin I across all measurements was 7.41 ng/mL. As this study was specifically interested in PM2.5 associations occurring outside of an MI, to construct the study cohort we excluded troponin I measurements in the week prior to and after a clinically diagnosed MI, leaving 2906 patients with 20 709 troponin I measurements (on average 7.1 measurements per patient). Mean troponin I in the final study cohort was 1.94 ng/mL for all measurements, reflecting the exclusion of elevated troponin I occurring during a clinically diagnosed acute MI. The average age was 69.4 years, 55.9% were men, 67.5% were white and 46.0% resided in a fully urban area (table 1). The average daily PM2.5 was 9.15 µg/m3 (table 2).
Descriptive statistics of the study cohort
Summary statistics (minimum [Min], 25th percentile, mean, standard deviation [SD], median, 75th percentile, maximum [Max]) of PM2.5 and meteorological variables
Associations between PM2.5 and troponin I
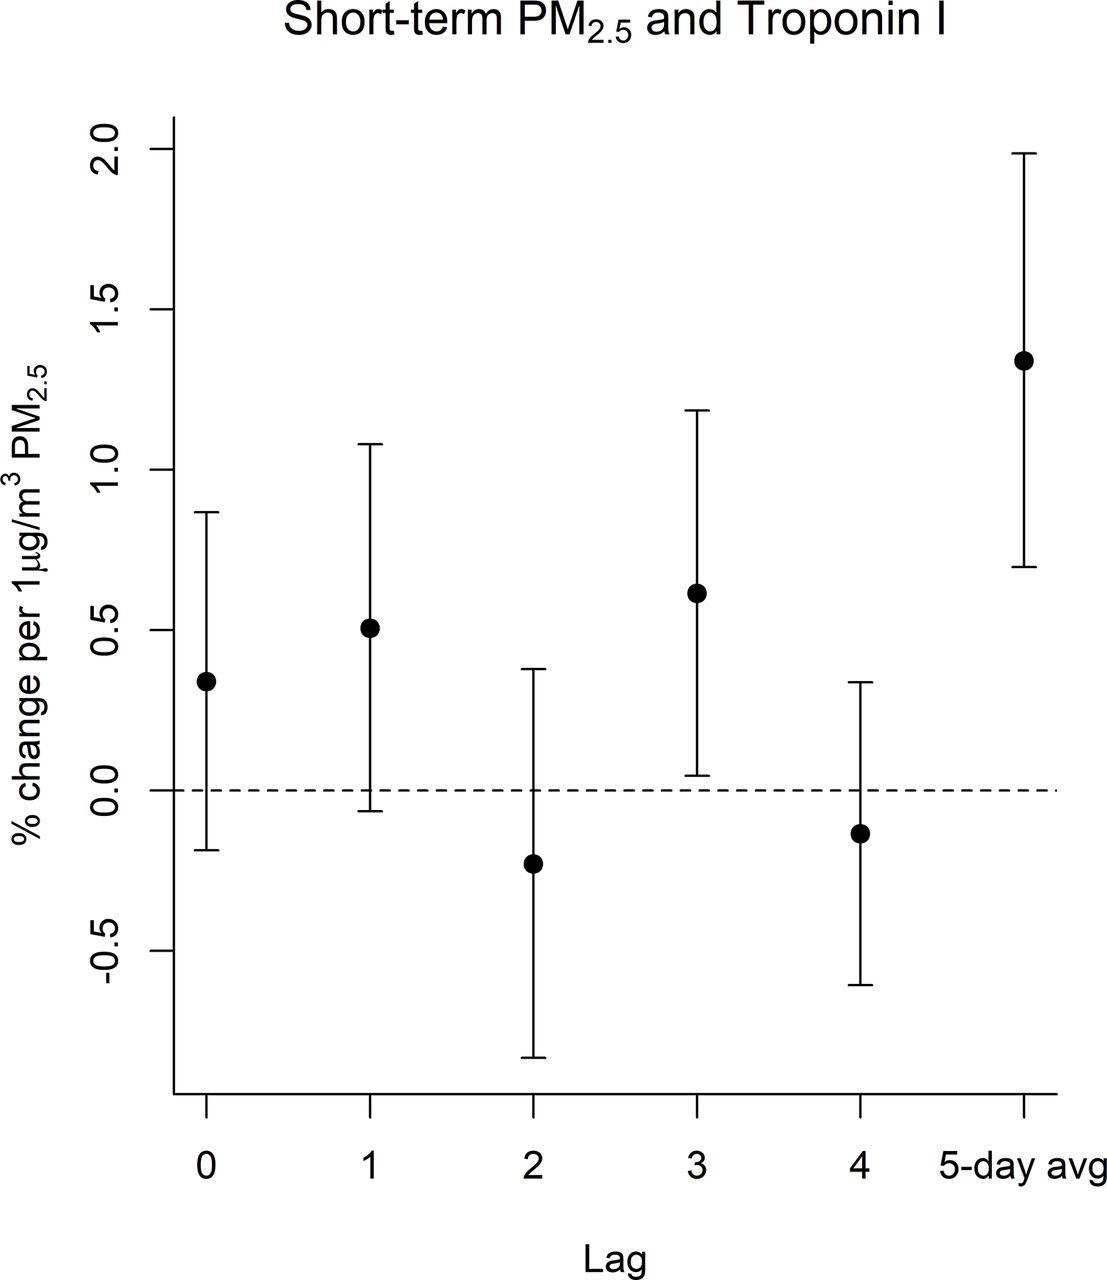
We observed evidence of an association between prior ambient PM2.5 and elevated troponin I. In distributed lag models with a linear lag-response, a 1 µg/m3 increase in PM2.5 was associated with an increase in troponin I at lag 3 (0.61%; 95% CI=0.05% to 1.19%). The associations with 1 was similar in magnitude but to lag 3, and no evidence of association was observed for the other lags. Associations with the 5-day average were stronger than associations with individual lags (figure 2, online supplemental table S2).
Supplemental material

Associations between PM2.5 and troponin I. Associations for lags 0–4 were estimated using distributed lag models with a linear lag-response. Associations for the 5-day average PM2.5 (5-day average) were estimated using a linear mixed effects model which was outside the distributed lag framework as there was only one ‘lag’ for that model. All models included a random intercept for individual and confounder adjustment as described in the Methods. PM2.5, particulate matter.
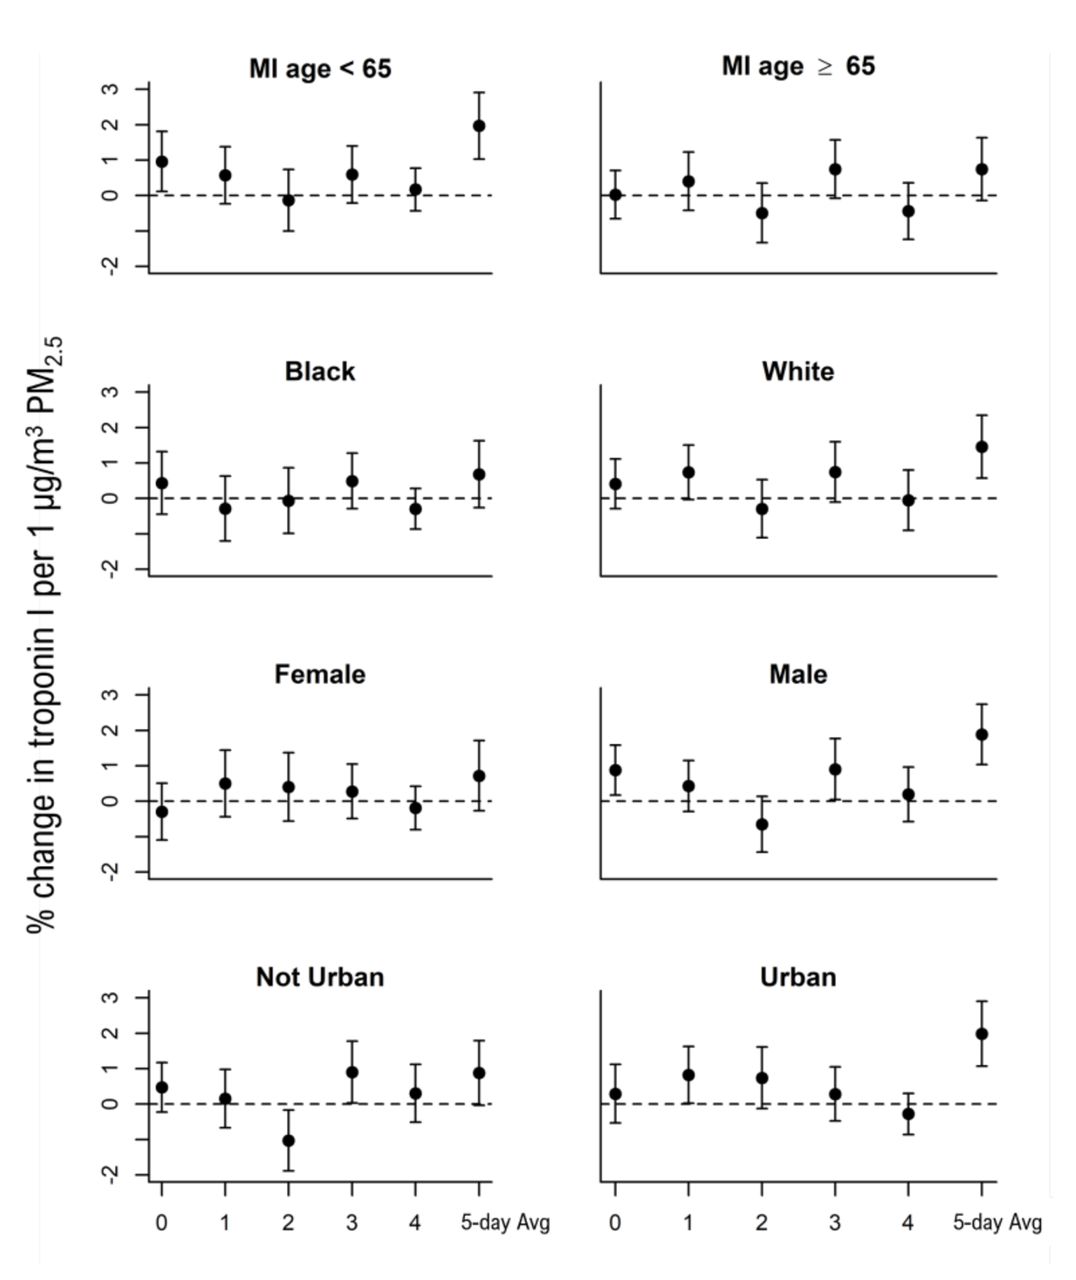
The association between troponin I and PM2.5 at lag 3 was particularly elevated among men (0.90% increase; 95% CI=0.04% to 1.77%) and patients who resided in less than fully urban areas (0.90% increase; 95% CI=0.03% to 1.78%). However, these differences were not seen across all lags. (figure 3, online supplemental table S1). For the 5-day average PM2.5 associations were strongest among men, white study participants, those with an age a first MI <65 years, and those whose average troponin I measurements were above the median for the study cohort (figure 3, online supplemental table S2). Individuals with underlying cardiovascular often have increased sensitivity to air pollution exposure. We examined this by stratifying based on an individual’s average troponin measurement being above versus below the median of the population. As compared with individuals with below median troponin I blood concentrations, those with above median concentrations had substantially elevated associations in both the distributed lag models as well as the 5-day average exposures (online supplemental table S1 and S2).

Associations between PM2.5 and troponin I stratified by demographics. Associations maintained the same confounder adjustment as described in the Methods except removing the stratifying variable from each of the stratified associations. Associations for lags 0–4 were estimated using distributed lag models with a linear lag-response. Associations for the 5-day average PM2.5 (5-day average) were estimated using a linear mixed effects model which was outside the distributed lag framework as there was only on ‘lag’ for that model. All models included a random intercept for individual and confounder adjustment as described in the Methods. PM2.5, particulate matter.
Sensitivity analyses were conducted to assess the strength of the observed associations under a variety of modelling scenarios. In addition to considering PM2.5 effect as linear we also examined non-linear relationships using splines with different df. Models with non-linear considerations did not provide model improvement and had similar results (online supplemental figure S1). Additional lags improved model fit as interpreted by Akaike information criterion (AIC) and Bayesian information criterion (BIC) and supported the main observation of a delayed impact of PM2.5 on troponin I concentrations (online supplemental table S3 and figure S2), and inclusion of a time trend did not meaningfully modify associations (online supplemental table S4). Associations also remained stable when increasing the window around a diagnosed MI from 7 to 14 and finally 30 days, and strengthened for some of the earlier lags (online supplemental table S5). When adjusting the distributed lag models for comorbidities we did not observe any change in the associations (online supplemental figure S3). When examining the association using 2-day rolling average PM2.5, we observed associations at lag 0–1 (1.15% increase; 95% CI=0.2% to 2.1%) (figure 4, online supplemental table S6). Two-day rolling average associations were strongest among men, individuals with a younger (<65 years) age a first MI, and those not residing in fully urban areas (online supplemental table S6). In models that measured the association on individual lag days, unadjusted for autocorrelation between days, associations mirrored what was observed in the distributed lag models with an even stronger association. Associations were seen for lags 1–4 with the strongest association (by magnitude) on lag 3—though only marginally so with substantially overlapping CIs for lags 1, 2 and 4 (online supplemental figure S4 and table S7).

A 2-day rolling average associations between PM2.5 and troponin I. A 2-day rolling average models used the same adjustment approach as the primary distributed lag models including a linear lag-response, random intercept for individual and identical confounder adjustment as described in the Methods. PM2.5, particulate matter.
Discussion
Our analyses demonstrate that short-term exposure to air pollution is associated with increases in troponin I in MI survivors. This association was most evident among men, white participants and those who were <65 years old when they had their first recorded MI. These results were robust to specification of the exposure period, individual lags versus rolling averages and are in line with previous studies as well as the wider body of scientific knowledge linking particulate air pollution and cardiovascular health. Troponin I is highly sensitive indicators of cardiac tissue damage. While there has been substantial effort placed on quantifying the cardiovascular risks faced by exposure to elevated air pollution, we still understand little about potential associations between poor air quality and continual damage to cardiomyoctyes outside of the immediate acute MI time period.
There have been a few previous studies of cardiac troponins and air pollution. In a study of 2732 participants, all of whom had a prior cardiac catheterisation, researchers observed that an IQR increase (7.6 µg/m3) in PM2.5 was associated with a 7.7% increase in circulating concentrations of cardiac troponin T on the day prior to measurement. This was similar to the associations observed on lag 3 in distributed lag non-linear models in our study (figure 2, online supplemental table S1) when scaled to the same PM2.5 exposure increment. For the model without distributed lags (online supplemental table S7 and figure S4), which closely matched their model, associations were even more similar for the day prior exposure. This indicates high congruence across these studies and also highlights that delayed effects of PM2.5 on troponin may become most apparent in models that account for multiple lagged effects like distributed lag models. The Zhang, et al study also observed that associations were slightly stronger among men and that associations were substantially stronger among less urban participants.23
In a smaller study of 73 non-smoking, younger (mean age 23.0) healthy adults, average PM2.5 over lag days 0–4 was associated with elevated troponin I.24 These associations between troponin I and PM2.5 closely match our own despite the cohort being significantly younger and having a lower mean troponin I measurement (1.0 ng/mL vs 1.9 ng/mL) likely due to our cohort being composed survivors of MI. Overall, these previous studies are consistent with our own observations that daily variation in PM2.5 is associated with increased circulating cardiac troponins indicating cardiac muscle tissue damage. Our study focused on cardiac troponin I as it is only released from cardiac tissue. Cardiac troponin T is found in non-cardiac muscle, though is still highly indicative of cardiac tissue damage. While the literature suggests that both cardiac troponins are elevated post-PM2.5 exposure, a systematic assessment of these troponins to compare associations and better elucidate potential mechanisms would enhance our understanding of the association between PM2.5 exposure and troponin release.
Air quality associations with troponin that exclude periods where elevated troponins may be driven by a clinically diagnosed MI are of particular interest because these associations would indicate continued damage to cardiac tissue mediated in part by poor air quality. In the study of patients who underwent a cardiac catheterisation, measurements that occurred up to 2 weeks following an MI were excluded.23 In the study of healthy Chinese adults, the young age and close monitoring make the occurrence of an unobserved MI unlikely.24 In the current study, we used electronic health records to specifically exclude measurements that occurred 1 week before or 1 week after the occurrence of an MI. While the use of ICD-10 codes to diagnose an MI is not perfect, it is a widely accepted standard and it is unlikely that an MI occurring during a period of troponin measurements would not be noted in the medical record. MI events not captured by ICD-10 codes would mostly likely also not be accompanied by troponin measurements and therefore still not present in our study. Thus, our study provides the latest, strongest evidence that the cardiovascular risks from short-term elevations in air pollution extend beyond the triggering event causing an MI and also includes continued cardiac tissue damage which may weaken the myocardium increasing risks of future cardiovascular events, such as heart failure and arrhythmia and potentially increasing sensitivity to future cardiovascular ischaemic events. Previous studies were not able to examine associations stratified by levels of circulating troponins. Individuals with elevated circulating troponins may have more underlying cardiac tissue damage and thus be more sensitive to the environment. We observed this in our study, adding to the literature suggesting that cardiovascular damage (or disease) is a sensitivity factor for PM2.5-related health effects.
There are multiple mechanisms that may account for the observed associations. As mentioned earlier, air pollution induced dysregulation of the autonomic nervous system may be a mechanism underlying the observed associations. Imbalances within the autonomic nervous system, particularly increased sympathetic activity, can cause myocardial tissue damage.25–27 In a controlled exposure study of healthy volunteers, authors observed that short-term exposure to diesel exhaust directly increased the activity of the sympathetic nervous system.13 Another mechanism may be increased oxidative stress and inflammation which has been proposed as one of the central hallmarks of exposure to environmental pollutants.28 Oxidative stress and inflammation are known consequences of PM2.5 exposure.29 Additionally, both of these outcomes are linked with myocardium damage30 and troponin release.26 31 32 In our associations we did not observe evidence of an immediate (lag 0 or lag 1) association between PM2.5 and cardiac troponins. Thus, potential mechanisms linking PM2.5 and troponin release should be able to account for delayed effects. Inflammation and oxidative stress can rise and remain elevated after PM2.5 exposure and thus may account for delayed effects of PM2.5 on troponin release. However, this should not be taken to exclude other mechanisms, even though with typically more immediate action such as autonomic nervous system modulation. In vivo mechanistic studies may be required to fully elucidate mechanisms and their relative contribution to these observed associations.
There are several strengths and limitations of this study. One of the primary strengths is the sample size. The current study eclipses the samples size of previous studies of troponin and air pollution both in terms of participants as well as number of observations. Additionally, this study focuses on individuals who survived an MI, a highly relevant patient population as individuals with previous cardiovascular events or underlying cardiovascular disease may be at increased risk for cardiovascular damage and have heightened environmental sensitivities. While the use of electronic health records allowed for extensive capture of disease diagnoses and hospital administered troponin measurements, the fact that we used only a single hospital system may limit generalisability. This is a limitation faced by all the current studies on troponin and air pollution, however studies in both USA and China-based populations have yielded highly concurrent results. Still, there is a clear need for geographically diverse studies on this topic. Medications usage has been reported to modify responses to air pollution. We did not examine medication usage in this study, but did adjust for comorbidities which would correspond with use of medications, for example, use of diabetic medications among those diagnosed with diabetes. There was not alteration in the associations observed (online supplemental figure S3), however future studies should more deeply explore the role of medications. The use of electronic health records also limited the demographic information available, such as information on income. However, we still applied a robust confounder adjustment and the study design, with a random intercept for each individual, is robust to time-invariant confounders. We did not extend this study to examine multipollutant exposures or other joint effects like temperature. However, these effects should certainly be examined in future studies with the geographical diversity to have populations exposed to multiple sources of air pollution. We used air pollution exposure models with high correlation with ground-based monitoring and high spatiotemporal resolution.16 These models have been used in previous studies14 15 33 including ones of troponin23 and allowed for uniform, daily capture of exposures for the entire study period which would not have been possible with monitor or other sensor data. However, these models do not fully capture personal exposures, only ambient exposure at the residence. Ambient exposures do still have high relevance given the amount of time spent at or near the primary residence, as well as the fact that public policy and federal regulations are often based on ambient pollutant concentrations and not personal exposures or inhaled doses.
Conclusion
In conclusion, this study adds substantially to a growing body of literature indicating that daily variations in ambient PM2.5 can mediate damage to cardiomyocytes potentially accelerating cardiovascular disease and increasing risks of adverse cardiovascular events. This study helps to resolve the relevant time periods of exposure as well as potential subpopulations that might have increased health risks. Future work should aid in establishing the biological mechanisms linking air pollution and myocardial tissue damage as well as establish the impact of exposure mixtures on biomarkers of tissue damage.
Data availability statement
Data are available upon reasonable request. Data access to electronic health records from the University of North Carolina Healthcare System is through an internal data use agreement. PM2.5 data was obtained through collaboration with Drs Joel Schwartz (Harvard TH Chan School of Public Health) and Qian Di (Tsinghua University). For general data sharing inquiries, contact ward-caviness.cavin@epa.gov.
Ethics statements
Patient consent for publication
Ethics approval
This study was approved by the institutional review board at the University of North Carolina at Chapel Hill (IRB# 17-0150).
Acknowledgments
We would like to thank Emily Pfaff and the staff at the Carolina Data Warehouse for Health for making this work possible. All funding for this work was provided by the US Environmental Protection Agency.
References
Supplementary materials
Supplementary Data
This web only file has been produced by the BMJ Publishing Group from an electronic file supplied by the author(s) and has not been edited for content.
Footnotes
LW and GK are joint first authors.
LW and GK contributed equally.
Contributors LW and CW-C conceived and designed the study. WC provided subject matter expertise input into the interpretation of evidence. QD, JDS and CW-C provided access to the data for the study; AMW, CW-C and JM cleaned, annotated and structured the data; LW, GK and JM managed the analytical data. LW and GK analysed the data and LW guided the analysis. LW, GK and CW-C wrote the first draft of the manuscript. LW, GK, JM, JDS, QD, DD-S, WC and CW-C critically contributed to the manuscript and approved the final draft. LW and CW-C are the guarantors. The corresponding author attests that all listed authors meet authorship criteria and that no others meeting the criteria have been omitted.
Funding This work was supported by internal US Environmental Protection Agency grants. The source of funding had no role in study design, data collection, analyses, interpretation and decision to submit the article for publication. This project described was supported by the National Center for Advancing Translational Sciences (NCATS), National Institutes of Health, through Grant Award Number UL1TR002489. The content is solely the responsibility of the authors and does not necessarily represent the official views of the NIH.
Disclaimer The research described in this article has been reviewed by the Center for Public Health and the Environment, US Environmental Protection Agency and approved for publication. Approval does not signify that the contents necessarily reflect the views and policies of the Agency, nor does the mention of trade names of commercial products constitute endorsement or recommendation for use.
Competing interests CW-C is a paid advisor for the Clock Foundation. The Clock Foundation had no involvement in any aspect of this work. The remaining authors have nothing to disclose.
Provenance and peer review Not commissioned; externally peer reviewed.
Supplemental material This content has been supplied by the author(s). It has not been vetted by BMJ Publishing Group Limited (BMJ) and may not have been peer-reviewed. Any opinions or recommendations discussed are solely those of the author(s) and are not endorsed by BMJ. BMJ disclaims all liability and responsibility arising from any reliance placed on the content. Where the content includes any translated material, BMJ does not warrant the accuracy and reliability of the translations (including but not limited to local regulations, clinical guidelines, terminology, drug names and drug dosages), and is not responsible for any error and/or omissions arising from translation and adaptation or otherwise.