Article Text

Abstract
Purpose In a comparator study, designed with assistance from the Food and Drug Administration, a State-of-the-Art (SOTA) ECG device augmented with automated analysis, the comparator, was compared with a breakthrough technology, Cardio-HART (CHART).
Methods The referral decision defined by physician reading biosignal-based ECG or CHART report were compared for 550 patients, where its performance is calculated against the ground truth referral decision. The ground truth was established by cardiologist consensus based on all the available measurements and findings including echocardiography (ECHO).
Results The results confirmed that CHART analysis was far more effective than ECG only analysis: CHART reduced false negative rates 15.8% and false positive (FP) rates by 5%, when compared with SOTA ECG devices. General physicians (GP’s) using CHART saw their positive diagnosis rate significantly increased, from ~10% to ~26% (260% increase), and the uncertainty rate significantly decreased, from ~31% to ~1.9% (94% decrease). For cardiology, the study showed that in 98% of the cases, the CHART report was found to be a good indicator as to what kind of heart problems can be expected (the ‘start-point’) in the ECHO examination.
Conclusions The study revealed that GP use of CHART resulted in more accurate referrals for cardiology, resulting in fewer true negative or FP—healthy or mildly abnormal patients not in need of ECHO confirmation. The indirect benefit is the reduction in wait-times and in unnecessary and costly testing in secondary care. Moreover, when used as a start-point, CHART can shorten the echocardiograph examination time.
- echocardiography
- electrocardiography
- heart failure
- arrhythmias
- cardiac
- heart valve diseases
Data availability statement
Data are available on reasonable request. The clinical data are for legitimate purposes on request. The Official Study Report can be obtained on request: info@cardiophoenix.com
This is an open access article distributed in accordance with the Creative Commons Attribution Non Commercial (CC BY-NC 4.0) license, which permits others to distribute, remix, adapt, build upon this work non-commercially, and license their derivative works on different terms, provided the original work is properly cited, appropriate credit is given, any changes made indicated, and the use is non-commercial. See: http://creativecommons.org/licenses/by-nc/4.0/.
Statistics from Altmetric.com
Key questions
What is already known about this subject?
In primary healthcare, there is a need for the early detection of cardiovascular disease including heart failure, one of the most difficult to diagnose. However, the standard rule-based ECG interpretation provides limited diagnostic evidence for common heart problems.
What does this study add?
The study indicates that Cardio-HART (CHART) assists the medical professional to determine if the symptoms may be related to cardiac abnormalities or establish some new risks that can lead to cardiac disease if not treated properly. This is especially valuable for patients with recurrent symptoms, which can be difficult to catch with the traditional ECG, or during the regular medical examination.
How might this impact on clinical practice?
As a result of more accurate and effective diagnostic capabilities, general physicians using CHART were more confident and certain of their decisions both in referrals to secondary care and, just as importantly, knowing when a patient can safely remain in primary care.
Consequently, patients are more likely to get timely access to care instead of being subjected to further testing and clinical visits to determine their cardiac status and prognosis.
Introduction
In the last decade, cardiovascular disease (CVD) has become one of the factors which threaten human health1 and is the main cause of death in the world.2–4 According to a report presented by the Global Burden of Disease Study, these diseases were responsible for 31.8% of all deaths worldwide.5 Representing a high impact in morbidity and cost to society, there is an urgent need to detect early signs of CVD including heart failure (HF) one of the most difficult to diagnose.6 In one multiperspective study ‘the difficulties with diagnosis, unclear illness perception, and management disparity’ were identified as critical aspects that may impact management of CVD which put in evidence the problem of the effective diagnosis of such life-threatening diseases.7
Misdiagnosis or delay in diagnosis of CVD is correlated with lengthened time to treatment, increased hospital stays, including high percentage of readmission, and a higher death rate which brings us to the point that ‘the early diagnosis is imperative’.8
Primary care is the initial contact point9 with the patient where CVD is first presented and suspected but all too often can go unnoticed or underdiagnosed, sometimes for many months. Underdiagnosis is not uncommon, as studies have found high prevalence rates of CVD in high-risk populations in primary care, such as elders short of breath, type 2 diabetes or chronic obstructive pulmonary diseases (COPD), make the process of identification of CVD all the more difficult.10 A review of malpractice claims in the USA revealed that failure to diagnose, which included failure, delay and wrong diagnosis, was responsible for over 41% of all claims against general physicians (GPs) and 48% against nurse practitioners.11 Further review of claims unmasked a possible common factor, an ‘inconclusive ECG’. Compouding the situation, every day, a large number of people with chest pain refer to heart centres with half of them without a real cardiac problem.
The economic burden of CVD on healthcare systems is significant. Hence, correct early diagnosis and appropriate treatment of these patients on initial presentation to their primary care clinic makes it a challenge not only for physicians and hospitals but also for governments, health-insurance companies and health maintenance organisations.12
Focusing on this goal, the demand for innovative diagnostic methods for CVD is continuously developing, particularly challenging is the diagnosis of HF, especially in primary care. Therefore, the current diagnostic approach in adults that relies mainly on the use of ECG as the primary diagnostic tool in primary care could be further refined and improved.
Addressing this last objective and to reduce the economic burden from false positive (FP) and false negative (FN) patients, a clinical study was conducted using a new breakthrough medical device that has shown evidence related to improving diagnostic effectiveness in clinical situations, including primary care. Improved diagnostics are achieved through the clever use of novel biosignals processed by Artificial Intelligence techniques to assist GPs in the diagnosis of CVD. It is a direct substitute for ECG devices in the standard of care.
Methods
Comparator devices approach
In each of the study locations, the State-of-the-Art (SOTA) 12-Lead Standard ECG devices that was in daily use was used as the comparator. As Cardio-HART (CHART) includes automated diagnostic processing, the local ECG devices lacking such functionality, were also augmented with the leading automated diagnostic algorithms to assist GPs in interpretation of ECG signals. The resulting output is in the form of a diagnostic report.
CHART uses novel technology in the analysis of the heart biosignals. The CHART system differs from the SOTA ECG devices in that it combines the functionality of three heart devices into one, including ECG, Echocardiography (ECHO) and Auscultation. As a result, it can detect 143 heart parameters and 47 heart findings associated with ~95% of all common heart diseases prevalent in clinical situations. The resulting output is in the form of an easy-to-grasp report for use by clinicians.
This study demonstrates GP diagnostic effectiveness through a direct clinical comparison between the comparator ECG devices, representing the current standard of care and the CHART device, a breakthrough technology.
Study design
The study was conducted as a multicentre clinical study to confirm the functional and operational aspects between two medical devices competing head-to-head against each other, CHART versus SOTA ECG, in clinical practice to determine which provided the most beneficial clinical decision support for GPs and best outcomes for patients. The results for each patient were verified and validated in accordance with its intended performance by a separate team of cardiologists to ensure an accurate ground truth.
Each patient willingly gave their consent, in writing. Both devices are non-invasive and were considered low risk.
The goal was to determine the utility of CHART and its usability for its intended use, in a clinical environment, by its intended users, in a study population representative of the target population, in direct comparison to a SOTA ECG device used within the Standard of Care for Primary Care. The study was designed to collect the data to confirm the safety and effectiveness of the CHART system when compared with ECG. A total of 550 patients were recruited into the CUUS, and their clinical results evaluated to measure the diagnostic and decision support capability of the SOTA ECG report when directly compared with the CHART report.
The results confirm that in many ways CHART analysis is far more effective than ECG only analysis. FN rates are significantly decreased (CHART produced a 15.8% decrease in FN) and FP rates decreased by 5% (FP in the patient referral decision by GP as compared with ECG-only based decisions). The data collected would confirm the hypothesis that CHART analysis is more effective than ECG only analysis in assisting the general practitioner (GP) in determining their referral decision (Send/Don’t Send) and the basis for it.
The setup for the study was to assign two independent GPs to each patient. Each GP would independently examine the same patient then render their diagnosis based on the device they were assigned in the protocol. One GP would be using CHART and the other GP would be using their local SOTA ECG device augmented with automated algorithmic assessment. Each patient would first be tested using the ECG device then the CHART device. Two diagnostic reports were then produced, one for each protocol. Each GP, based on their protocol device, was to diagnose the patient’s cardiac status and determine a course of action. In this way the patient is the control, being the same patient for both GPs. At the mid-point of the study, the GPs were switched to the other device/protocol.
The first decision by the GP’s was to render a diagnosis based on their understanding of the patient’s cardiac status. From this they were to determine whether the patient was to be referred to cardiology or not. This was the ‘Send’/‘Don’t Send’ decision. If Send, they were to indicate with what priority, whether urgent, immediate or routine. If Don’t Send, they were to indicate whether patient was normal, or be indicated for a control visit, at 3, 6 or 12 months.
See online supplemental file 1 for more details.
Supplemental material
Primary hypothesis
The goal was to directly compare two cardiac diagnostic systems to each other to characterise their effectiveness and utility in providing diagnostic assistance to GPs. The referral decision was used to measuring the effectiveness of the decision, see table 1.
Referral decision tree
Referral decisions were made by two different GP’s, based on either ECG-only or CHART analysis, for the same patient and evaluated through statistical analysis of comparison to establish the certainty of the decisions and understanding of the diagnosis.
Results
Patient statistics
The study involved both male and female patients, distributed equally, with at least three risk factors for heart disease,13 attending a primary care clinic for health reasons, including annual physical examination, that is, a typical primary care setting. The minimum target sample size was 500 patients of which at least 15% should be considered as healthy patients (no risk factors). The age distribution is: 61 patients between 20 and 40 years, 130 between 41 and 55 years, 156 between 56 and 65 years, 148 between 66 and 75 years and 52 above 76 years. The obesity distribution is: 6.2% underweight, 35.8% normal, 34.7% overweight and 23.3% obese.
Reference referral decision
The reference referral decision defined by cardiology-consensus was based on three factors, risk, ECG and an ECHO examination (transthoracic echocardiogram). Each of the ground truth decisions was established by a minimum of three independent cardiologists. The average consensus performance of the binary referral decision (cardiologist’s agreement for Send/Don’t) was 87.5% and for priority/watch detailed decision was 60.6%. These numbers were expected and comparable with the known measurement variability of ECHO assessment14 15 or ECG.16
The overall reference send rate was 43.0%, which is an important cardiac condition property of the included patient population. This referral to cardiologist care rate is similar to that of other studies, confirmed by the literature, with a typical range of 30%–50%.17–20
Referral decision results
The GP decision referral performance was based on either the ECG or CHART reports, presented in table 2. In the statistical calculation for the reference decision was the consensus-based ground truth.
Performance of GP referral decision on ECG and CHART reports compared with by consensus ground truth
The significance is derived from confidence intervals: if the observed value is higher than the upper confidence value, then it considered a significant increase. Less significant increase means there is an increase in the observed value, but it is not higher than the upper confidence value.
Figure 1 illustrates the performance evaluation and comparison of GP referral decision between ECG-based and CHART-based answers. CHART-based decisions showed higher accuracy compared with ECG-based decisions, especially its sensitivity which CHART showed a big increase. CHART also decreased the FP rate from 21% to 16%, and FN rate from 50% to 34%. The significant increase of positive predictive value, negative predictive value, kappa, area under the curve and LR+ and decrease of LR− confirms the benefit of using the CHART report over the ECG only report.

Performance of GP decision by consensus ground truth. (A) Binary confusion matrix on ECG report, (B) binary confusion matrix on CHART report, (C) performance metrics with confidence intervals, (D) estimated ROC curve based on the detailed referral decision. AUC, area under the curve; CHART, Cardio-HART; GT, ground truth; GP, general practitioner; LR+, positive likelihood ratio; LR−, negative likelihood ratio; NPV, negative per cent agreement; PPV, positive per cent agreement; ROC, receiver operating characteristic.
The positive rate (PR) or send rate by GPs is similar between ECG and CHART reports (PR%=33% by ECG and PR%=36% by CHART), however CHART’s send rate is closer to the ground truth (PREV%=43%). This means that the send rate of the GP referral decision using CHART met with the cardiologist expectations as confirmed by the ground truth. This includes a reduction in FP but also an increase in TP from FNs that were missed in ECG-based decisions.
Interestingly, the overall number of patients referred didn’t really change, as normal patients are replaced with patients with potentially abnormal cardiac function.
GP and referral cardiologist diagnosis results
The CHART assessment was performed twice, first in primary care (CHART#1 and ECG reports), and again in cardiology care (CHART#2 report), prior to the ECHO examination. The typical delay between the two tests is 3–15 days.
The relevant CVD diagnosis was compared between four cases: (1) GP diagnoses on ECG report, (2) GP diagnosis on CHART#1 report, (3) the over-reading cardiologist (ORC) diagnosis that included ECG, then CHART#1, and (4) the referral cardiologist (RC) diagnoses that included ECG, CHART#1 and CHART#2 report. Table 3 lists the diagnostic findings based on either ECG or CHART reports.
Diagnostic points used in CUUS at GP and RC diagnosis forms
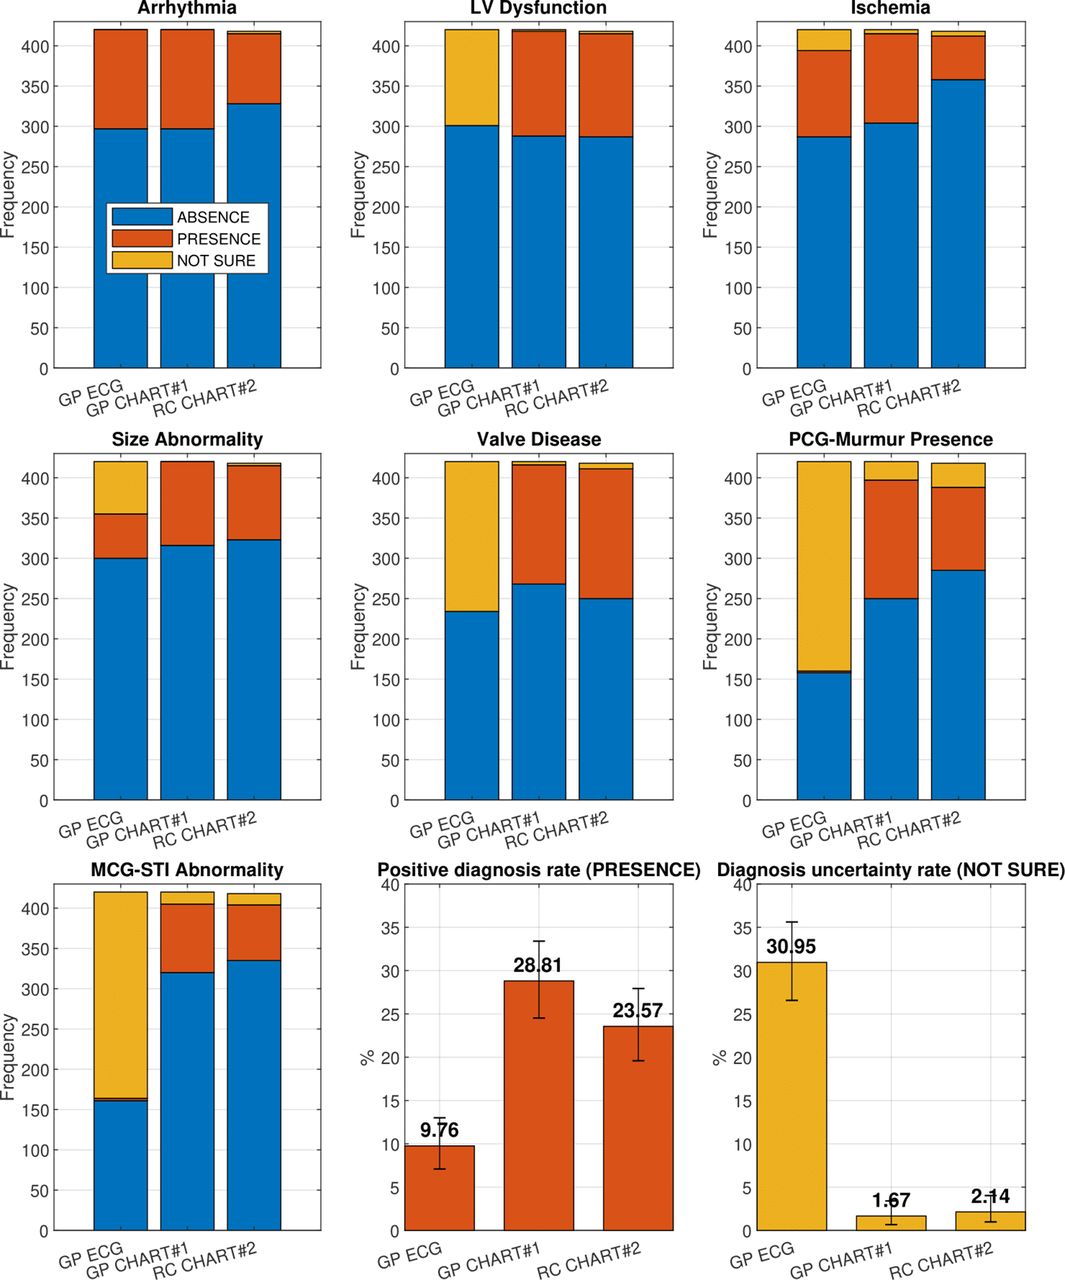
Figure 2 summarises the three types of diagnosis, where the three colours represent the rate of ‘absence’, ‘presence’ and ‘not-sure’ answers. The GP’s positive (number of abnormal or presence) diagnosis rate shows a significant increase, from 9.8%–23.6% to 28.8% by CHART compared with ECG based assessment. The uncertainty rate measured by the number of ‘not sure’ answers—show a significant decreased, from 30.9—1.7% to 2.1%.

Statistics of the medical findings diagnosis between the tree groups: GP on ECG, GP on chart and RC on chart. CHART, Cardio-HART; GP, general practitioner; RC, referral cardiologist.
The RC’s uncertainty rate on CHART#2 is small, but significantly, is similar to that of the GP on CHART#1. The RC’s positive diagnosis rate on CHART#2 is (23.6%) which is in line to GP’s positive diagnosis rate on CHART#1 (28.8%), which is significantly more in agreement when compared with ECG at (9.8%).
A notable outcome in table 3, between arrhythmia and ischaemia categories is that being typically ECG-based findings, they showed similar results between ECG and CHART, but with CHART showing much less uncertainty when used. In the structural abnormality category the results are mixed, when using ECG there was high uncertainty, but when using CHART there was high certainty (decreased uncertainty). These results are not surprising as ECG has low sensitivity for these conditions, that are typically confirmed with ECHO.
The rest of the diagnostic points (valve disease, murmurs and systolic time interval findings) are only supported by CHART, which dispels all the uncertainties observed with use of ECG.
Decision agreement between GP, ORC and rC
In the agreement statistics, the GP to ORC and GP to the RC decision were compared on the same patient, based on their ECG and CHART reports, see table 4.
Agreement performances calculated between GP and ORC decisions and GP and RC decisions
In the case of CHART, the decision agreement between GP and ORC is significantly higher compared with ECG (figure 3A). This suggest that when CHART is available to GPs, the over-reading role might be less necessary. Notably also, the agreement comparison between GP and ORC is also similar to that of GP and RC (figure 3B). In clinical practice, the consequences of this means that RC’s will get fewer Normal patients, patient that don’t need echocardiology.

Agreement performance analysis of (A) GP decision versus ORC decision, (B) GP decision versus RC decision. CHART, Cardio-HART; GP, general practitioner; NPA, negative per cent agreement; NPV, negative predictive value; ORC, over-reading cardiologist; PPA, positive per cent agreement; PPV, positive predictive value; PR, positive rate; RC, referral cardiologist.
Physician interview results
Comparison between ORC and RC
ORC and RC were asked to compare ECG and CHART reports. The following results were observed based on 522 answers set on 8 questions, see table 5. The results for ORC and RC are very similar in all the questions, they confirm each other.
Interview results for comparison ECG over CHART questions and CHART as a start point for ECG questions
The benefit of CHART is twofold, on the one hand, it provides better cardiac status diagnostics, and on the other hand it provides more reliability due to its wider range of parameters and findings. As such, CHART increases the certainty (reduces uncertainty) of decisions aided by its findings.
Chart as start point for ECHO
RC were asked to evaluate the CHART report to show how useful it could be in providing an appropriate start point to an ECHO examination, thereby avoiding a ‘cold start’. The following results were observed based on 391 answers set on 3 questions, see table 5.
CHART-findings based on ECHO-findings are a good indicator as to what kind of heart problems, comorbidities, that can be expected (the ‘start point’) during the ECHO examination. Aware of the big picture and range of comorbidities can help shorten examination times and reduce the probability of undiagnosed or misdiagnosed conditions.
Discussion
GPs in Primary Care can be meaningful contributors to diagnosing heart disease when patients first present, enabling earlier detection of (CVD) onset and reduction in unnecessary and costly referrals to Cardiology. This will have significant benefits in terms of reduced wait-time, and more timely access to treatment.
The value of CHART stems from its HART/ECHO-findings as they bring to primary care morphological and functional characteristics to heart disease able to identify cardiac conditions that are typically only diagnosed by ECHO. This effectively bridges the technological diagnostic gap between use of ECG in primary care and use of ECG and ECHO in secondary care.
Part of the GP’s tasks was to indicate a priority when a patient was referred, ‘send’, to cardiology. A beneficial consequence of the use of ECHO-findings by CHART, is that they serve to establish a starting point for prioritisation of patients based on medical justification based on disease severity, urgency. Typically, referrals to secondary care are on a first come first serve basis, with patients in greater need provided a higher priority only when symptoms have become overt or acute. Such is the case of acute HF, where over 79% of all cases are typically diagnosed in Hospital. Yet, in the 6 months prior to their hospital diagnosis, 41% of these patients had visited Primary Care having at least one of three key HF symptoms that should have triggered an earlier assessment.21
The surprise consistency in diagnostic accuracy between the GP and the ORC (positive per cent agreement, PPA=67%, negative per cent agreement, NPA=81%), compared with ECG-based assessment (PPA=52%, NPA=77%) suggests that the over-reading role might be reconsidered when CHART is present. The pandemic has shown that change is needed given the budget pressures placed on healthcare, further study is warranted.
In the study, RCs performed a second CHART examination on initial patient presentation to cardiology. This allowed cardiologists to determine whether ECHO confirmation as indicated by the GP was in fact warranted. Replacing the standard ECG with CHART on patient presentation to cardiology would have several benefits. First, it would help identify patients that don’t need ECHO, currently a massive contributor to increased wait-times and backlogs. Second, it would help avoid a ‘cold-start’, as it is not uncommon for patients to present to cardiology with insufficient referral information and so help focus the cardiologist on a specific region of interest. For example, unless the referring GP specifically suggests HF in the referral, Cardiologists do not routinely consider HF during the Echo examination. As CHART can provide an understanding of both left heart side abnormalities (left ventricular hypertrophy, left atrial enlargement, mitral regurgitation and wall motion abnormality) and right heart side abnormalities (right ventricular enlargement, right atrial enlargement, tricuspid rergurgitation and pulmonary hypertension), a first use on initial patient presentation to cardiology can help identify areas of concern, including HF.
Accordingly, CHART is not a substitute for ECHO, nor is it intended as a surrogate to cardiologists but rather as a valid support for GPs in clinical settings. Yet when ECHO is not yet available, it can assist GP’s with determining patient pathway with more confidence and immediacy.
Limitations
The right side of the heart is less represented by the included ECHO-parameters and even less so by ECG, as such their place in the statistical results is limited. Nonetheless, right-side heart disease and its structural, functional abnormalities and related pulmonary disease comorbidities (COPD, COVID-19) have attracted growing attention. Right-heart side study through a biosignal approach shows strong potential. Further research is warranted to investigate in more detail the relationship between HF categories and right-side HF through the window of biosignals, risk factors, detectable abnormalities, COPD and other comorbidities and symptoms.
Conclusions
Originally designed with extensive inputs and specific design criteria from the Food and Drug Administration,22 23 the results of the CUUS study showed that the beneficial implications of this novel tech in primary care are significant, both from a clinical and economic perspective. The study results shows that CHART has the potential to enable effective widespread screening of patients for the early detection of CVD onset and resolve many ‘inconclusive ECG’ results thereby reducing both FN and FP in referral decisions.
Data availability statement
Data are available on reasonable request. The clinical data are for legitimate purposes on request. The Official Study Report can be obtained on request: info@cardiophoenix.com
Ethics statements
Patient consent for publication
Ethics approval
This study involves human participants and was approved by Ethics Committee of General Hospital Vrsac (ID: 01-759/2)/Ethics Committee of General Hospital Sombor (ID: 31-2707/2018-2). Participants gave informed consent to participate in the study before taking part.
References
Supplementary materials
Supplementary Data
This web only file has been produced by the BMJ Publishing Group from an electronic file supplied by the author(s) and has not been edited for content.
Supplementary Data
This web only file has been produced by the BMJ Publishing Group from an electronic file supplied by the author(s) and has not been edited for content.
Footnotes
Twitter @gbiondizoccai
Correction notice Author name Giuseppe Biondi-Zoccai has been corrected and affiliation 3 has been added.
Contributors SC and GBZ unrelated and independent of the clinical study, completed an independent review of the results of the clinical study. TS was the principal investigator and assisted with data and verification of ground truth. ES and ABS assisted with data and verification of ground truth. IK assisted in the statistical assembly and data preparations. IK is the guarantor, who is responsible for the overall content.
Funding Original Study was Sponsored by Cardio-Phoenix, and conducted by UVA Research and Development d.o.o. Serbia.
Competing interests GBZ: disclosure: consulted for Cardionovum, CrannMed, InnovHeart, Meditrial, Opsens Medical and Replycare. IK: disclosure: Director, UVA research, no other industry connections. TS: no relationships to Industry. ES: no relationship to industry ABS, no relationship to industry.
Provenance and peer review Not commissioned; externally peer reviewed.
Supplemental material This content has been supplied by the author(s). It has not been vetted by BMJ Publishing Group Limited (BMJ) and may not have been peer-reviewed. Any opinions or recommendations discussed are solely those of the author(s) and are not endorsed by BMJ. BMJ disclaims all liability and responsibility arising from any reliance placed on the content. Where the content includes any translated material, BMJ does not warrant the accuracy and reliability of the translations (including but not limited to local regulations, clinical guidelines, terminology, drug names and drug dosages), and is not responsible for any error and/or omissions arising from translation and adaptation or otherwise.