Article Text

Abstract
Objective We investigated the diagnostic performance of semi-quantitative hyperintensity on T2-weighted short-tau-inversion-recovery black-blood (T2W-STIR-BB) images in identifying active cardiac sarcoidosis (CS) in patients, and compared it with that of 18F-fluoro-2-deoxyglucose positron emission tomography (FDG-PET).
Methods This retrospective study included 40 steroid-naive patients (age 63.1±12.9 years, 20 men) diagnosed with CS who underwent both cardiac MRI and FDG-PET imaging. Active CS cases were defined as satisfying at least one of the following criteria for conventional indices: exacerbation of ventricular arrhythmia, newly identified advanced atrioventricular block, greater than 5% decrease in left ventricular ejection fraction on echocardiography, positive finding on gallium-scintigraphy or elevated levels of sarcoidosis-related serum biomarkers. T2W-STIR-BB images were semi-quantitatively analysed using a myocardium-to-spleen ratio (MSR). The diagnostic performance of T2W-STIR-BB and FDG-PET imaging for detecting active CS was investigated.
Results Thirty-three patients satisfied at least one criterion and were considered as having active CS. Thirty patients (75%) tested positive with T2W-STIR-BB imaging, and 25 patients (63%) tested positive with FDG-PET. The sensitivity, specificity, accuracy, and positive and negative predictive values for identifying active CS by semi-quantitative MSR on T2W-STIR-BB images were 79%, 43%, 73%, 87% and 30%, respectively. These results were statistically comparable to those of FDG-PET (70%, 71%, 70%, 92% and 33%, respectively).
Conclusions When using conventional diagnostic indices for active CS as the gold standard, T2W-STIR-BB imaging demonstrated comparable diagnostic performance to that of FDG-PET. The semi-quantitative analysis of high signal intensity on T2W-STIR-BB images using MSR was useful for detection of active CS.
- MRI
- cardiomyopathies
- diagnostic imaging
- positron-emission tomography
Data availability statement
Data are available upon reasonable request.
This is an open access article distributed in accordance with the Creative Commons Attribution Non Commercial (CC BY-NC 4.0) license, which permits others to distribute, remix, adapt, build upon this work non-commercially, and license their derivative works on different terms, provided the original work is properly cited, appropriate credit is given, any changes made indicated, and the use is non-commercial. See: http://creativecommons.org/licenses/by-nc/4.0/.
Statistics from Altmetric.com
Key questions
What is already known about this subject?
Hyperintensity on T2-weighted short-tau-inversion-recovery black-blood images (T2W-STIR-BB) of cardiac magnetic resonance reflects oedema and might be useful for evaluation of disease activity in cardiac sarcoidosis (CS).
What does this study add?
Using the conventional clinical definition of active CS as the gold standard, the radiographic diagnostic value of T2W-STIR-BB was comparable to that of 18F-fluoro-2-deoxyglucose-positron emission tomography (FDG-PET). Regarding the analysis of high signal intensity on T2W-STIR-BB images in identifying active inflammation detected by FDG-PET, semi-quantitative analysis using the myocardium-to-spleen ratio significantly improved sensitivity and accuracy compared with visual analysis.
How might this impact on clinical practice?
High signal intensity on T2W-STIR-BB images provided an additional non-invasive and radiation-free tool for evaluating CS activity.
Introduction
Sarcoidosis is a rare multi-organ system granulomatous disease of uncertain aetiology. Cardiac sarcoidosis (CS) is clinically evident in 2%–7% of patients, but autopsy and imaging series report a substantially higher occurrence of 25%–80%.1–4 Accurate evaluation of active myocardial inflammation in patients with CS is important in the development of a treatment strategy.
Conventional methods to evaluate active CS include observation of new atrioventricular block5 6 or ventricular arrhythmias,7 8 a gradual decrease in the left ventricular ejection fraction (LVEF) on echocardiography,9 10 a positive finding on gallium scintigraphy11 or presence of specific positive biomarkers,4 12 which are known to have low accuracy.
18F-fluoro-2-deoxyglucose positron emission tomography (FDG-PET) preceded by fasting has been used to identify active inflammatory changes in CS.13–15 There have been several reports showing the association between abnormal FDG uptake and clinical symptoms6–8 10 or high serum level of ACE.13 14 However, even with strict prior carbohydrate restriction, physiological FDG accumulation can cause a false positive.
Compared with FDG-PET, cardiac magnetic resonance (CMR) imaging is more accessible, requires a shorter period of prior fasting, lacks radiation exposure, and is less expensive. Late gadolinium enhancement (LGE) is the gold standard for the diagnosis of CS, which represents both fibrosis/scarring and active infiltrative granulomas. High signal intensity on T2-weighted short-tau-inversion-recovery black-blood images (T2W-STIR-BB) indicates still water in the myocardium, which points to oedema associated with inflammation.16 17 The sensitivity of hyperintensity on T2-weighted images for diagnosing CS (34%) was reported to be not as high as that of FDG-PET, with fasting longer than 18 hours (48%–100%, >70% in most studies except for 2 out of 13 studies that showed <70%), or LGE (59%–100%, >70% in most studies except for four out of 42 studies that showed <70%).5 18 However, additional T2-weighted images or FDG-PET is needed to differentiate active and fibrotic lesions, since LGE is seen in both.4 19 In addition, the association between atrioventricular block and abnormal septal hyperintensity on T2-weighted images has been reported as shown in that with FDG-PET.5 Thus, such hyperintensity may be useful in identifying active patients with CS, however, the relationship between hyperintensity on T2W-STIR-BB images and abnormal myocardial FDG uptake on PET or other conventional diagnostic methods has not been fully evaluated.
The purpose of this study was to investigate the diagnostic performance of hyperintensity on T2W-STIR-BB images semi-quantitatively analysed using the myocardium-to-spleen ratio (MSR) in identifying active patients with CS in comparison to FDG-PET.
Methods
Study population
In this retrospective observational study, we enrolled patients with clinically suspected CS who underwent both CMR and FDG-PET between 1 April 2012 and 31 December 2020. They were subsequently diagnosed as CS based on the Guidelines for Diagnosing and Treatment of Cardiac Sarcoidosis outlined by the Japanese Circulation Society (JCS2016 guidelines).4 Patients followed at Hospital A underwent all examinations except for FDG-PET. FDG-PET was performed either at Hospital B or Hospital C. Patients with any of the following characteristics were excluded: CMR imaging and FDG-PET were not completed within the same 3-month period, CMR imaging was not acquired using the same protocol at a 1.5 T imaging unit or with the same protocol as those we sought to investigate, poor quality of T2W-STIR-BB images, splenic involvement of sarcoidosis proven by FDG-PET or CT, significant coronary artery disease proven by coronary angiography or coronary CT, CMR imaging suggested other cardiomyopathy, and patients who had a history of steroid therapy. Patients did not receive any steroid therapy between CMR and FDG-PET. Results of electrocardiography, echocardiography, gallium-scintigraphy and laboratory data were collected. CS activity was defined as satisfying at least one of the following conventional criteria: (1) exacerbation of ventricular arrhythmic burden, including ventricular fibrillation, sustained or non-sustained ventricular tachycardia or newly identified advanced atrioventricular block on an ECG within the last 3 months; (2) greater than 5% decrease in LVEF on echocardiography within the last 6 months among patients who underwent serial echocardiography; (3) abnormal uptake of gallium in the myocardium (higher than blood pool) or (4) elevated level of one or more of the following serum biomarkers: ACE, lysozyme or soluble interleukin 2 receptor (sIL-2R). Two cardiologists with expertise in CS reviewed all cases.
Patient and public involvement
Patients were not involved in this research.
FDG-PET imaging
FDG-PET was performed at either Hospital B or Hospital C. Prior to image acquisition, all patients fasted for at least 16 hours with 4 hours of additional restriction of carbohydrate consumption. The 22 patients who underwent scanning at Hospital B received intravenous injection of 50 IU/kg of unfractionated heparin. Patients at both institutions received 3.7 MBq/kg of FDG 90 min prior to acquisition of PET images on a 64-slice PET/CT scanner using time of flight (Biograph mCT, Siemens Healthcare, Erlangen, Germany). Whole body scanning was performed in a craniocaudal direction from the mid-thigh to the skull base with a 2 min emission per bed position under 120 kVp and 50 mAs. CT images acquired with respiratory gating or shallow-expiration breath-hold were used as a transmission map for attenuation correction. Images were sent to our centre as DICOM data files. FDG uptake was measured using syngo.via (Siemens Healthcare). FDG uptake was defined as positive if it was greater than uptake in a physiologically normal liver20 and demonstrated a ‘focal’ or ‘focal on diffuse’ pattern of FDG uptake.21 Two experienced nuclear cardiologists who were blinded to the clinical characteristics of each patient analysed imaging data independently.
CMR imaging
Patients underwent CMR imaging at Hospital A using a 1.5 T scanner (Intera Achieva Nova Dual, Philips Medical Systems, Amsterdam, the Netherlands) using a Torso/Cardiac 32-channel coil for signal reception. All images were acquired with ECG gating and during repeated breath-holds. After acquisition of localising scout and T1/T2 cine images, T2-STIR-BB images were obtained (repetition time, two beats; echo time, 80 ms; field of view, 360 mm; scan matrix, 256×230; reconstruction matrix, 512×512) in multiple short-axis views with a 10 mm slice thickness that covered the entire left ventricle from the base to the apex and two-chamber or four-chamber views. The average number of obtained slices per patient was 8.8±1.3 for T2W-STIR-BB images. Except for one patient on dialysis who could not undergo imaging using gadolinium, contrast-enhanced images were acquired 15 min after intravenous administration of 0.15 mmol/kg gadolinium diethylenetriaminepentaacetic acid in the same view used for T2-weighted images.
Gallium scintigraphy
Patients received 148 MBq of gallium-67 citrate 48 hours prior to the acquisition of single-photon emission computed tomography and CT images of the whole body using a dual-detector gamma camera with a mounted CT scanner (Infinia Hawkeye f4, GE Medical Systems, Milwaukee, Wisconsin, USA). Images were visually analysed by two experienced nuclear cardiologists while blinded to the clinical characteristics of each subject. Gallium uptake was defined as positive if it was greater than that of the left ventricular blood pool.
Analysis of T2-STIR-BB images of CMR
Two cardiologists specialised in cardiac imaging who were unaware of the clinical history or PET findings visually assessed T2W-STIR-BB images in consensus to determine if abnormal high signal intensity areas were present in the myocardium. An experienced radiological technologist who works primarily on CMR imaging measured the MSR. A circular or oval region of interest (ROI) of 40 mm2 was placed in the myocardium and spleen on the same slice and the average signal intensity was measured. All T2-STIR-BB images were of sufficient image quality to be evaluated. When there was no visibly abnormal high intensity, the ROI was placed at the anterior, septal, posterior and lateral walls at the basal, mid and apical levels with short axis images (figure 1A). We used two-chamber or four-chamber views for analysis of the apex. If there was a focal area of high signal intensity in the myocardium, an ROI was placed in the area of hyperintensity (figure 1B). The MSR was defined as the signal intensity of the myocardium divided by that of the spleen. Artefacts from slow flow were carefully avoided when the ROIs were set. Based on our preliminary investigation to set a cut-off value of the MSR, which is detailed in online supplemental material, the cut-off value of the MSR was set at 0.58 according to two SD above the mean MSR of control subjects.22 If there was at least one segment with an MSR over 0.58, the patient was considered as positive.
Supplemental material
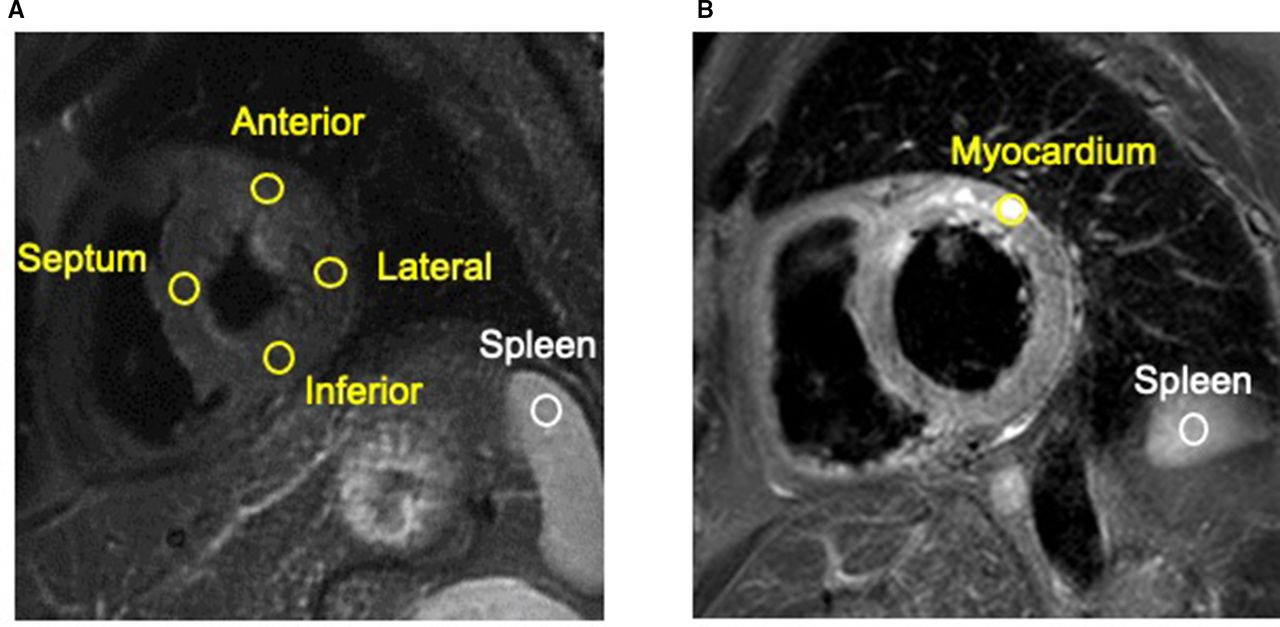
Representative images illustrating the MSR measurement method. (A) If there was no visibly abnormal high intensity, the ROI was placed at the spleen and the anterior, septal, posterior and lateral wall of the myocardium. (B) If there was a focal area of high signal intensity area in the myocardium, an ROI was placed in the area of hyperintensity within the segment. MSR was calculated as signal intensity of the ROI in the myocardium divided by that of the spleen. MSR, myocardium-to-spleen ratio; ROI, region of interest.
Statistical analysis
Continuous variables were expressed as the mean±SD if they were normally distributed and as the median (25–75 percentile) if they were not normally distributed. Categorical data were expressed as counts and percentages. An unpaired Student’s t-test was performed to compare continuous variables that were normally distributed and Mann-Whitney U test was used to compare those that did not follow a normal distribution. χ2 test and Fisher’s exact probability test were used to compare the proportions of gender, known extracardiac sarcoidosis, baseline medications, and findings in electrocardiography, echocardiography, CMR imaging and FDG-PET between those with and without abnormal findings from conventional diagnostic methods. Sensitivity, specificity, accuracy, and positive and negative predictive values of each diagnostic method were calculated on a patient-to-patient basis. McNemar’s test was performed for comparison of sensitivities, specificities and accuracies of different diagnostic methods in a paired analysis. For all analyses, a p value of <0.05 was considered statistically significant. All analyses were performed using IBM SPSS V.23.0 software (IBM).
Results
Patient characteristics of CS cohort
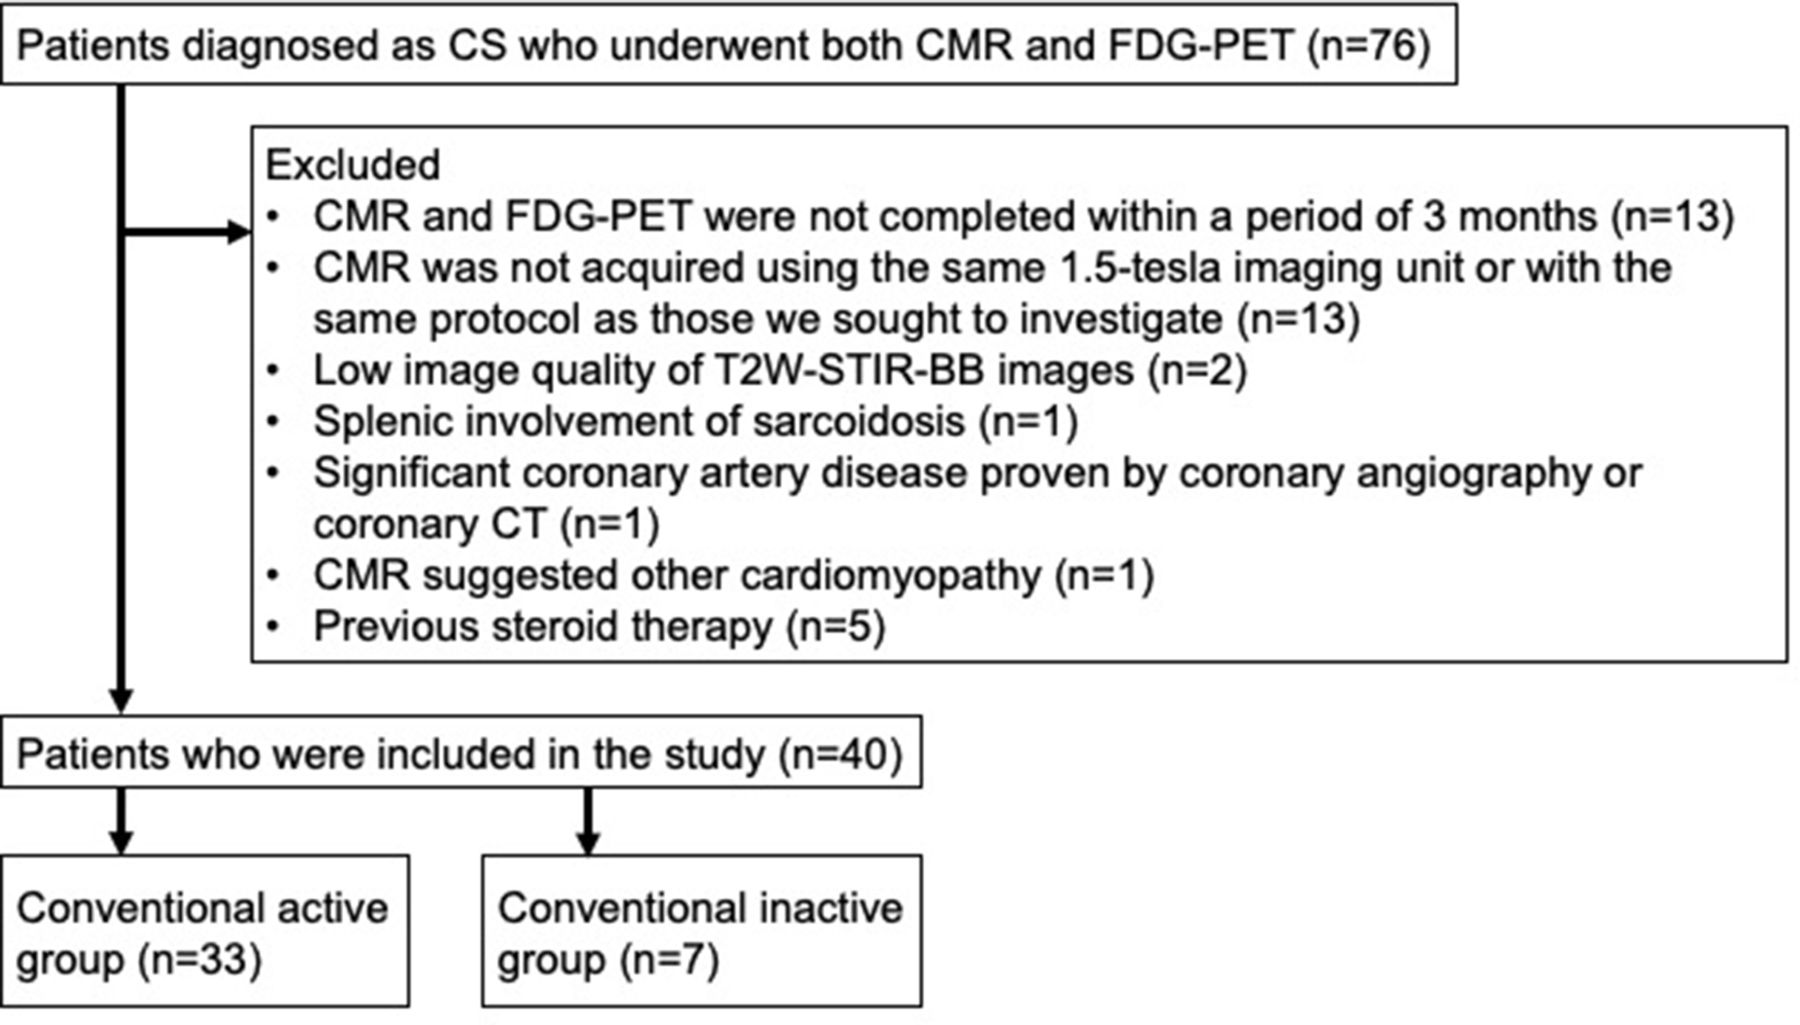
Figure 2 presents a flow diagram of this study. A total of 76 patients diagnosed with CS who underwent both CMR imaging and FDG-PET were initially identified. Of these, 37 patients were excluded because: CMR and FDG-PET were performed more than 3 months apart (13 patients); CMR was not acquired using the same 1.5 T imaging unit or with the same protocol as those we sought to investigate (13 patients); low quality of T2-STIR-BB images (two patients); splenic involvement of sarcoidosis was diagnosed from splenic nodules with CT and FDG accumulation (one patient); a different disease was diagnosed (two patients, one with idiopathic cardiomyopathy and one with significant coronary artery disease) or medical history included steroid use (five patients). Thus, 40 patients (63.1±12.9 years old, 20 males) were enrolled in the study. Baseline patient characteristics are shown in table 1.
Baseline characteristics of 40 patients included in the analysis

Flow diagram illustrating inclusion and exclusion of patients with suspected CS who underwent FDG-PET and CMR. CAD, coronary artery disease; CMR, cardiac magnetic resonance; CS, cardiac sarcoidosis; FDG-PET, 18F-fluoro-2-deoxyglucose positron emission tomography.
A total of 28 patients (70%) had extracardiac sarcoidosis. Extracardiac biopsy was performed in 17 of the 40 patients (43%), and specimens of five of these patients demonstrated pathological findings compatible with sarcoidosis. Three patients had MR compatible pacemakers implanted by the time of CMR imaging. There was no patient with an implantable cardioverter defibrillator at baseline.
Results of conventional methods
Results of electrocardiography, echocardiography, gallium scintigraphy and laboratory data are summarised in table 1. Advanced atrioventricular block and ventricular tachycardia were newly observed in 23 of the 40 patients (58%), and these patients were classified into the conventional active group. There was no significant difference in the number of patients with other ECG findings. Of the 40 patients included in the study, 14 patients were followed longer than 6 months with serial echocardiography tests before administrating immunosuppressant therapy. Of these 14 patients, a more than 5% decrease in LVEF was observed in seven patients (50%), and these patients were classified into the conventional active group. Of the 34 patients who underwent gallium scintigraphy, seven patients (21%) had abnormal myocardial gallium uptake. In addition, laboratory data were available for all patients, and 20 patients (50%) showed an elevated serum level of ACE, lysozyme or sIL-2R. Of the 40 patients included in the study, 33 (83%) showed at least one positive finding with conventional diagnostic methods that reflected CS activity (conventional active group), and the remaining seven patients (18%) did not (conventional inactive group). No gender or age differences were found between the conventional active and inactive group. Regarding echocardiography, LVEF was significantly lower in the conventional active group than in the inactive group (47.9%±16.0% vs 61.4±9.5%, p=0.039).
FDG-PET and CMR results
The results of FDG-PET and CMR imaging are shown in table 2.
Results of the FDG-PET and CMR studies in patients with CS
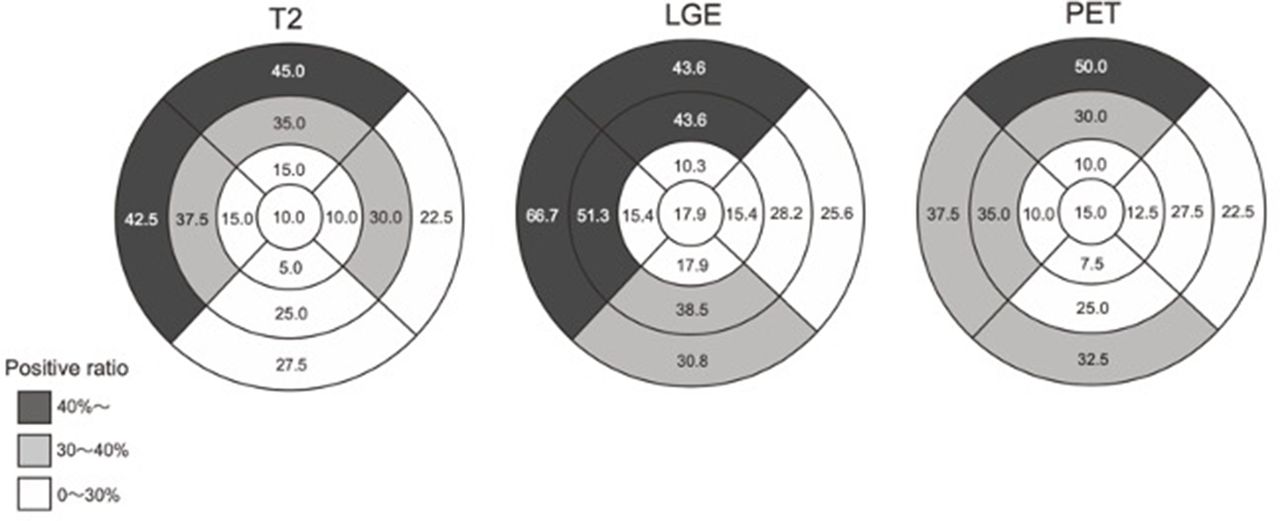
In all cases, MSR was successfully evaluated. T2W-STIR-BB images were positive for 30 (75%) patients when using quantitative analysis using MSR; however, only 25 (63%) were positive when using visual analysis. LGE compatible with CS was observed in all cases except one with renal failure, which precluded the use of contrast. Regarding FDG-PET images, 25 of 40 patients (63%) exhibited positive myocardial uptake of FDG. Figure 3 shows the distribution of segments with abnormal high signal intensity in T2W-STIR-BB images, LGE and FDG uptake in the patients with CS. More than 30% of patients showed positive high signal intensity on T2W-STIR-BB images and for uptake of FDG in the basal and mid-ventricular level anterior to the septal wall, whereas LGE showed more extensive distribution and was positive in the inferior wall as well as in the region anterior to the septal wall. Representative CMR and FDG-PET images from patients in the conventional active and inactive group are shown in figure 4.

Distribution of segments with abnormal high signal intensity in T2W-STIR-BB, LGE and FDG uptake in CS patients with CS. The numbers show the positive ratios in each segment. FDG-PET, 18F-fluoro-2-deoxyglucose positron emission tomography; LGE, late gadolinium enhancement; T2W-STIR-BB, T2-weighted short-tau-inversion recovery black-blood images.

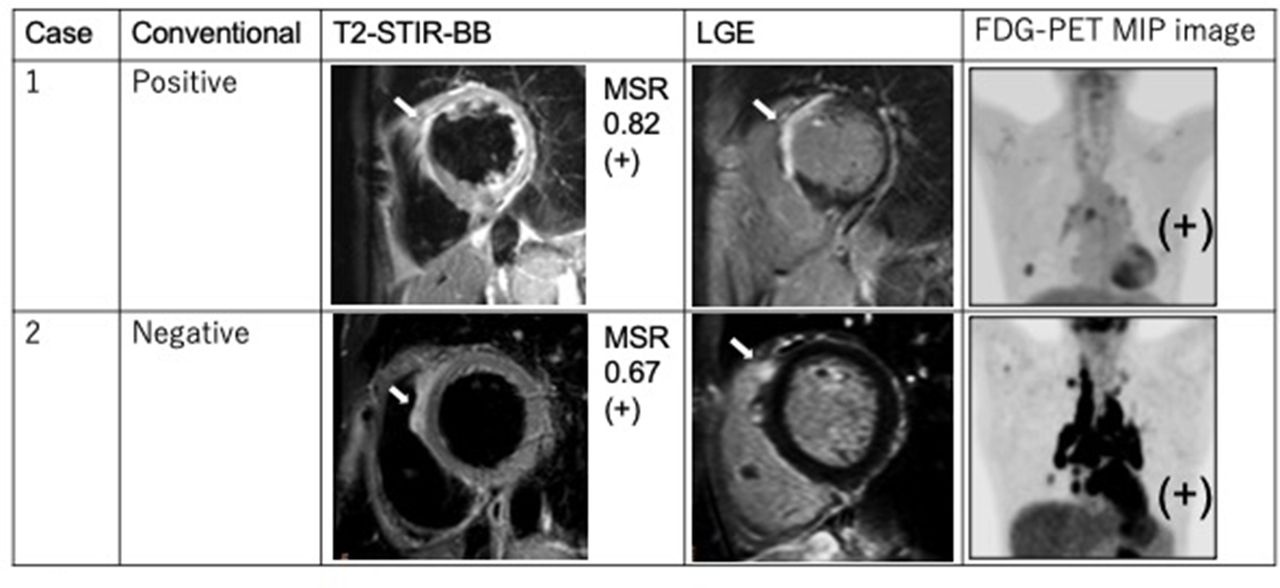
Representative CMR and FDG-PET images of the conventional active and inactive group. Case1: conventional positive case with all positives on T2W-STIR-BB, LGE and FDG-PET. The patient was in his/her 70s, with a familial history of sudden cardiac death of his/her child in his/her 40s. At first, his/her cardiac function was normal but then dropped to a left ventricular ejection fraction of 40% with asynergy and thinning in the anteroseptal wall. T2W-STIR-BB image is transmurally positive in the basal to mid-level of the anteroseptal wall. Late gadolinium enhancement is present at the same location of high signal intensity in the T2W-STIR-BB image. Maximum intensity projection FDG-PET image shows strong FDG uptake at the anteroseptal myocardium and hilar and mediastinal lymph node. Case 2: conventional inactive case with all positives on T2W-STIR-BB, LGE and FDG-PET in an asymptomatic patient in his/her 40s. T2W-STIR-BB image is positive in the epicardial side of the basal level of the septal wall in which MSR is 0.67. Spotty late gadolinium enhancement is present at the epicardial side of the basal level of the right ventricular junction. Maximum intensity projection FDG-PET image shows strong FDG uptake by the myocardium and hilar and mediastinal lymph nodes. Even though the patient did not have any clinical symptoms to suspect active CS, positive findings on both T2W-STIR-BB and FDG-PET suggest active myocardial inflammation. CMR, cardiac magnetic resonance; CS, cardiac sarcoidosis; FDG-PET, 18F-fluoro-2-deoxyglucose positron emission tomography; LGE, late gadolinium enhancement; MSR, myocardium-to-spleen ratio; T2W-STIR-BB, T2-weighted short-tau-inversion-recovery black-blood.
Diagnostic performance of T2W-STIR-BB and FDG-PET for identifying active patients with CS
When at least one positive finding in conventional methods (conventional active group) was used as the gold standard of CS activity, sensitivity, specificity, accuracy, and positive and negative predictive values were 79%, 43%, 73%, 87% and 30%, respectively (T2W-STIR-BB with quantitative analysis using MSR), 64%, 43%, 60%, 84% and 20%, respectively (T2W-STIR-BB with visual analysis) and 70%, 71%, 70%, 92% and 33%, respectively (FDG-PET). Figure 5 illustrates the results in a bar graph for side-by-side visual comparison. The sensitivity and accuracy of T2W-STIR-BB imaging were greater with quantitative analysis using the MSR method than with visual analysis. The sensitivity and accuracy values of T2W-STIR-BB imaging were similar to those of FDG-PET.

Graphs illustrating diagnostic performance of FDG-PET and T2W-STIR-BB imaging when we used positive findings in conventional methods as the gold standard of CS activity. Sensitivity, specificity and accuracy of T2W-STIR-BB imaging were statistically non-inferior to those of FDG-PET among all comparisons. CS, cardiac sarcoidosis; FDG-PET, 18F-fluoro-2-deoxyglucose positron emission tomography; T2W-STIR-BB, T2-weighted short-tau-inversion-recovery black-blood images.
Diagnostic performance of T2W-STIR-BB for identifying myocardial inflammation detected by FDG-PET
The diagnostic performance of T2W-STIR-BB imaging for identifying myocardial inflammation detected by FDG-PET is summarised in table 3.
Diagnostic performance of high signal intensity on T2-weighted short-tau-inversion recovery black-blood compared with 18F-fluoro-2-deoxyglucose positron emission tomography
Sensitivity, specificity, accuracy, and positive and negative predictive values were 92%, 53%, 78%, 77% and 80%, respectively, for T2W-STIR-BB imaging with semi-quantitative analysis using MSR, and 60%, 33%, 50%, 60% and 33%, respectively, for visual analysis of T2W-STIR-BB images. The sensitivity and accuracy of T2W-STIR-BB imaging significantly improved when quantitative analysis using the MSR method was employed instead of visual analysis.
Discussion
In the present study, we evaluated the utility of high signal intensity on T2W-STIR-BB images for identifying active patients with CS. This is the first study to directly compare the diagnostic performance of T2W-STIR-BB and FDG-PET imaging. When CS activity was defined with conventional diagnostic methods, T2W-STIR-BB and FDG-PET demonstrated comparable diagnostic accuracy for identifying active CS. When using either positive findings of conventional methods or myocardial FDG uptake as the reference standard, the diagnostic performance of T2W-STIR-BB imaging for identifying active CS was better with semi-quantitative analysis using MSR than with visual assessment.
To our knowledge, only three studies5 14 23 have compared visual hyperintensity findings on T2-weighted images and FDG-PET images in patients with CS. The current study included the largest number of patients with CS. We observed a much higher rate of positive findings on T2W-STIR-BB images among our cohort (30 of 40 patients (75%)) than in previous studies, which ranged from 6% to 34%).5 14 23 The higher rate of positive findings on T2W-STIR-BB images in our study could be attributed to the use of the semi-quantitative MSR method.
One reason that hyperintensity on T2W-STIR-BB images is not generally used for evaluation of active CS is the difficulty involved in accurately evaluating the signal intensity. Although T2 mapping has been reported as a useful method for quantitative analysis,24 25 it may not be available on older scanners. Therefore, we employed a simple semi-quantitative analysis; we used the ratio of signal intensity of the myocardium to that of the spleen as the MSR. Most studies of myocarditis analysed T2-weighted images using an oedema ratio, defined as the ratio of myocardial to skeletal muscle signal intensity, with values above a set value considered pathological. However, in this study, an oedema ratio was not available due to a lack of skeletal muscle in the field of view.26 27 The skeletal muscles were excluded in some cases; however, the MSR was successfully calculated in all cases.
Positive T2W-STIR-BB and FDG-PET segments showed similar distribution. In addition, the distribution of positive segments on T2W-STIR-BB, LGE and FDG-PET in this study was comparable to that of previous reports (figure 3).5 6 The minor dissimilarity in the distribution of positive findings on T2W-STIR-BB and FDG-PET can be explained by the different morphological foundations of the two modalities. A high signal on T2W-STIR-BB images is thought to represent interstitial oedema and/or increased extracellular spaces resulting from inflammation,28 whereas FDG accumulates within the cell itself with augmented glucose intake (eg, inflammatory cells). It can be hypothesised that FDG-PET and T2W-STIR-BB images depict pathologically different lesions, which could result in a dissimilarity between distributions.
When using FDG-PET imaging for identifying myocardial inflammation as the gold standard, the sensitivity, specificity and accuracy of T2W-STIR-BB imaging were better when images were analysed with the semi-quantitative MSR method rather than with visual analysis. Moreover, with the use of the MSR method, T2W-STIR-BB imaging demonstrated comparable diagnostic performance to that of FDG-PET (sensitivity 79% vs 70%; accuracy 83% vs 92%) for detecting CS in patients in the conventional active group. Calculation of the MSR is a simple semi-quantitative method that requires neither specialised software nor contrast. While FDG-PET may reveal only inflammatory changes in the myocardium, CMR imaging could reflect a wider spectrum of CS activity; for example, cine images offer information on ventricular wall motion and morphological abnormalities, and LGE can indicate fibrosis or inflammatory changes.29 30 However, it is difficult to know whether LGE reflects active inflammation or not. In fact, in our study, LGE compatible with CS occurred more frequently than positive findings on T2W-STIR-BB images. With the combined use of T2W-STIR-BB imaging and LGE, it may be possible to comprehensively distinguish inflammation from fibrosis on MRI.
Our study is limited by its retrospective design. Although our patient population was small, we included a larger number of patients compared with previous studies.5 14 23 Only five of our 40 patients’ diagnoses were histologically proven by extracardiac biopsy, and none of the 40 participants underwent endomyocardial biopsy. However, the biopsy procedure offers a very low diagnostic yield (20%) and presents a relatively high degree of invasiveness and rate of complications.31 In fact, JCS2016 guidelines4 allow for diagnosis of CS without histological proof. Further, we did not include a comparison with gallium scintigraphy. The number of patients with gallium positive myocardial uptake was very small (only 7 out of 40 patients), which made it difficult to interpret the results of regional agreement between modalities. Finally, the right ventricle was not investigated due to the difficulty in setting an ROI on the myocardium to calculate the MSR.
In conclusion, T2W-STIR-BB imaging with a semi-quantitative MSR method demonstrated comparable diagnostic performance to that of FDG-PET. High signal intensity on T2W-STIR-BB images provided an additional non-invasive and radiation-free tool for evaluation of CS activity.
Supplemental material
Data availability statement
Data are available upon reasonable request.
Ethics statements
Patient consent for publication
Ethics approval
The study protocol was approved by the research ethics board of Hospital A.
References
Supplementary materials
Supplementary Data
This web only file has been produced by the BMJ Publishing Group from an electronic file supplied by the author(s) and has not been edited for content.
Footnotes
Twitter @@ReinaTonegawa
Contributors RT-K and TN conceived the idea. RT-K and SN collected the clinical information of the patients and analysed the result statistically. TN and CMHP analysed radiological imagings visually. RA measured the myocardium to spleen ratio (MSR) while blinded to the clinical information. RT-K wrote the article with support from NO-M and KK.
Funding NO-M was supported by grant from the Japan Society for the Promotion of Science (JSPS) KAKENHI #20K08042 (NOM).
Competing interests None declared.
Provenance and peer review Not commissioned; externally peer reviewed.