Article Text

Abstract
Objectives Accelerated atherosclerosis is a well-established phenomenon after coronary artery bypass grafting surgery (CABG). In this study, we analysed coronary artery calcium (CCS) progression after CABG.
Methods We retrospectively measured the CCS Agatston score (AS), volume score (VS) and mass score (MS) of 39 patients before and after CABG. The annualised CCS change and annualised CCS percent change of each coronary artery, coronary artery segments proximal and distal to anastomosis were analysed.
Results Mean age at the time of the surgery was 59.8±8.5 years. Follow-up period between the first and second CT scans was 6.7±2.8 (range, 1.1–12.8) years. Annualised CCS percent change (AS, VS and MS) of the coronary segments proximal-to-anastomosis did not differ from that of the non-grafted coronary arteries as follow: segments proximal-to-anastomosis: median (Q1–Q3) 12.8 (5.0–37.4), 13.7 (6.1–41.1) and 14.9 (5.4–53.7), left main coronary artery 12.6 (7.4–43.8), 22.0 (8.1–44.4) and 18.2 (7.3–57.4), non-grafted left circumflex artery: 13.5 (4.4–38.1), 10.5 (2.9–45.2) and 11.5 (7.1–47.9) and non-grafted right coronary artery: 31.4 (14.4–74.5), 25.2 (16.7–62.0) and 31.3 (23.8–85.6), respectively. Likewise, annualised percent change (AS, VS and MS) was similar between the native coronary arteries. Multivariate regression analysis showed that diabetes mellitus was the only predictor of annualised percent progression of the total CCS of >15% (HR, 8.12; 95% CI, 1.05 to 26.6; p=0.04).
Conclusion The CCS post-CABG did not follow an accelerated progression process. Among coronary artery disease risk factors, diabetes mellitus is the only predictor of annualised CCS percent progression of >15% post-CABG.
- atherosclerosis
- coronary artery bypass
- computed tomography angiography
Data availability statement
Data are available upon reasonable request.
This is an open access article distributed in accordance with the Creative Commons Attribution Non Commercial (CC BY-NC 4.0) license, which permits others to distribute, remix, adapt, build upon this work non-commercially, and license their derivative works on different terms, provided the original work is properly cited, appropriate credit is given, any changes made indicated, and the use is non-commercial. See: http://creativecommons.org/licenses/by-nc/4.0/.
Statistics from Altmetric.com
Key questions
What is already known about this subject?
Accelerated atherosclerosis is a well-established phenomenon of proximal coronary segments after coronary artery bypass grafting surgery (CABG).
What does this study add?
This study confirmed that the coronary calcium has a non-accelerated progression post-CABG.
How might this impact on clinical practice?
The present study gives insight on the process of atherosclerotic plaques components progression after CABG.
Introduction
Accelerated atherosclerosis (AA), so-called rapid atherosclerosis, of proximal coronary segments is a well-established syndrome after coronary artery bypass grafting surgery (CABG).1–3 Initial reports showed that coronary artery segments proximal to severe luminal stenosis develop rapid atherosclerotic progression after CABG.1 A similar phenomenon was described after CABG in the grafted coronary artery segments with luminal stenosis of <50% as well as in normal segments lying between a high-grade stenosis and the anastomosis site.2–4
Spontaneous atherosclerosis has a complex evolution which consists of six distinguishable stages, each with particular morphological characteristics related to the changes in lipid accumulation, thrombotic deposits and calcification.5 In contrast, AA describes an exceedingly aggressive subset with a pathophysiology involving a denuding injury of the vascular intima and endothelium followed by thrombosis and proliferation of the smooth muscle cells and subsequently fibrosis results in the rapid progression of the lesions. Atheroma containing calcium is considered as an advanced atherosclerotic lesion and is classified as type V.5 Since total coronary calcium strongly correlates with total plaque burden and the average coronary calcium area is approximately 20% of the total histological plaque area,6 7 quantification of coronary artery calcium by CT provides an estimation of an extent and progression of coronary atherosclerosis.
Coronary CT is the reference tool to quantify coronary artery calcium (CCS) and to differentiate calcified from non-calcified plaques. In contrast, invasive coronary angiography was used in previous reports to assess AA post CABG and is a lumenogram that has a major limitation in determining coronary artery wall composition.8
To date, there are no reports that analyse the progression rate of calcium in the coronary artery tree after CABG. The aim of this study is to determine the progression of CCS post-CABG using CT and determine whether it differs from that of the non-grafted vessels.
Materials and methods
Study population
We retrospectively analysed all patients who had CABG between January 2005 and December 2018 who had a pre-CABG calcium score scan (either as diagnostic CT angiography (CTA) or as planning prior to minimal-invasive surgery) and were referred for follow-up CTA (30 asymptomatic patients were referred as part of research follow-up study and 9 patients with atypical chronic chest pain). Only patients with CT scan within 3 months prior to the CABG and more than 12 months after surgery were included. Stented coronary arteries were excluded, figure 1. This study was approved by the ethics committee and all research patients signed a consent to have follow-up CTA and to allow their data to be entered into a registry. All CTs were performed using a GE 64-detector lightspeed CT.
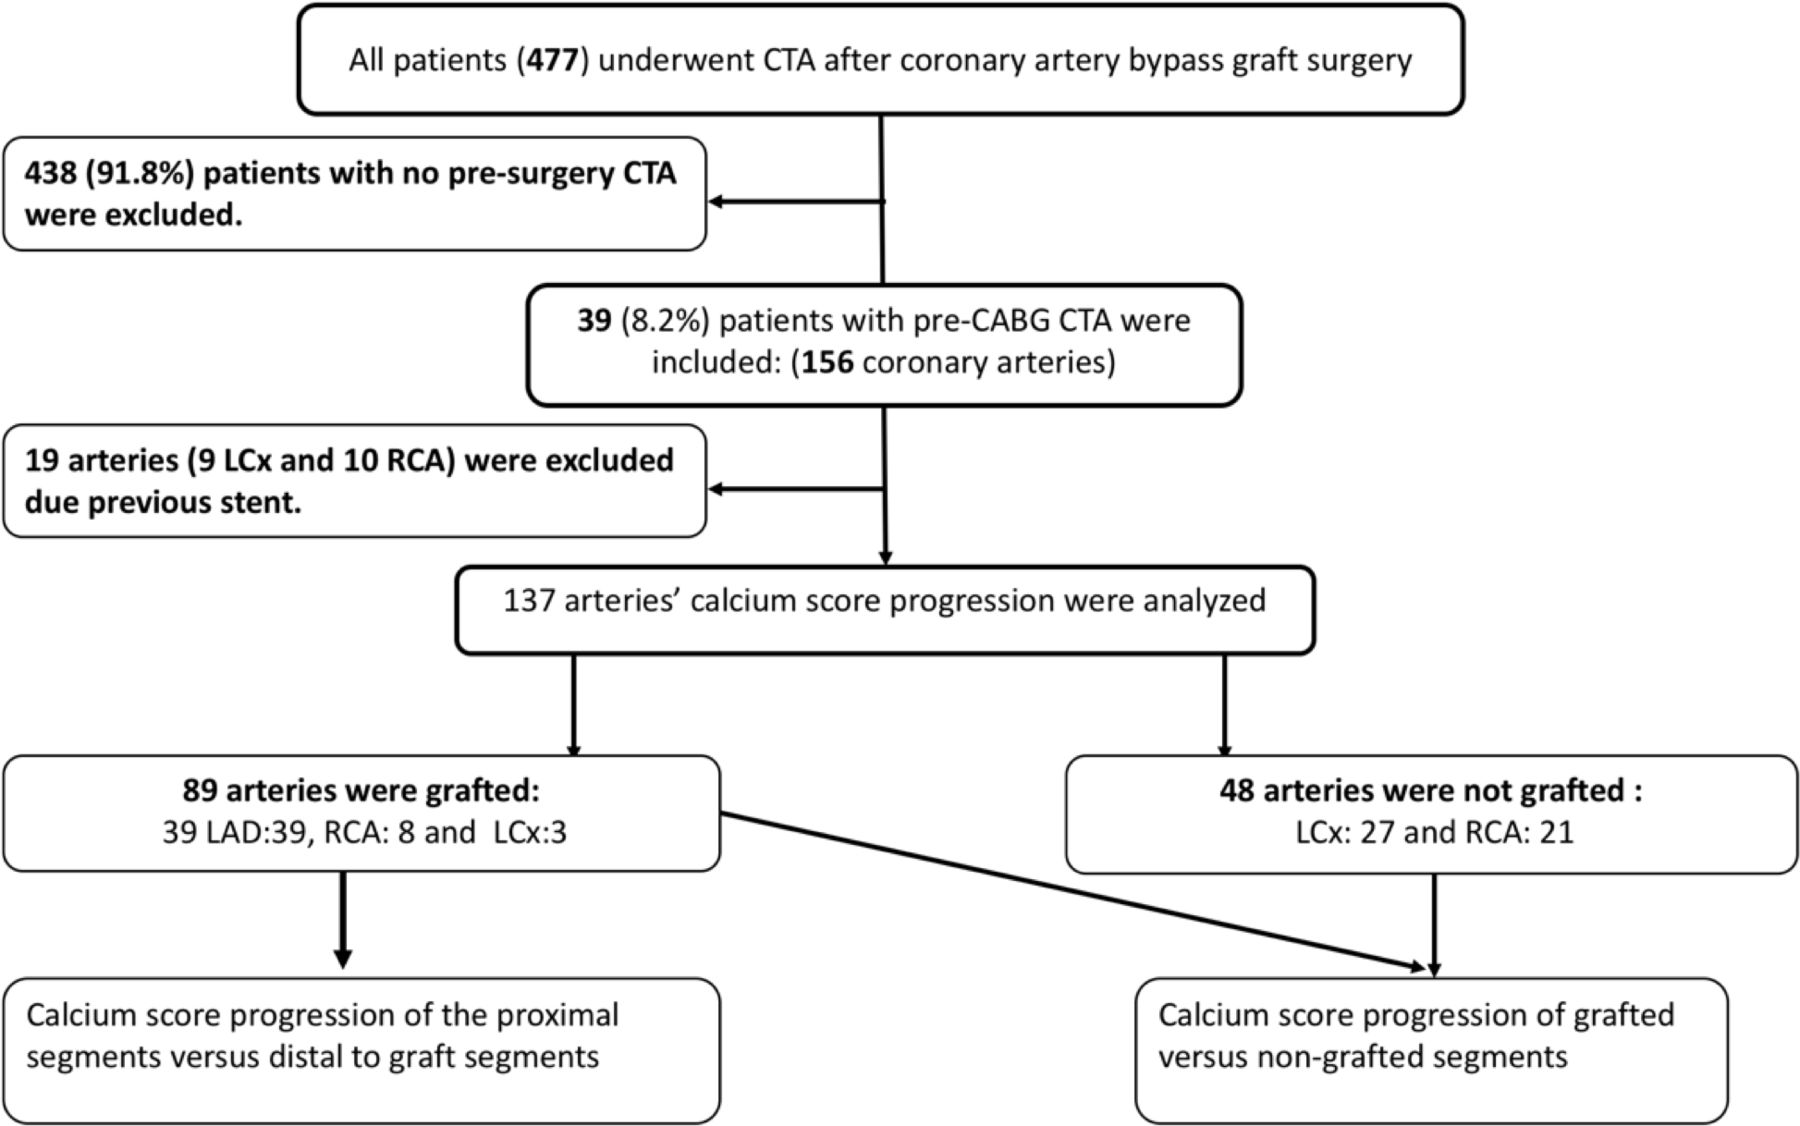
Patients inclusion. CABG, coronary artery bypass grafting surgery; CTA, CT angiography; LAD, left anterior descending artery; LCx, left circumflex artery; RCA, right coronary artery.
Calcium score measurements
CT images of 39 patients were reviewed using dedicated software (AquariusNet Thin Client; TeraRecon, San Mateo, California, USA) to measure three different calcium scores: Agatston score (AS), volume score (VS) and mass score (MS). The total calcium score of the coronary tree was the sum of the CCS of left main coronary artery (LM), left anterior descending artery (LAD), left circumflex artery (LCx) and the right coronary artery (RCA). CCS of the grafted coronary arteries was divided into CCS proximal to the graft and CCS distal to the graft, figure 1. Angiographic landmarks such as side-branches or myocardial bridges of the post-CABG CTA were used as a guidance to define anastomosis sites on the pre-CABG and post-CABG calcium score scans. Calcification of the coronary artery branches originating proximal to graft anastomosis was added to the proximal CCS segments.
Statistical analysis
Quantitative variables were expressed as means±SD and categorical variables were expressed as frequencies with 95% CI. The progression of CCS scores (AS, VS and MS) was expressed as three variables9:
Absolute CCS change=CCS (Post-CABG)–CCS (Pre-CABG).
Annualised CCS change=Absolute CCS Differences/follow-up (in years).
Annualised CCS percent change=(CCS (Post-CABG)– CCS (Pre-CABG)/CCS (Pre-CABG))×100 (for patients with non-zero CCS Pre-CABG).
The annualised percent change of >15% was considered to be significant.10
We used paired t-test to compare the CCS scores between segments proximal versus distal to anastomosis, and to compare relative CCS between proximal segments versus the non-grafted coronary arteries, and the four coronary arteries. Our results were verified using non-parametric Wilcoxon test. Multivariate regression analysis was used to define predictors including traditional risk factors with total CCS annualised percent change of >15%. A p value <0.05 was considered statistically significant. All statistical analyses were performed using SPSS for Windows (SPSS V.19.0).
Results
In total, 39 patients were included (156 coronary arteries). The total number of grafted vessels was 50: 39 left internal thoracic artery to LAD, 8 saphenous vein graft (SVG) to RCA and 3 SVG to LCx. Forty-eight coronary arteries (27 LCx and 21 RCA) were not grafted. Nineteen coronary arteries (9 LCx and 10 RCA) were excluded due to previous stent deployment, figure 1. The mean age at the time of the surgery was 59.8 (±8.5) years and 28/39 (71.8%) were men. Other baseline characteristics are shown in table 1.
Baseline characteristics
The pre-CABG and post-CABG CCS of the coronary artery tree, the CCS absolute differences and the annualised percent differences are shown in table 2.
Calcium scores of different coronary arteries presurgery and postsurgery
The mean follow-up period between the first and second CT scan was 6.7 (±2.8), (1.1–12.8) years.
We found that annualised CCS percent change was not significantly different between the native coronary arteries with a median AS and (Q1–Q3) of LM: 14.2 (8.3–43.4), LAD: 14.4 (5.1–41.3), LCx: 16.1 (4.7–39.8) and RCA: 24.8 (15.8–65.2); VS as follow: LM: 22.7 (7.7–43.9), LAD: 13.9 (5.9–38.4), LCx: 16.6 (2.9–45.7) and RCA: 20.4 (10.8–58.1) and MS: LM: 16.8 (7.2–57.5), LAD: 14.7 (5.3–50.4), LCx: 12.4 (7.1–63.9) and RCA: 32.2 (21.2–70.6), figure 2.

Relative calcium score changes. (A) Agatston score, (B) volume score and (C) mass score between the coronary arteries. LAD, left anterior descending artery; LCx, left circumflex artery; LM, left main coronary artery; RCA, right coronary artery.
Similarly, annualised CCS percent change of the coronary segments proximal-to-anastomosis did not differ from that of the non-grafted coronary arteries with a median AS as follow: segments proximal-to-anastomosis: 12.8 (5.0–37.4), LM: 12.6 (7.4–43.8), non-grafted LCx: 13.5 (4.4–38.1) and non-grafted RCA: 31.4 (14.4–74.5); VS as follow: proximal-to-graft segments: 13.7 (6.1–41.1), LM: 22.0 (8.1–44.4), non-grafted LCx: 10.5 (2.9–45.2) and non-grafted RCA: 25.2 (16.7–62.0), MS as follow: segments proximal-to-anastomosis: 14.9 (5.4–53.7), LM: 18.2 (7.3–57.4), non-grafted LCx: 11.5 (7.1–47.9) and non-grafted RCA: 31.3 (23.8–85.6), figure 3.
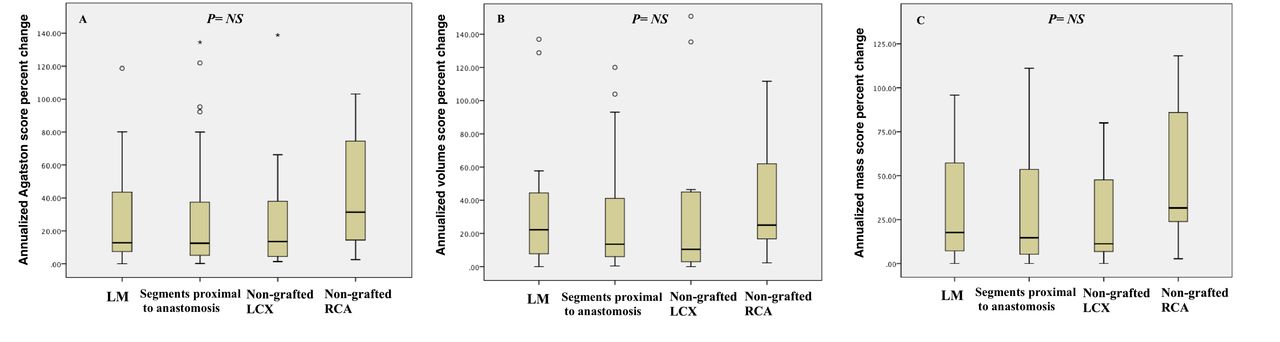
Relative calcium score changes. (A) Agatston score, (B) volume score and (C) mass score between pre-graft LAD segments and non-grafted coronary arteries. LAD, left anterior descending artery; LCx, left circumflex artery; LM, left main coronary artery; RCA, right coronary artery.
However, the annualised CCS change was significantly higher in pre-graft when compared with post-graft: AS changes 61.2 (±10.1), versus 2.6 (±8.8), p<0.0001, VS changes 16.2 (±25.7), versus 1.2 (±4.4), p<0.0001, and MS changes 4.7 (±6.9), versus 0.3 (±1.1), p<0.0001 figure 4.

Absolute calcium score changes. (A) Agatston score, (B) volume score and (C) mass score between segments proximal to anastomosis and segments distal to anastomosis.
19/39 (48.7%) of the patients had annualised percent changes (AS, VS and MS) of the total CCS of >15%. Multivariate regression analysis including the traditional risk factors of coronary artery disease (CAD) was used to define the predictors of annualised percent progression of the total CCS of >15% which showed that diabetes was the only predictor of rapid progression with HR of 8.12, 95% CI (1.05 to 26.6), p=0.04 (table 3).
Multivariate binary regression of coronary artery disease risk factors versus rapid progression
Discussion
In this study, in-depth progression of the three different calcium scores (Agatston, volume and mass) post-CABG was analysed. We found that the annualised CCS percent change did not differ between the coronary arteries (LM, LAD, LCx and RCA), nor between segments proximal to anastomosis compared with the non-grafted coronary arteries. We found that diabetes independently predicted annualised percent progression of the total CCS of more than 15% after CABG.
There are multiple invasive coronary angiography-based reports confirming the AA phenomenon post-CABG. Pereg et al2 found that approximately 62% of patients developed at least one new total occlusion of the native coronary vessels within the first year after CABG. Total occlusion was five times more prevalent in coronary arteries with >90% stenosis before the surgery. The underlying mechanisms of AA that result in new coronary obstructions after CABG are not fully understood. Competitive blood flow in the proximal segments reduces wall shear stress proximal to anastomosis leading to endothelial dysfunction through downregulation of prostacyclin and nitric oxide production, and upregulation of thrombomedulin and endothelin-1 production.11 12 Several studies showed a non-random high prevalence of coronary artery plaques in the proximal coronary tree. Grunfeld et al13 reported that the prevalence of proximally located plaques was two times that of the distally located plaques (79% vs 39%). Similarly, severe coronary obstruction is more common in the proximal segments of the coronary arteries.14–17 Unlike proximal and mid segment plaques, traditional CAD risk factors have no significant association with distal coronary plaques. However, Agatston CCS score >100 is considered a strong predictor for both proximal and distal plaques.13
Despite that annualised CCS percent change is more accurate than annualised CCS change, the former formula requires a pre-CABG CCS greater than zero. Annualised percent change calculation was omitted in our analysis as 42/50 (84%) of the distal segments of the grafted arteries had a CCS of zero before CABG.
In this study, the annualised CCS change in segments proximal to anastomosis was significantly higher than in the distal segments. A similar finding was demonstrated by Schmermund et al18 who analysed the natural history of CCS progression without CABG and determined the topographic distribution of coronary calcified plaques; he found that the annualised CCS change is greater in the proximal segments than the distal segments. In addition, he reported that annualised CCS progression was significantly less in segments with lower baseline CCS. As well, the non-significant variation of the annualised CCS percent change between proximal-to-graft segments and the non-grafted coronary arteries demonstrated in our study suggests that the greater annualised CCS change of the proximal segment is part of the natural history of atherosclerosis progression and not due to AA after CABG.
Our study is the first to analyse the CCS progression after CABG and gives insight on the process of atherosclerosis post-CABG. Given the non-rapid progression of CCS in our study and the AA noted in previous reports, this supports an inhomogeneous progression of atherosclerotic plaque after CABG with greater progression of the non-calcified plaque components.
Among traditional CAD risk factors, diabetes was the only predictor for annualised percent change of the total CCS >15% after CABG which was previously reported by Hong et al19 who found that patients with diabetes have a higher whole plaque volume and calcified plaque progression than non-diabetics.
Previous reports demonstrated that the most important predictors of CCS progression were white ethnicity, male gender, hypertension, diabetes mellitus and family history of heart attack. Although statin therapy reduces the cardiac events, it has no significant impact on CAC progression.20 21
Strength of this study
This is the first to analyse calcium score progression post-CABG. We used three different CCS scores with VS and MS being more reproducible than AS.22 There was a reasonable follow-up between the CT scans of 6.7 years.
Limitations
This study is single-centre analysis involving a small number of patients. No angiographic data were available to correlate coronary stenosis progression with calcium score progression.
Conclusion
This study supports inhomogeneous atherosclerotic plaque progression with a non-accelerated progression of the coronary calcium post-CABG. No significant differences in the annualised CCS percent change between the coronary arteries were observed. CCS progression did not differ between segments proximal to anastomoses compared with the non-grafted coronary arteries. Diabetes was the only CAD risk factor that independently predicted a significant annualised percent progression of CCS of more than 15% after CABG.
Data availability statement
Data are available upon reasonable request.
Ethics statements
Ethics approval
University of Western Ontario Health Sciences Research Ethics Board. The Cardiovascular Registry—13575E. This study was approved by the ethics committee and all research patients signed a consent to have follow-up CTA and to allow their data to be entered into a registry.
References
Footnotes
Contributors RMA contributed to conception of the work. RMA, JGR, BK and WCV contributed to the design of the work. RMA contributed to data collection. YB contributed to data analysis. RMA, YB, BK and WCV contributed to data interpretation. All authors contributed to critical revision of the article and final approval of the version to be published.
Funding The authors have not declared a specific grant for this research from any funding agency in the public, commercial or not-for-profit sectors.
Competing interests None declared.
Provenance and peer review Not commissioned; externally peer reviewed.