Article Text

Abstract
Background We designed this study to assess the acute effects of different fusion strategies and left ventricular (LV) pre-excitation/post-excitation on LV dP/dtmax and QRS duration (QRSd).
Methods We measured LV dP/dtmax and QRSd in 19 patients having cardiac resynchronisation therapy (CRT). Two groups of biventricular pacing were compared: pacing the left ventricle (LV) with FUSION with intrinsic right ventricle (RV) activation (FUSION), and pacing the LV and RV with NO FUSION with intrinsic RV activation. In the NO FUSION group, the RV was paced before the expected QRS onset. A quadripolar LV lead enabled distal, proximal and multipoint pacing (MPP). The LV was stimulated relative in time to either RV pace or QRS-onset in four pre-excitation/post-excitation classes (PCs). We analysed the interactions of two groups (FUSION/NO FUSION) with three different electrode configurations, each paced with four different degrees of LV pre-excitation (PC1–4) in a statistical model.
Results LV dP/dtmax was higher with NO FUSION than with FUSION (769±46 mm Hg/s vs 746±46 mm Hg/s, p<0.01), while there was no difference in QRSd (NO FUSION 156±2 ms and FUSION 155±2 ms). LV dP/dtmax and QRSd increased with LV pre-excitation compared with pacing timed to QRS/RV pace-onset regardless of electrode configuration. Overall, pacing LV close to QRS-onset (FUSION) with MPP shortened QRSd the most, while LV dP/dtmax increased the most with LV pre-excitation.
Conclusion We show how a beneficial change in QRSd dissociates from the haemodynamic change in LV dP/dtmax with different biventricular pacing strategies. In this study, LV pre-excitation was the main determinant of LV dP/dtmax, while QRSd shortens with optimal resynchronisation.
- heart failure
- pacemaker
- artificial
- heart failure
- systolic
- cardiomyopathy
- dilated
- electrocardiography
Data availability statement
Data are available on reasonable request.
This is an open access article distributed in accordance with the Creative Commons Attribution Non Commercial (CC BY-NC 4.0) license, which permits others to distribute, remix, adapt, build upon this work non-commercially, and license their derivative works on different terms, provided the original work is properly cited, appropriate credit is given, any changes made indicated, and the use is non-commercial. See: http://creativecommons.org/licenses/by-nc/4.0/.
Statistics from Altmetric.com
Key questions
What is already known about this subject?
Measuring haemodynamic response to biventricular pacing has failed to consistently predict long-term response to cardiac resynchronisation therapy (CRT).
An increase in left ventricular (LV) dP/dtmax is seen when biventricular pacing and left ventricular pacing is applied to the heart, and an increase from baseline of more than 10% is considered a good response to CRT.
QRS duration shortens with CRT and predicts long-term beneficial outcomes.
Targeting areas in the heart that shorten QRS duration the most is, however, not predictive of a beneficial long-term response.
What does the study add?
The study demonstrates how different modes of pacing determine LV dP/dtmax and QRS duration.
An optimal mechanical and electrical response is desired from CRT; however, LV pre-excitation is the main determinant of LV dP/dtmax, and LV dP/dtmax cannot, therefore, be expected to reflect optimal resynchronisation.
How might this impact on clinical practice?
It is critical to understand the performance of parameters used for predictive testing.
LV dP/dtmax is used to determine acute response to CRT to secure long-term benefits from CRT.
This study shows that LV dP/dtmax is not determined by optimal resynchronisation but rather by LV pre-excitation in patients amenable for CRT and will not be useful as a biomarker for CRT.
Other parameters to determine mechanical response to CRT should be searched for and tested in a similar study design before being implemented in clinical practice.
Introduction
Cardiac resynchronisation therapy (CRT) is very useful in selected patients; however, responder rates rarely exceed 70%.1 2 CRT causes improved electrical synchrony (shortened QRS duration (QRSd)) and mechanical function (higher left ventricular (LV) dP/dtmax) once inserted.3 4 Research groups have therefore used LV dP/dtmax and QRSd to guide different approaches to improve CRT,4–10 including fusion of intrinsic conduction with paced wavefronts and LV pre-excitation.7 9 11–14 The objective of this study was to analyse how fusion determines LV dP/dtmax and QRSd to understand better how these measurements reflect resynchronisation and should be interpreted if they were to be used for acute haemodynamic assessment or for the prediction of long-term response from CRT. We applied biventricular stimulation with different fusion strategies, including fusion with intrinsic right ventricle (RV) activation, different degrees of fusion within the LV by LV pre-excitation/post-excitation and fusion from the LV activation site with single-point and multipoint pacing (MPP) in order to analyse the effect of different fusion strategies on LV dP/dtmax and QRSd.
Material and methods
Ethics statement
This study was an acute single-centre observational, experimental haemodynamic study approved by the Regional Committees for Medical and Health Research Ethics in Norway and conducted following the Declaration of Helsinki principles. We obtained written, informed consent from all patients.
Study population
Patients with heart failure admitted for CRT implantation according to current European Society of Cardiology/American Heart Association guidelines were asked to participate in the study. Inclusion criteria were sinus rhythm, New York Heart Association (NYHA) functional class II and III heart failure on optimal medical therapy, QRSd larger than 130 ms and a left ventricular ejection fraction of less than 35%. Exclusion criteria were age less than 18 years and above 80 years, ongoing atrial fibrillation and complete atrioventricular block. We successfully positioned the quadripolar LV lead in what we determined was the optimal lateral branch of the coronary sinus in each patient. LV pacing (LVP) was set up in an extended bipolar configuration with the cathode on the LV electrode and the anode on the RV defibrillation coil. Therefore, MPP was limited to simultaneous pacing from the distal LV electrode to RV coil and proximal LV electrode to RV coil, a configuration that is superior to other MPP configurations.15
Pacing interventions: groups, electrode configurations and pre-excitation/post-excitation classes
The atrial pacing (AP) rate was set 10% higher than baseline sinus rhythm, and AP-QRS interval was measured. We paced the RV at baseline in DDD-mode with AV delay at 80% of the measured AP-QRS interval. We used the AP-QRS interval to calculate the AP-left ventricular paced interval in the fusion with intrinsic RV activation group (FUSION) to pace the LV relative to QRS-onset (figure 1). The FUSION group was the only one to allow intrinsic RV activation. In the NO FUSION with intrinsic RV activation group, the AV-delay to RV pace (RVP) was set to 80% of the AP-QRS interval to avoid intrinsic RV activation (figure 1). We applied LVP from three different electrode configurations within each intervention group (FUSION/NO FUSION). LVP was paced first from the distal electrode (DIST), then from the proximal electrode (PROX), and finally combined DIST+PROX (MPP). Figure 1 shows representative electrograms from one patient and illustrations of the two main groups (FUSION/NO FUSION) with the different electrode configurations (DIST, PROX, MPP) and illustrated ideal electrical wavefronts from intrinsic activation and pacing electrodes in models of the heart. In the biventricular pacing mode, LVP was then performed relative to either calculated AP-QRS-onset (FUSION) or relative to the RVP (NO-FUSION) to achieve LV pre-excitation/post-excitation. The off-set between LV and RV activation was set by pacing the LV with a different extent of LV pre-excitation/post-excitation in four pre-excitation/post-excitation classes (PCs):
PC1. LVP earlier than 50 ms before QRS (FUSION) or RV pace onset (NO FUSION).
PC2. LVP within 50 ms before QRS (FUSION) or RV pace onset (NO FUSION).
PC3. LVP within 50 ms after QRS (FUSION) or RV pace onset (NO FUSION).
PC4. LVP later than 50 ms after QRS (FUSION) or RV pace onset (NO FUSION).
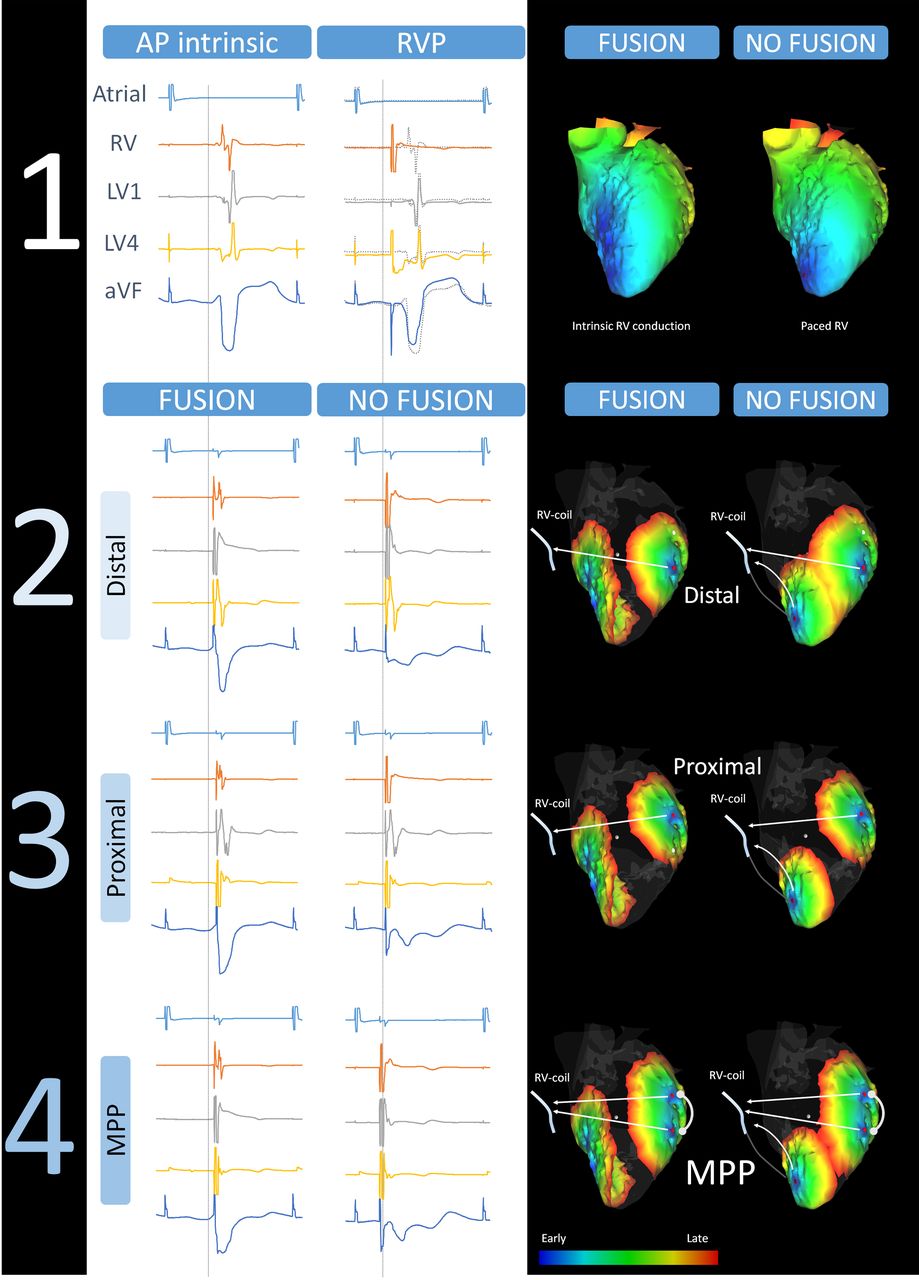
Examples of electrograms at baseline and FUSION and NO FUSION with intrinsic right ventricle (RV) activation and different electrode configurations. Intracardiac electrocardiogram (EGM) from the atrium (atrial), right ventricle (RV), and left ventricular distal (LV1) and proximal (LV4) electrodes together with ECG (limb lead: augmented Voltage Foot, aVF) from one representative patient. We display electrograms to the left and illustrations of respective pacing configurations to the right. A stippled vertical line depicts the onset of QRS (FUSION) and the onset of RV pacing (NO FUSION). The illustration shows pacing in pre-excitation class 3 with LV1, LV4 and MPP. (1) EGMs from atrial pace (AP) with native intrinsic conduction and RVP with intrinsic conduction overlaid and visualised with stippled lines. Heart models show suggested ideal activation with intrinsic conduction (FUSION) and RVP (NO FUSION). (2) Electrograms from FUSION and LV1 and NO FUSION and LV1 together with heart models with suggested ideal activation from respective electrodes and display of pacing vectors. (3) Electrograms from FUSION and LV4, and NO FUSION and LV4 together with heart models with suggested ideal activation from respective electrodes and display of pacing vectors. (4) Electrograms from FUSION and LV1+LV4, and NO FUSION and LV1+LV4 together with heart models with proposed ideal activation from individual electrodes and display of pacing vectors. MPP, multipoint pacing.
With this, we have two main groups (FUSION/NO FUSION) with three different electrode configurations (DIST, PROX, MPP), each paced repeatedly with four different degrees of LV pre-excitation/post-excitation (PC1–4) within each main group in each patient. Therefore, AV-delay was obligate different between the groups, with AV-delay being shorter in the NO FUSION group to avoid intrinsic RV activation compared with the FUSION group. The AV-delay shortened even more when we paced the LV before RV or QRS-onset, as in PC1 and PC2. Therefore, we measured actual AV-delay within each beat, to be included in the analyses, as the interval from AP to the first ventricular activation; LVP, RVP or QRS-onset. Figure 1 shows that the initial portion of the QRS complex is unchanged in the FUSION group before pacing onset. In the NO FUSION group, there is an immediate change in QRS compared with intrinsic QRS morphology. We confirmed a stable AV-delay visually when pacing with FUSION with intrinsic RV activation and post-excitation of LV (PC3, PC4) with every electrode configuration (figure 1) to confirm intrinsic QRS-onset before LVP and an unchanged intrinsic AV-delay. All biventricular pacing interventions were performed similarly in every patient, alternating FUSION and NO FUSION with each electrode configuration and PC. QRS morphology was visually inspected, compared with successive paced beats and fully paced beats to confirm stable fusion and LV pre-excitation/post-excitation during interventions. We averaged all measurements from 8 to 10 consecutive beats during each pacing intervention.
Data collection, pacing set-up and measurements
We collected electrophysiology signals and ECGs with the BARD Pro EP recording system, with Clearsign Amplifier (Boston Scientific). Pressures were measured via femoral artery access from the left ventricle with the Millar Micro-Cath pressure sensor catheter (Millar, USA) and collected with the PCU-2000 Pressure Control Unit (Millar, USA). We allowed pressures to stabilise with pacing before measuring the resulting LV dP/dtmax. Signals were collected in real-time from the recording system to a data acquisition unit (PowerLab, ADInstruments, UK) for analyses in the LabChart Pro V.8.0 software. We performed pacing with the EPS 320 cardiac stimulator (Micropace EP, USA). We determined QRS-onset as the first fluctuation above the isoelectric line that resulted in a complete QRS complex and QRSd from onset Q to global end of S wave from all ECG leads.
Statistical analysis
We used linear mixed models (SPSS V.26.0) that include fixed and random effects for the repeated measurements and used the Hotelling Lawley test and the GLIMMPSE sample size calculator (Glimmpse V.3.0.0 (samplesizeshop.org)) to confirm power >80% for a type I error of 5%. We chose compound symmetry as covariance type for both fixed and random effects, with each subject selected as random effects, with Bonferroni correction for comparison of main effects. The model with covariates that provided the lowest Akaike’s information criteria was selected. The statistical output provides the estimated marginal means±SEM for each fixed-effects group, considering random effects and covariates. It allowed us to analyse the effects of and the interactions between the modes of pacing (NO FUSION and FUSION), electrodes used (DIST, PROX, MPP) and pre-excitation (PC1–4). We used general linear models to compare groups with no repeated measures. Numbers from descriptive statistics are mean±SD. A p value of less than 0.05 was considered statistically significant.
Results
Baseline patient characteristics
We included 19 patients in sinus rhythm and a standard indication for a CRT device in the study. Mean age 64±10 years, 32% females, 42% ischaemic, 84% Left bundle-branch block (LBBB), 16% Intra-ventricular conduction disease (IVCD), QRSd 170±12 based on 12-lead ECG, Ejection Fraction (EF) 29%±4%, NYHA class 2.4±0.5 (mean±SD). Q-LV distal was 127±19 ms, and Q-LV proximal was 133±20 ms (mean±SD), with a linear relationship between the two (β=0.82, R=0.86, p<0.01). Paced rate, QRSd, AV-delay and LV dP/dtmax with AP, NO FUSION and FUSION are presented in table 1. Online supplemental figure 1 shows the electric intervals between the RV and LV electrodes and the interval from onset of QRS complex to LV electrodes (QLV).
Supplemental material
Supplemental material
Baseline characteristics
The effects of stimulation on LV dP/dtmax
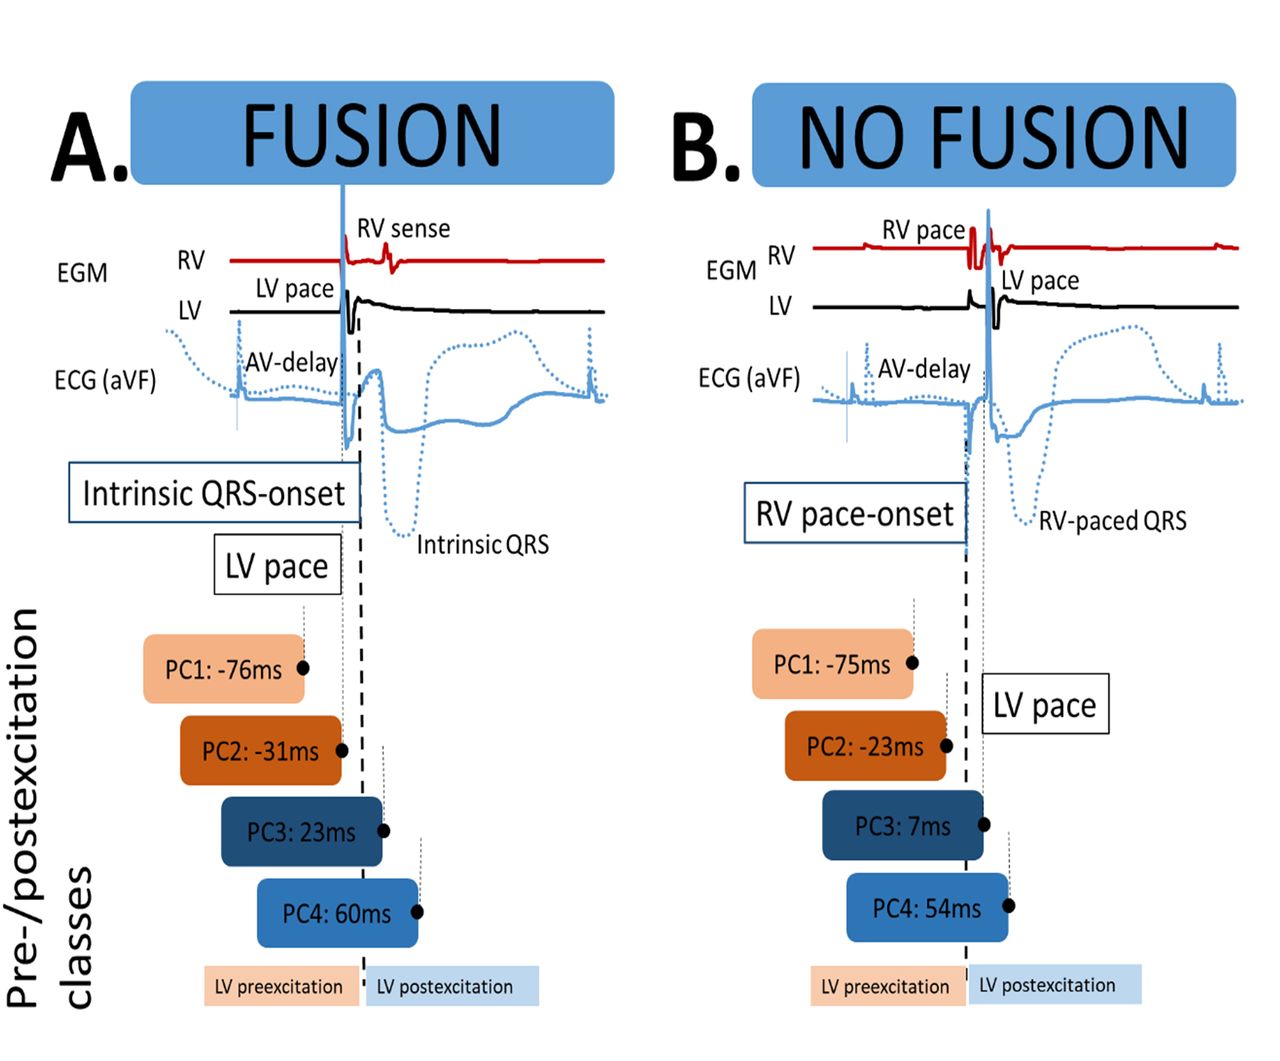
We analysed the overall effect of LV pacing with biventricular stimulation (NO FUSION) on LV dP/dtmax and compared this to LV pacing with fusion with intrinsic RV activation (FUSION). We found that LV dP/dtmax was higher with NO FUSION (769±46 mm Hg/s) than with FUSION (746±46 mm Hg/s, p<0.01). The increase in the two groups from baseline represents a 10% and 7% increase, respectively. We then evaluated the effect of electrode configuration at PC3, including both NO FUSION and FUSION, and found that LV dP/dtmax was lower with the proximal electrode than with the distal electrode, which again was lower than MPP (753±48 mm Hg/s vs 758±48 mm Hg/s vs 770±48 mm Hg/s, p<0.01). We included the delay between LV stimulation and RV stimulation/activation (VV-delay in ms) as a continuous variable in the model and found a significant effect of VV-delay on LV dP/dtmax (estimate −0.34 ms/(mm Hg/s), p<0.01). Therefore, we expected pre-excitation classes (PC) to have different effects on LV dP/dtmax. Figure 2A,B shows the average timing of pre-excitation/post-excitation in each PC. Overall, regardless of fusion with intrinsic RV activation or not, LV pre-excitation of less than 0 ms (PC1 and PC2) was associated with a higher LV dP/dtmax (779±46 mm Hg/s) versus post-excitation (757±46 mm Hg/s). PC2 was found to provide higher LV dP/dtmax than PC3 (779±46 mm Hg/s vs 759±46 mm Hg/s, p<0.01). Pre-excitation (PC1 and PC2) was associated with higher LV dP/dtmax than with no pre-excitation (PC3 and PC4) within both groups (NO FUSION and FUSION, table 2). Finally, we tested the interaction of NO FUSION and FUSION with all electrode configurations and PC. Figure 3 shows LV dP/dtmax at all different electrode configurations and PCs with FUSION/NO FUSION compared with AP. Online supplemental figure 2 shows the relationship between LV dP/dtmax and LV dP/dtmin.
Supplemental material

Left ventricular pacing relative to QRS onset or right ventricle (RV) pace onset, pre-excitation/post-excitation classes (PC1–4). (A) FUSION group. The panel displays biventricular activation with LV pacing and fusion with intrinsic RV conduction. In the illustrated example, LV pacing pre-excites the LV before intrinsic QRS onset (pre-excitation/post-excitation class 2, PC2). Fusion with native conduction is evident by the change in QRS morphology from that of intrinsic activation (stippled blue line) and with the sensed RV EGM in the RV channel (red) appearing after LV pace and early in the QRS complex. (B) NO FUSION group. The panel displays biventricular activation of the LV with postexcitation of the LV, with RV pace before LV pace. Biventricular pacing is evident by the change in QRS morphology after LV pace compared with the QRS morphology resulting from RV pace only (stippled blue line). Pre-excitation/post-excitation classes (PC): The boxes indicate the timing of LV pacing within each pre-excitation/post-excitation class with the average time differences between LVP and intrinsic QRS onset or RV pace onset.
The effect of the interaction of pre-excitation/post-excitation class (PC) with FUSION and NO FUSION

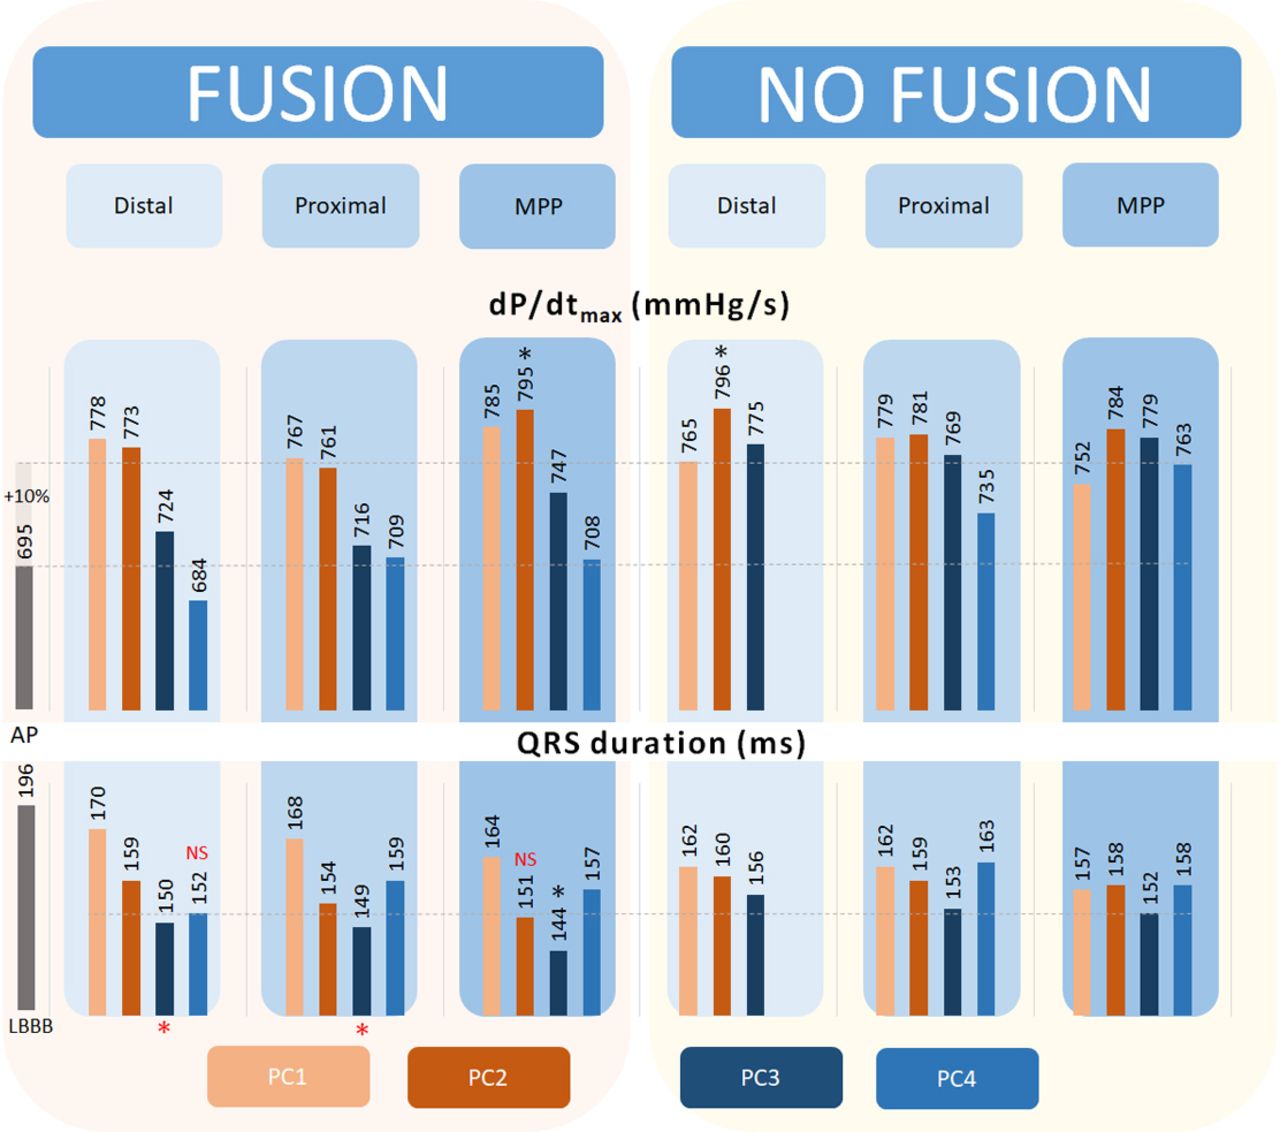
Fusion with intrinsic right ventricle (RV) activation, multipoint pacing (MPP) and pre-excitation/post-excitation class. The upper part of the panel shows the effect of pacing modes, electrodeposition and fusion class on dP/dtmax. The upper stippled line indicates a 10% increase from baseline dP/dtmax (lower stippled line). We show an increase in left ventricular (LV) dP/dtmax above the line of a 10% increase to a more considerable extent with LV pre-excitation. A significant increase in LV dP/dtmax than all is seen with FUSION and MPP and NO FUSION and distal LV electrode at PC2. In the lower part of the panel, we show the effect on QRS duration (QRSd). The stippled line indicates the level 152 ms at NO FUSION+MPP+PC3, with a red asterisk indicating a significant reduction (p<0.05) from this level and NS indicates a non-significant reduction from this level. QRSd is shortened with FUSION and PC3 with all electrode positions compared with the shortest QRSd with NO FUSION. QRSd with FUSION, MPP and PC3 is significantly lower than all other interventions. *P<0.05 compared with all. Numbers are estimated marginal means±SEM. SEM=48 mm Hg/s for dP/dtmax and 2–3 ms for QRSd. AP: atrial pace, LBBB: left bundle-branch block.
The effects of stimulation on QRSd
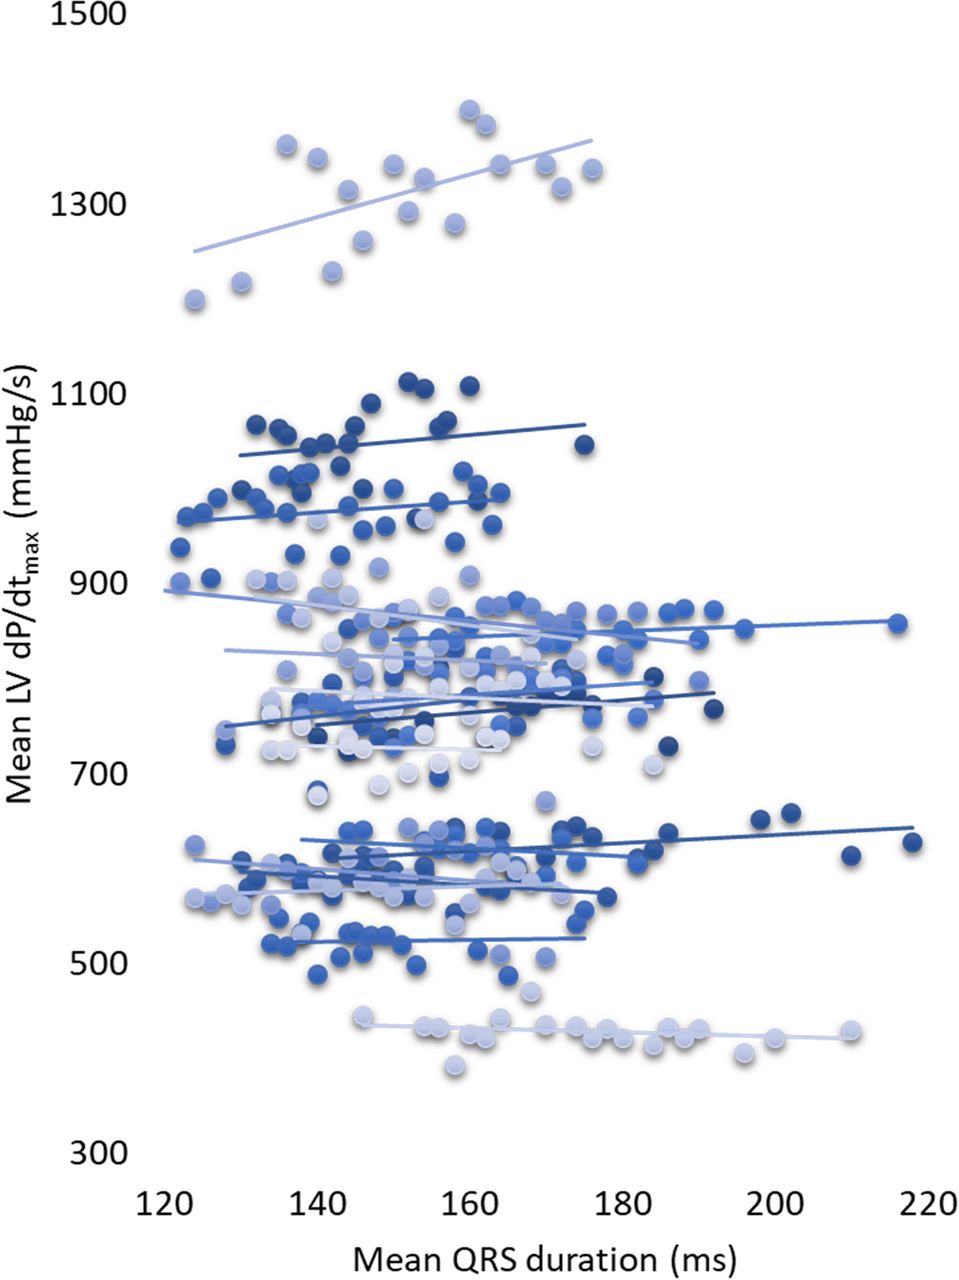
We found no difference in QRSd between NO FUSION and FUSION (156±2 ms vs 155±2 ms). However, QRSd significantly shortened from baseline with both FUSION and NO FUSION (table 1). We noted a weak significant association between LV dP/dtmax and QRSd (β=−2140 mm Hg/s2, R2=0.03, p<0.01), however, with substantial differences between patients (figure 4). In the linear mixed models, the β-coefficient of the association between LV dP/dtmax and QRSd was −360 mm Hg/s2, p<0.01. The linear mixed model takes the individual intercept into account, explaining the lower β-coefficient compared with the linear regression model. We normalised the average changes across all pacing modes and electrode configurations and plotted them against the fusion classes. It then becomes evident that LV dP/dtmax peaks with pre-excitation, while QRSd reaches its nadir close to the onset of QRS or RV-pace (figure 5). Finally, we tested the interaction between FUSION/ NO FUSION, electrode configurations and PCs on QRSd (figure 3). Online supplemental figure 3 displays a scatterplot of the relationship between QRSd and LV dP/dtmax and how QRSd was measured.
Supplemental material

QRS duration (QRSd) and different levels of left ventricular (LV) dP/dtmax. We found a wide range of QRSd during different pacing modes and degrees of LV pre-excitation within each patient at individual levels of LV dP/dtmax. A regression line represents measurements within each patient for each patient, with each point being the mean of one intervention.

Left ventricular (LV) pre-excitation/post-excitation and relationship to LV dP/dtmax and QRS duration (QRSd). The figure displays the normalised average changes across all pacing modes and electrode configurations between the pre-excitation/post-excitation classes (PCs). The dP/dtmax curve is at the apex with pre-excitation of the LV (PC2), while the QRSd curve reaches its nadir with post-excitation (PC3).
The impact of AV-delay on LV dP/dtmax and QRS duration
Table 1 presents the measured AV-delays in different groups. Stimulation of the LV before or after the QRS onset in the FUSION group resulted in a significant correlation between the degree of LV pre-excitation/post-excitation (ms) and AV-delay (ms) (R=0.73, p<0.01). The association between the degree of LV pre-excitation (ms) and AV-delay (ms) in the NO FUSION group was weak (R=0.29, p<0.01). The association between AV-delay and degree of pre-excitation/post-excitation could potentially affect the results, as AV-delay have a known impact on dP/dtmax. We, therefore, studied the relationship between AV-delay and dP/dtmax in the patients. We included all the data from the study in the regression analyses and found a quadratic relationship between AV-delay and dP/dtmax (figure 6). Figure 6 shows how LV dP/dtmax trends towards lower values at ultrashort and long AV-delays; however, even at ‘optimal’ AV-delays, 150–180 ms, a broad span in LV dP/dtmax of almost 1000 mm Hg/s is observed between the patients. We also examined the relationship between AV-delay and LV dP/dtmax in the mixed models with MPP (FUSION and NO FUSION) and PC3 only to avoid confounding effects of pre-excitation/post-excitation and to test the within-subjects changes. We found no impact of AV-delay on LV dP/dtmax (p=0.09). We included AV-delay as a covariate in the mixed models reported in this study and observed no additional AV-delay effects that would change the results. We also measured the delay from AP to LV pace and compared it to LV dP/dtmax and found no significant relationship (online supplemental figure 4).
Supplemental material

Relationship between AV-delay and left ventricular (LV) dP/dtmax. We pooled all data and found a weak quadratic relationship between mean LV dP/dtmax and AV-delay (p<0.01).
Discussion
Besides that from resynchronisation, fusion strategies may have an independent impact on LV dP/dtmax and QRSd. As an example, we know that LV dP/dtmax increases to a similar extent, with full LV pre-excitation and biventricular stimulation (resynchronisation). The reason must be independent of resynchronisation. LV-only pacing without fusion with intrinsic conduction introduces more dyssynchrony compared with biventricular pacing.16 17 Therefore, since LV dP/dtmax is equally high with LV-only and biventricular pacing, the measurement lacks the ability to confirm resynchronisation as a diagnostic biomarker.18 When measured as an increase from baseline, LV dP/dtmax may not increase to the most considerable extent in positions were QRSd shorten the most.8 The fact that LV dP/dtmax does not necessarily reflect better resynchronisation may also explain why MPP that increase LV dP/dtmax and shorten QRSd acutely failed to show a clinical benefit compared with conventional BIVP in the MOre REsponse to Cardiac Resynchronization Therapy with Multi-Point Pacing (MORE-CRT) study.10 11 19 The predictive value of an increase in LV dP/dtmax from baseline for determining the response to CRT is weak. It seems that fusion and LV pre-excitation, inevitably linked to CRT, contribute independently to a rise in LV dP/dtmax and a change in QRSd.7 15 It is essential to understand the measurements’ respective value as biomarkers if one would use them for acute prediction of long-term response during CRT implantation.5 6 18 20 This study was designed to provide knowledge on how different fusion strategies and LV pre-excitation/post-excitation determine QRSd and LV dP/dtmax to provide information on the two’s potential utility as biomarkers for the prediction of long-term response to CRT. We show that the two parameters have different determinants, and with LV dP/dtmax, LV pre-excitation is likely to provide a better response, while simultaneous pacing with multiple activation wavefronts are likely to decrease QRSd the most. The latter is in keeping with better electrical resynchronisation.
Patient characteristics and Q-LV measured from the LV electrodes seen in this study are typical for patients with LBBB, and as expected, LV dP/dtmax increased with biventricular stimulation compared with AP or RV pace and QRSd shortened. A significant correlation between VV-delay and LV dP/dtmax revealed itself when we changed VV-delay (pre-excitation/post-excitation) within each patient during biventricular stimulation. LV pre-excitation was associated with higher LV dP/dtmax. Although LV dP/dtmax increased the most with LV pre-excitation, we found that QRSd shortened the most when pacing the LV close to the onset of QRS or RV-pace. Simultaneous activation of LV and RV is likely to cause a narrower QRS complex.21 Overall, FUSION, MPP and pacing close to QRS and RV-pace onset (PC3) provided the shortest QRSd, similar to what has been documented by others.22 23 Hence, LV dP/dtmax and QRSd show different response patterns to LV pre-excitation/post-excitation (figure 5). Univentricular LV stimulation without intrinsic activation of the RV can increase LV dP/dtmax to values above what is seen with standard biventricular pacing.4 10 15 24 The reason for this is still unclear, but contractility itself is not likely to be affected by LV-only stimulation.25 The increase in LV dP/dtmax with LV pre-excitation may relate to stimulation of a larger ventricular mass in the LV electrode region.26 The distal electrode resulted in higher LV dP/dtmax than the proximal electrode. The distal electrode is also likely to capture more myocardium before reaching the mitral valve annulus’s boundaries compared with the proximal electrode, and MPP may capture even more. The amount of myocardium captured over time may partly explain a higher LV dP/dtmax when pacing with different electrode configurations (see illustrations in figure 1).
To achieve LV pre-excitation/post-excitation, we needed to pace with different AV-delays. We know that the AV-delay influences LV dP/dtmax under otherwise similar haemodynamic conditions4; however, in this study, the effect of LV pre-excitation on LV dP/dtmax was stronger than that resulting from a change in AV-delay. AV-delay was shorter in the NO FUSION group; however, LV dP/dtmax was higher with LV pre-excitation in both groups, also when corrected for AV-delay. We changed AV-delay along a wide range of intervals; however, the association between LV dP/dtmax and LV pre-excitation was unaffected by AV-delay. The significance of LV pre-excitation in LBBB patients as a determinant of LV dP/dtmax was therefore confirmed, in keeping with recent clinical, animal and computational experiments.27 We also showed that LV dP/dtmax increased, resulting from even subtle LV pre-excitation (PC2).28 LV pre-excitation can also be achieved by pacing LV at multiple sites. Pacing the LV with pre-excitation in time (PC1–2) and in space (MPP), or both, increased LV dP/dtmax (figure 3). In our study, we found that LV dP/dtmax was higher in the NO FUSION group compared with the FUSION group in contrast with what has been found in similar studies.14 The different degrees of LV pre-excitation between the groups were different in our study compared with the intervals investigated by van Gelder et al, and may explain the differences found. Besides, beneficial haemodynamics to determine the optimal response, other than LV dP/dtmax, resulting from intrinsic activation of the RV may not be recognised using LV dP/dtmax.27 LV pacing only has not proven beneficial compared with biventricular stimulation on long term.29 A recent multicenter controlled trial prospective controlled trial showed an increase by 13% in beneficial remodelling (ie, ESV reduction) after 6 months’ follow-up when using LV dP/dtmax for LV lead optimisation compared with a standard approach in CRT, but still with a 27% non-responder rate.30 Subanalyses of the Radi-CRT study also showed no differences in long-term response among patients with non-ischaemic aetiology, indicating that the effect from selecting electrodeposition based on a higher LV dP/dtmax would mainly benefit patients with an ischaemic aetiology. Twenty-eight per cent of patients without a <10% increase in LV dP/dtmax experienced long-term reverse remodelling, while 16% with a >10% increase in LV dP/dtmax did not experience long-term reverse remodelling. Therefore, it is quite clear that an increase in LV dP/dtmax from one pacing site to another carries information that leads to an increased response rate, but an increase in LV dP/dtmax from baseline does not necessarily reflect better resynchronisation to predict long-term outcomes.17 Interpretation of a higher LV dP/dtmax as being haemodynamically superior, reflecting better resynchronisation, with one approach compared with a different approach, may not be warranted.7 11–13 15
Fusion-optimised intervals leading to shorter QRSd,23 31 shortening of QRSd and a reduction in QRS area are associated with improved remodelling and mortality.1 3 23 QRSd incorporates essential elements (eg, left ventricular activation time) of dyssynchrony.20 Our study MPP provided shorter QRSd than pacing from single electrodes, suggesting that shortening of QRSd in our study also reflects the shortening of the left ventricular activation time.10 If shortening of QRSd were to be the sole target for a response; however, our data suggest that this will come at the cost of not optimising LV dP/dtmax and vice versa. Concurrently, QRSd may not shorten to the most considerable extent with CRT when pacing LV from sites that reflect the maximal mechanical response.8 Even if shortening of the QRSd with pacing is the desired response, it is still not a perfect measure for long-term prediction.3 Figure 3 shows that with the shortest QRSd, LV dP/dtmax increased, on average, only by 7%. Our study shows how LV dP/dtmax may paradoxically increase in situations where QRSd gets longer.
Clinical implications
This study points out that mechanical function assessment, with LV dP/dtmax, and electrical activation, with QRSd, may provide conflicting results. We expect that electrical activation and mechanical action is positively concordant with successful resynchronisation.7 8 Our study shows that pre-excitation of the LV is associated with a higher dP/dtmax and longer QRSd than less pre-excitation. LV pre-excitation rather than the effect from resynchronisation may determine an increase in LV dP/dtmax from baseline. Therefore, a higher percentage increase in LV dP/dtmax from baseline values should not be interpreted as a better result when assessing the effect of resynchronisation.
Limitations
The lack of direct insight into LV activation time intervals and exact electrical propagation in the tissue are limitations in this study. LV activation time, propagation and activated area over time would be better measures of the effect of fusion and resynchronisation than QRSd. MPP may promote better resynchronisation in the presence of a scar.32 33 Therefore, the presence of scar could potentially explain improvements in LV dP/dtmax with MPP and LV pre-excitation but would not concurrently explain the associated prolongation of QRSd. We did not clearly identify the presence of scar in our patients, despite that 43% of the patients had ischaemic heart disease. The knowledge of myocardial scar location and different study design could have brought insight into the effect of a scar on both LV dP/dtmax and QRSd. Multisite pacing with a larger electrode separation could have provided an even more apparent LV pre-excitation effect.10 Placement of the RV and LV electrodes in close proximity could have affected the degree of fusion and pre-excitation resulting from LV activation. Of the patients in this study, 16% were classified as not having true LBBB, and fusion with intrinsic conduction in such patients may be different from fusion with LBBB. We did, however, document a long Q-LV in all patients (online supplemental figure 1). The RV paced to LV sensed interval is presented in relation to QRSd in the supplement. Stimulation from within a scar resulting in delayed myocardial activation may have affected the degree of pre-excitation and lead to misclassification of LV pre-excitation. We did not, however, find a bias in the paced to sense RV-LV and LV-RV intervals (online supplemental figure 1).
Conclusion
Biventricular pacing increases LV dP/dtmax and shortens QRSd depending on different degrees of fusion of electrical wavefronts in the heart. LV pre-excitation determines an increase in LV dP/dtmax and a longer QRSd, while MPP and LV pacing timed with RV activation shorten QRSd with lower resulting LV dP/dtmax. In this study, LV dP/dtmax is therefore determined mainly by LV pre-excitation, while QRSd is determined by optimal resynchronisation.
Data availability statement
Data are available on reasonable request.
References
Supplementary materials
Supplementary Data
This web only file has been produced by the BMJ Publishing Group from an electronic file supplied by the author(s) and has not been edited for content.
Footnotes
Contributors HHO: Conceived study protocol, organised the study, performed analyses, wrote the manuscript. TH: Participated in the study, revised the manuscript. LOG: Conceived study protocol, organised the study, revised the manuscript. ROC: Conceived study protocol, organised the study, revised the manuscript. EK: Conceived study protocol, participated in the study, revised manuscript.
Funding The study was supported by a grant from Helse Sør-Øst RHF.
Competing interests LOG and RC are full-time employees in Medtronic. HHO has received honorary from Abbott Medical, Stockholder Pacertool; patent applications within the field of cardiac resynchronisation therapy.
Provenance and peer review Not commissioned; externally peer reviewed.