Article Text

Abstract
Background First-phase ejection fraction (EF1), the left ventricular (LV) ejection fraction (EF) until the time of peak transaortic velocity, is a novel marker of subclinical LV dysfunction able to predict adverse events in aortic stenosis (AS). This study investigated the association between end-systolic wall stress (ESWS) and EF1 in severe AS, as well as the prognostic value of EF1 in severe asymptomatic AS.
Methods Two prospectively gathered cohorts of 94 asymptomatic patients and 108 symptomatic patients scheduled for aortic valve replacement (AVR), all with severe AS (aortic valve area <1 cm2) were stratified according to the median value of EF1 (33%). EF1 was defined as the EF at peak transaortic velocity. Asymptomatic patients were followed up for 3 years for the combined end-point of death, AVR or admission with heart failure.
Results EF1 correlated with EF and was inversely associated with ESWS. In multivariate regression analysis, ESWS (p<0.001) and replacement fibrosis measured by MRI (p=0.02) were associated with EF1. Among asymptomatic patients, EF1 above the median was associated with the combined primary endpoint (HR=0.53 (95% CI 0.33 to 0.87)), while global longitudinal strain and EF were not. Among 42 patients with discordant AS (mean gradient <40 mm Hg), EF1 above median was associated with the primary endpoint (HR 0.28 (95% CI 0.12 to 0.61)).
Conclusion EF1 is an afterload-dependent measure that is associated with events in patients with asymptomatic severe AS. The afterload dependency of EF1 may be useful in timing of risk stratification in patients with discordant AS.
Trial registration numbers NCT02395107 and NCT02316587.
- echocardiography
- aortic valve stenosis
- magnetic resonance imaging
This is an open access article distributed in accordance with the Creative Commons Attribution Non Commercial (CC BY-NC 4.0) license, which permits others to distribute, remix, adapt, build upon this work non-commercially, and license their derivative works on different terms, provided the original work is properly cited, appropriate credit is given, any changes made indicated, and the use is non-commercial. See: http://creativecommons.org/licenses/by-nc/4.0/.
Statistics from Altmetric.com
Key questions
What is already known about this subject?
The novel marker first-phase ejection fraction (EF1) may provide additional information on prognosis among patients with aortic stenosis (AS).
What does this study add?
EF1 is strongly associated with end-systolic wall stress in AS and is inversely associated with a poor outcome in asymptomatic severe AS, especially among patients with low-gradient AS.
How might this impact on clinical practice?
EF1 may be a sensitive marker of early left ventricular deterioration and has the potential to stratify the risk patients with discordant AS.
Introduction
The presence of symptoms or left ventricular (LV) ejection fraction (LVEF) <50% are class 1 indications for aortic valve replacement (AVR) in severe aortic stenosis (AS).1 However, as LV functional abnormalities may be frequent despite LVEF ≥50%,2 several investigators have proposed the use of global longitudinal strain (GLS), as this deformation measure is able to detect early stages of LV dysfunction and may identify patients suitable for early surgery.3 4 Furthermore, GLS has been suggested to provide insights when identifying patients with true severe AS, among those with low-gradient severe AS.5
First-phase LVEF (EF1), an echocardiographic marker measuring LVEF at the time of peak transaortic velocity using standard two-dimensional images, has emerged as a novel marker of LV function. In a recent study, EF1 outperformed GLS and LVEF as a marker of outcome in patients with AS, although the mechanism is less clear.6 EF1 shares some of the load dependency of GLS and LVEF making the interpretation of this measure difficult, in a disease such as AS with inherent afterload changes.
The purpose of this study was thus: first, to examine the echocardiographic and demographic factors associated with EF1; second, to determine the impact of EF1 on outcome in patients with severe asymptomatic AS; and third, to study if EF1 can be used to identify low-risk patients, among those with severe low-gradient AS.
Methods
This was a retrospective study including two previously well-described prospective cohort studies performed at our institution between 2014 and 2017.7 8 The first cohort included asymptomatic patients with aortic valve area (AVA) <1 cm2, maximal aortic peak velocity >3.5 m/s and LVEF >50% recruited at the outpatient clinic. Patients underwent a conventional cycle ergometer test to ascertain that they were truly asymptomatic. The second cohort included symptomatic patients with severe AS (AVA <1 cm2) referred to AVR.
To allow MRI with contrast, all patients with chronic kidney disease (estimated glomerular filtration rate <40 mL/min/1.73 m2), persistent atrial fibrillation or flutter or pacemaker were excluded, along with patients with predominant aortic regurgitation or more than mild mitral regurgitation/stenosis. The studies were registered with ClinicalTrials.gov (NCT02395107 and NCT02316587). All patients gave written informed consent.9
Data collected included baseline demographics and risk factors, biomarkers, echocardiography and outcome data for all patients as well as MRI for a majority of patients (figure 1).
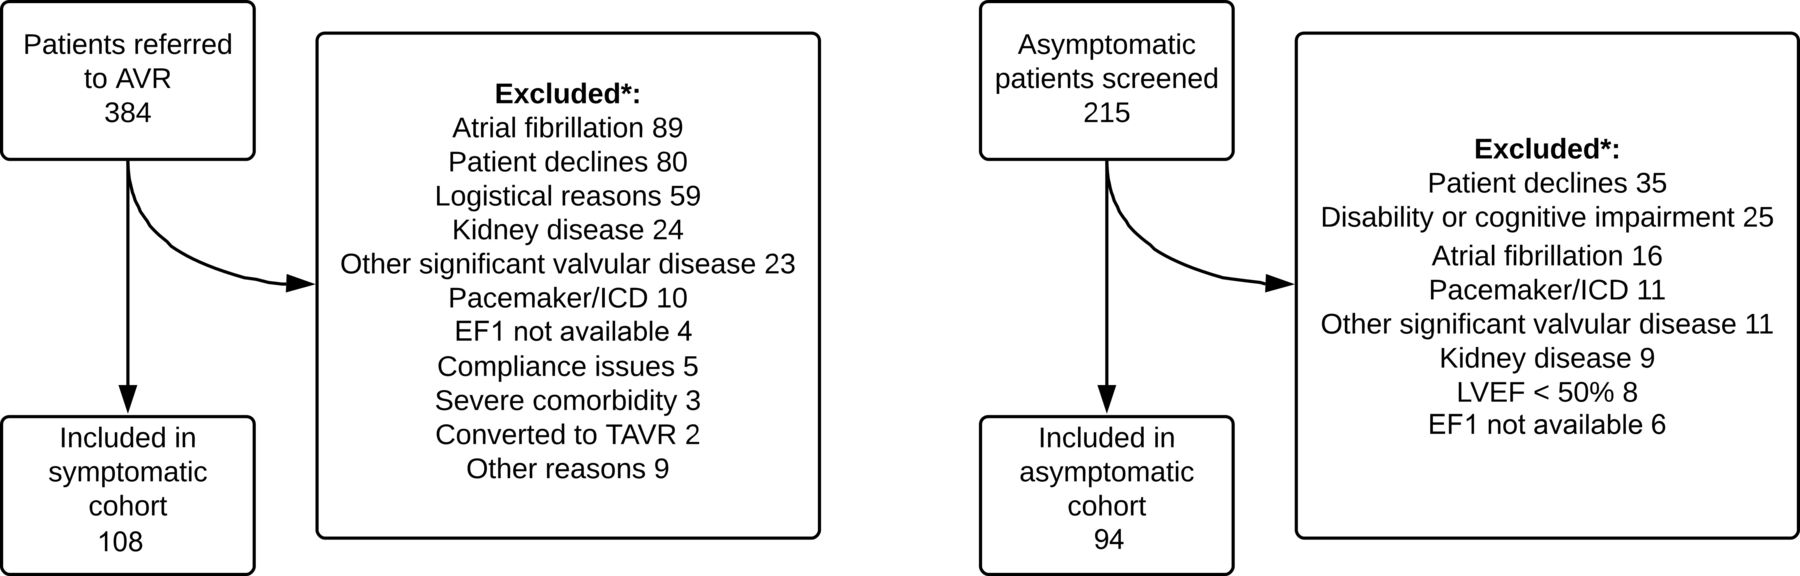
Consort diagram for asymptomatic and symptomatic cohort. AVR, aortic valve replacement; EF1 first-phase ejection fraction; ICD, implantable cardioverter defibrillator; LVEF, left ventricular ejection fraction; TAVR, transcatheter AVR.
Echocardiography
Echocardiograms were performed on a GE Medical Vivid 9 ultrasound machine (GE Medical System, Horten Norway). Images were analysed offline on EchoPAC PC 08 (GE Medical System) according to American Society of Echocardiography and the European Association of Cardiovascular Imaging recommendations.10 Diastolic function was determined according to 2016 European Association of Cardiovascular Imaging/American Association of Echocardiography guidelines.11
Valvulo-arterial impedance (ZVA) and systemic arterial compliance were calculated as previously described.12 AVA was determined with the continuity equation from LV outflow tract diameter and Doppler curves from the LV outflow tract and aortic transvalvular gradient. All patients had severe AS defined as AVA <1 cm2. High-gradient AS was defined as mean gradient ≥40 mm Hg; normal-flow, low-gradient AS as mean gradient <40 mm Hg and stroke volume index (SVi) ≥35 mL/m2; paradoxical low-flow, low-gradient AS as mean gradient <40 mm Hg, SVi <35 mL/m2 and LVEF ≥50%; and classical low-flow, low-gradient AS as mean gradient <40 mm Hg, SVi <35 mL/m2 and LVEF <50%0.13 For further details on echocardiographic analyses, we refer to a previously published article on the same two cohorts.9
Calculation of EF1
EF1 was calculated as the percentage of change in LV volume from end-diastole to the time of peak transaortic velocity (EF1=(LV end-diastolic volume−LV peak systolic volume)/LV end-diastolic volume).14 Time of peak transaortic velocity was measured on continuous wave Doppler of aortic flow. LV volume corresponding to this timestamp was measured in apical four-chamber and two-chamber views taking the frame rate into account (figure 2). All measurements were performed thrice and averaged in sinus rhythm. No patients were in atrial fibrillation.
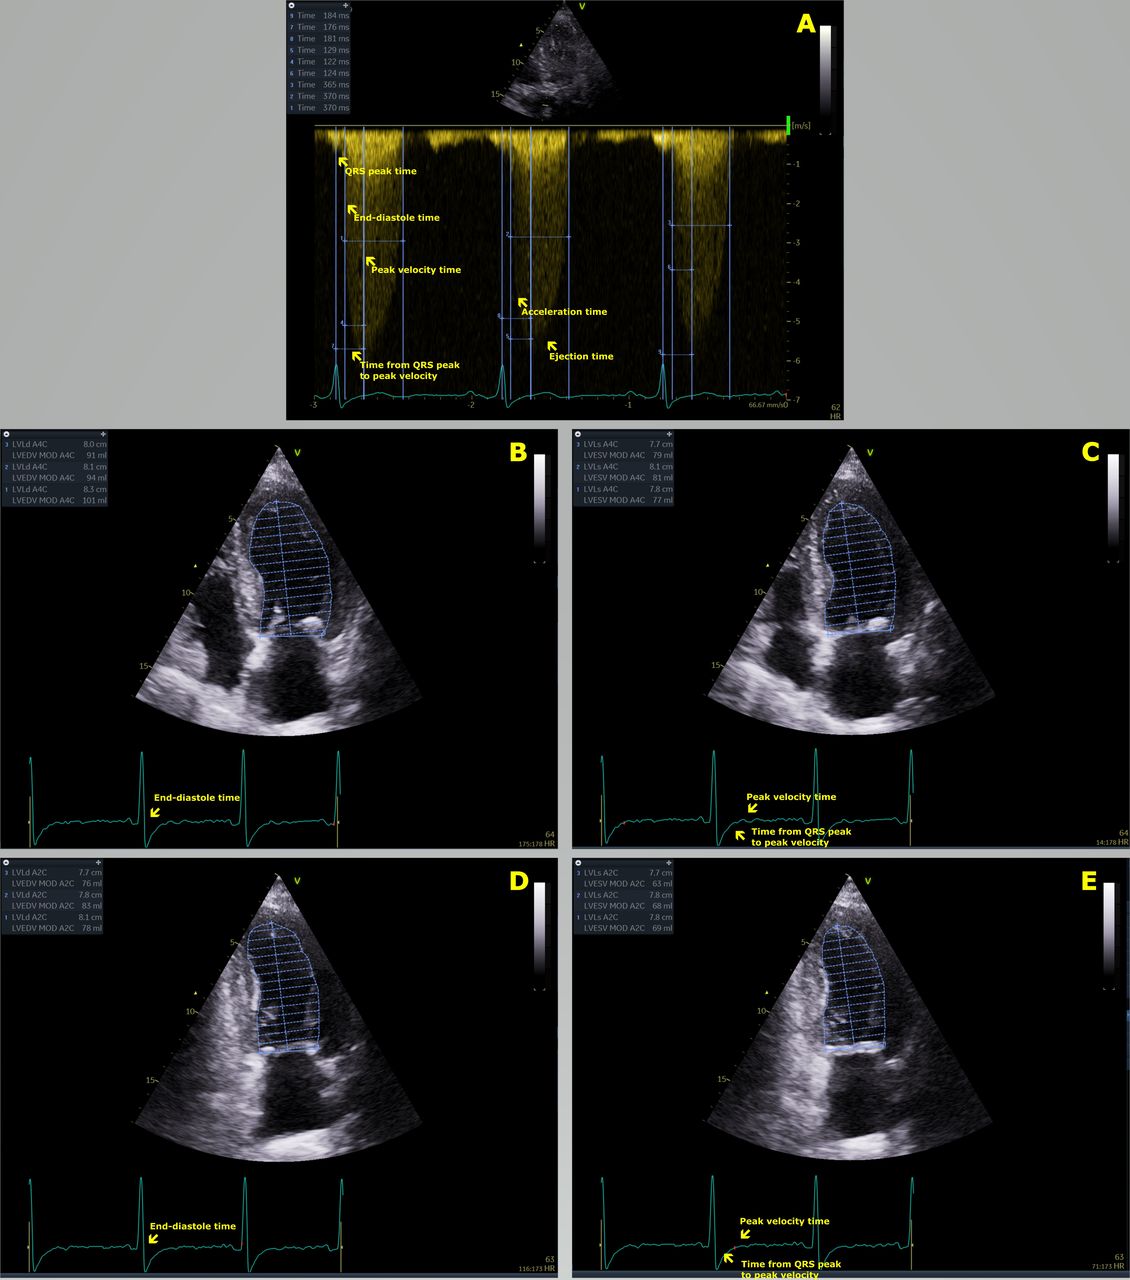
Measurement of first-phase ejection fraction in a single patient: (A) measurement of LV ejection time (368 ms) and peak LV ejection time (125 ms). (B and C) Measurement of end-diastolic volume (88 mL) from four-chamber and two-chamber images. (D and E) Measurement of LV peak systolic volume, using QRS peak time (A) as an anchorpoint, at peak LV ejection time (73 mL) and calculation of first-phase ejection fraction (15%). LV, left ventricular.
Flow rate in the first and latter part of systole was derived from volumetric measurement of LV divided by time. First part systolic flow rate: (LV end-diastolic volume−LV peak systolic volume)/acceleration time. Second part systolic flow rate: (LV peak systolic volume−LV end-systolic volume)/(LV ejection time−acceleration time).
Cardiac MRI
MRI was performed prior to AVR on a Philips Ingenia 1.5 T scanner with Omega HP gradient system (Philips Electronics, Koninklijke, Netherlands). A number of 20–24 sequential short axis cine slices of 8 mm thickness were acquired encompassing the entire heart during multiple breath holds. Images were analysed blinded for other data on Extended Philips WorkSpace software package (V.2.6.3.5 2013).
Late gadolinium enhancement (LGE) images were obtained 10 min after bolus injection of 0.1 mmol/kg gadoterate meglumine (Dotarem, Guerbet, Aulnay-Bois, France). The inversion time was adjusted from visual inspection of a Look-Locker image to null the myocardium. LGE patterns were reported as ischaemic (subendocardial or transmural patter) or midwall.
LV end-systolic wall stress (ESWS) was calculated as previously described.9
Events
Patients in the asymptomatic cohort were followed up through chart review. A combined end-point of death, AVR or admission with heart failure was selected. The decision to perform AVR was made by a multidisciplinary heart team, based on emerging symptoms or other class one or two indications for AVR and not influenced by the participation in this study.
Patients were at baseline stratified into two groups according to the median EF1 for the combined cohort.
Statistics
Data are presented as mean±SD, median and (IQR) or number (percentages) as appropriate. Normality was tested visually by qq-plots and histograms. Differences between groups were tested by Student’s t-test; non-parametric variables were log-transformed and if this approximated normality, they were tested by Student’s t-test, otherwise they were tested by Wilcoxon signed-rank test; categorical variables were tested by the χ2 test unless the number of events was lower than five, in which case the Fischer’s exact test was used. A univariate and multivariate linear regression analysis to identify variables associated with EF1 was performed, with age and gender forced into the multivariate model.
In the asymptomatic cohort, parameters associated with the combined end-point of death, AVR or clear symptoms among inoperable patients during follow-up were analysed with multivariate Cox regression. Age and gender were forced into the multivariate model. Proportionality and goodness of fit were assessed with Schoenfeld and Cox-Schnell residuals. Receiver operating characteristics was performed to assess the prognostic value of clinically relevant covariates on the combined endpoint within 2 years from baseline. Comparison of the predictive value of different covariates was performed by comparing area under the curve with a Wald test.
Intraobserver and interobserver variability of EF1, LV end-diastolic and peak systolic volume and peak LV ejection time was performed in respectively 17 and 18 patients with Pearsons’ correlation as well as Bland-Altman plots.
A p value <0.05 was considered significant. STATA/IC V.14.1 (StataCorp LP, Texas, USA).
Results
A total of 202 patients were included in the study, 94 from the asymptomatic cohort and 108 from the surgical cohort. For the combined cohort mean EF1 was 33%±7% with 107 patients (53%) having EF1 ≥33% (upper median EF1 group).
EF1 and baseline and echocardiographic measurements at baseline
Patients in the upper median EF1 group were less likely to be in the surgical cohort and less symptomatic whether measured by New York Heart Association or Canadian Cardiovascular Society grade. Furthermore, they had lower levels of brain natriuretic peptides (table 1). Patients with previous myocardial infarction or percutaneous coronary intervention had lower EF1 (29%±9% vs 33%±7%, p=0.002).
Patient characteristics
Patients in the upper median EF1 group had lower end-diastolic and end-systolic volumes and better systolic function measured as higher LVEF (67%±8% vs 59%±11%, p<0.0001) and better GLS (−18.7%±3.2% vs −16.0%±4.0%, p<0.0001). Despite no difference in AVA, mean gradient and systemic arterial compliance between groups, Zva was significantly lower in the upper median EF1 group.
Patients in the upper median EF1 group had a higher SVi and a larger stroke volume in the first systolic phase (37±11 vs 28±9 mL, p<0.0001) but a lower stroke volume in the second systolic phase (29±13 vs 37±18 mL, p=0.0001). Similarly, they had a higher flow rate in the first systolic phase (353±117 vs 255±84 mL/s, p<0.0001) and a lower flow rate in the second systolic phase (144±65 vs 192±93 mL/s, p<0.0001) (figure 3).
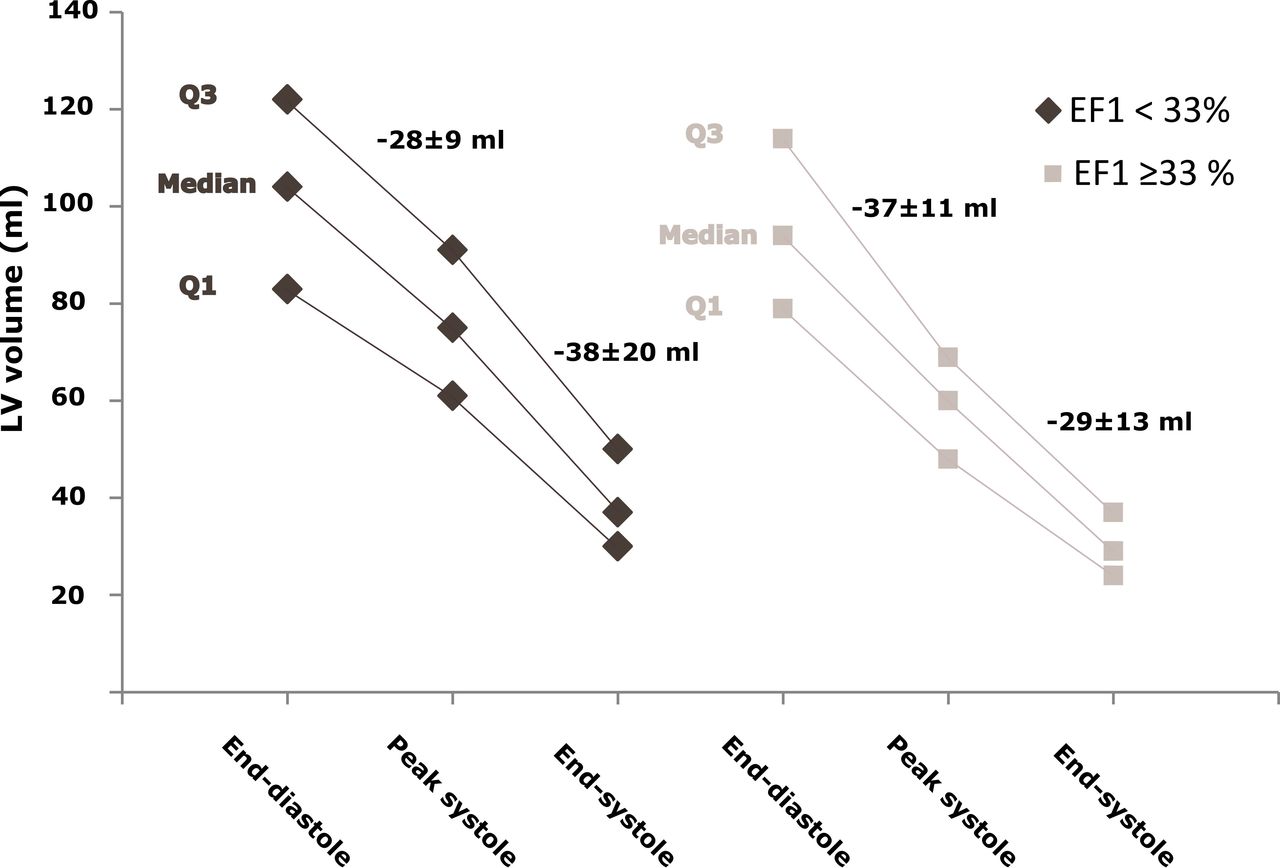
Flow volume profile for patients with EF1 <33% and EF1 ≥33%, showing that patients with high EF1 have a more rapid ejection in the first systolic phase until peak ejection, despite a similar stroke volume. EF1, first-phase ejection fraction; LV left ventricle; Q1, upper quartile; Q3, lower quartile.
MRI was available in 73 patients from each cohort. Patients in the upper median EF1 group had lower MRI measured ESWS. They had less MRI LGE, especially less of the ischaemic type (4 vs 22%, p=0.001).
Factors associated with EF1first-phase ejection fraction
For the two cohorts combined EF1 associated positively with LVEF (Spearman’s rho=0.32, p<0.0001) and inversely with ESWS (rho=−0.50, p<0.0001) and GLS (rho=−0.38, p<0.0001) (online supplemental figure 1). The association between EF1 and ESWS was also present, when stratified according to AVA <0.6 cm2 (rho=−0.59, p=0.005), AVA 0.6–0.8 cm2 (rho=−0.46, p=0.0004) and AVA 0.8–1.0 cm2 (rho=−0.48, p<0.0001).
Supplemental material
With linear regression analysis for both cohorts combined (table 2), several variables were univariably associated with EF1, but ESWS (p<0.001) and LGE fibrosis (p=0.02) were the only variables independently associated with EF1 on multivariate analysis.
Multivariable linear regression for first phase ejection fraction – both cohorts combined (%)
Test reproducibility
Although LV end-diastolic volume and LV peak ejection time showed sufficient reproducibility, LV peak systolic volume and EF1 revealed intraobserver variability (EF1: mean difference −7%±8% SD, Pearson’s r=0.46, p=0.06) and interobserver variability (EF1: +2%±6%, Pearson’s r=0.36, p=0.14) (online supplemental figure 2).
Asymptomatic cohort follow-up
For the asymptomatic cohort, during a median follow-up time of 3.0 years, 68 (72%) patients reached the combined end-point (54 AVR, 13 died and 1 admitted with overt heart failure but was inoperable).
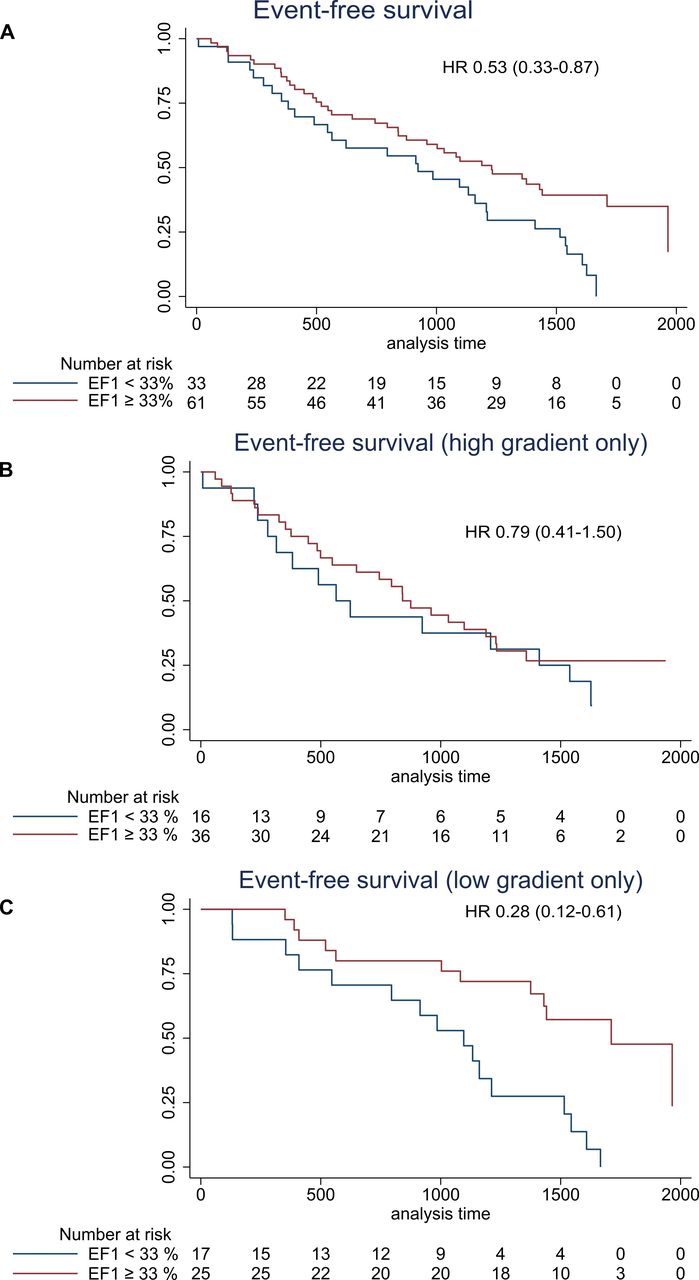
With multivariate cox regression analysis, higher mean gradient (HR 1.02 (95% CI 1.01 to 1.04) per mm Hg, p=0.008) and lower EF1 (HR 0.96 (95% CI 0.92 to 1.00) per %, p=0.03) were the only significant variables associated with the combined end-point (table 3). Patients in the upper median EF1 group were less likely to reach the combined primary endpoint (HR=0.53 (95% CI 0.33 to 0.87), p=0.01).
Univariable and multivariable Cox regression for AVR-free survival in asymptomatic cohort
During the first 2 years, a total of 33 patients from the asymptomatic cohort reached the combined endpoint. Receiver operating characteristics showed that a high mean gradient ≥40 mm Hg predicted the endpoint with area under the curve (AUC) of 0.62. Adding LVEF, GLS or EF1 increased the AUC to 0.66, 0.64 and 0.67, respectively. None of these values were significantly higher than the AUC for high mean gradient alone.
EF1 in severe low-gradient AS
For both cohorts combined, patients with classical low-flow, low-gradient AS (n=6) had significantly lower EF1 (22%±10%) than patients with paradoxical low-flow, low-gradient AS (n=13: 32%±8%), normal-flow, low-gradient AS (n=66: 33%±7%) and high-gradient AS (n=117: 33%±7%) (oneway analysis of variance p=0.003).
In the asymptomatic cohort, patients with low gradient (low flow and normal flow combined) were characterised by larger AVA and smaller SVi (online supplemental table 1).
As there was a significant interaction between EF1 and transaortic mean gradient (p=0.003), the prognostic information of EF1 was stratified according to mean gradient in the asymptomatic cohort. Among asymptomatic patients with a mean gradient <40 mm Hg, EF1 as a continuous variable predicted the combined endpoint (HR=0.91 (95% CI 0.86 to 0.97), p=0.005), and patients in the upper median EF1 group were less likely to reach the combined endpoint with a HR of 0.28 (95% CI 0.12 to 0.61), p=0.002. GLS did not significantly predict the outcome (HR=1.09 (95% CI 0.98 to 1.20), p=0.11).
In the subset of asymptomatic patients with mean gradient ≥40 mm Hg, EF1 as a continuous variable (HR 0.98 (95% CI 0.93 to 1.03), p=0.39) or divided according to the median (HR 0.78 (95% CI 0.41 to 1.50), p=0.45) was not associated with the endpoint (figure 4).
Event-free survival curves (death or aortic valve replacement) for patients with asymptomatic aortic stenosis. (A) All asymptomatic patients disregarding gradient. (B) Patients with mean gradient ≥40 mm Hg only. (C) Patients with mean gradient <40 mm Hg only. EF1, first-phase ejection fraction.
Discussion
In this study of patients with asymptomatic and symptomatic severe AS, we demonstrate that EF1 is independently associated with LV ESWS and LGE fibrosis. Furthermore, we show that EF1 is independently associated with risk of AVR, death or development of heart failure in patients with asymptomatic severe AS with LVEF >50%. Finally, we demonstrate that EF1 may provide insights into the prognosis of patients with asymptomatic low-gradient severe AS.
In pressure overload conditions such as AS, LVEF is preserved in the normal range through the use of preload reserve, increased contractility and LV remodelling.15 Similarly, ESWS is preserved in the normal range despite increased intraventricular pressure due to concentric remodelling with increased relative wall thickness.9 When this balance is disturbed, ESWS increases and LVEF decreases. Even small decreases in LVEF have a negative effect on outcome before and after AVR,16–18 and symptoms most often occur before LVEF decreases, so more sensitive markers of LV dysfunction are warranted.
Although the concept of ‘first-third LVEF’, the LVEF during the first third of systole, was introduced 40 years ago and was shown to predict mortality after myocardial infarction,19 the idea of EF1 is relatively novel. It was introduced in 2017 by Gu and colleagues14 in a study of patients with hypertension, where they showed that EF1 was independently associated with the diastolic marker E/e’. In the subsequent paper, the same study group demonstrated that EF1 was a strong predictor of events among patients with moderate to severe asymptomatic AS6 and confirmed these findings in a second cohort of patients with mild to severe AS.20 Recently, two different papers from other sites with Gu as coauthor20 21 have shown similar results in patients with mild to severe AS. We corroborate these findings and extend them to apply patients with exclusively severe AS. The latter is an important finding as inclusion of both patients with mild to severe AS may introduce a bias as most markers of systole demonstrate some load dependency. In fact, we demonstrate an important load dependency of EF1, as ESWS in our study was the variable most closely associated with EF1. Furthermore, EF1 and ESWS were closely associated with each other, even when stratified according to AVA, meaning that EF1 is not simply a measurement of AS severity, but a measurement of the afterload that AS imposes on the LV. These findings are also in agreement with a previous paper by Gu et al14 demonstrating that lowering of afterload with nitroglycerin resulted in higher EF1 and another study by Bing et al20 showed that EF1 increased after AVR with the reduction in afterload. During the normal systolic ejection phase, most of the stroke volume is delivered to the aorta in the early part of systole. When AS becomes more severe, the proportional time to peak systole increases.22 By definition, patients with low EF1 have a different flow pattern than patients with high EF1, with lower flow rate in the first part of systole and higher flow rate in the second part of systole. A higher ESWS in these patients leads to a more inefficient early systolic period, but the LV compensates by sustaining the contraction in the later systolic period. The probable mechanism behind this is reduced ‘shortening deactivation’, a feedback mechanism controlling the intracellular flux of Ca2+ during systole. This has been shown in murine models, where a reduction in sarcomere length during early systole slows the Ca2+ influx in later systole, whereas an isometric contraction leads to prolonged elevated Ca2+ currents in later systole.23 24
Although impaired shortening deactivation may help preserve stroke volume in the case of severe AS, the negative side is that it also exacerbates ESWS, as it prolongs the contraction into late systole. ESWS is the primary determinant of oxygen consumption in LV afterload diseases,25 and prolonged elevated ESWS may lead to the development of replacement myocardial fibrosis,9 26 leading to reduced coronary perfusion, ischaemia and replacement fibrosis. In the present study, we demonstrate an association between EF1 and replacement fibrosis, an association that probably can be explained by the ability of EF1 to detect increasing ESWS that leads to the cascade resulting in heart failure.
Association with outcome
We confirm the earlier findings that EF1 is a predictor of events in AS6 20; however, our association between EF1 and outcome was less pronounced. Contrary to Gu et al and Bing et al, we included only patients with severe AS; Gu et al had found the strongest association among patients with moderate AS. Nonetheless, EF1 was in our study still one of only three independent predictors of outcome and outperformed LVEF and GLS. This is interesting, as GLS has been shown to be a promising marker of outcome, even in moderate AS.27 Most previous studies examining the association between GLS and outcome have included both moderate and severe AS, whereas we included only severe AS. As GLS is strongly afterload dependent, this may account for our lack of association between GLS and outcome.
Although the strong association between afterload and EF1 may be regarded as a limitation, it may in fact be clinically useful in cases where AS severity is unclear. It is thus interesting that we demonstrate that EF1 provided the strongest prognostic data among patient with low gradient severe AS (discordant AS), as the management of these patients is controversial. Although there may be some symptomatic benefit after AVR among patients with normal-flow, low-gradient AS,7 the prognostic benefit is debated28 29 and recommendations are to generally manage them as moderate AS.1 Paradoxical low-flow, low-gradient AS patients often have a slower progression of disease than AS patients with a high gradient and more rarely progress to AVR.28 30 EF1, therefore, has the potential to act as a marker of outcome in these patients, and may possibly identify the patients most likely to progress to AVR.
Limitations
Compared with previous published papers, our measured EF1 was higher. Thus far, Gu has been involved in all published papers on EF1, so more studies from different laboratories are needed to determine the normal values of EF1.
We excluded asymptomatic patients with peak jet <3.5 m/s, and our findings therefore cannot be extrapolated to patients with more pronounced low-gradient AS.
EF1 in our study showed a poor reproducibility, which may limit its use in its current form. Considerable effort should therefore be applied in future studies to improve the method and thereby limit measurement variability. Increasing sweep speed and adjusting gain should be applied to determine time of peak jet with greatest possible accuracy, and temporal resolution should be kept as high as possible by narrowing the sector. MRI measured EF1 or automatic LV wall tracking could be potential methods. However, despite these shortcomings of our current method, EF1 was still a significant predictor of outcome, illustrating its potential.
Due to a low expected number of events in the AVR group, we were not able to provide data on the impact of EF1 on postoperative outcome, which should be studied in a larger surgical cohort.
Conclusion
In severe AS, EF1 is inversely associated with ESWS and LGE fibrosis. It is a promising independent marker of events in asymptomatic AS. It could therefore be used as an early marker of LV deterioration in severe asymptomatic AS, especially among patients with discordantly graded AS.
References
Supplementary materials
Supplementary Data
This web only file has been produced by the BMJ Publishing Group from an electronic file supplied by the author(s) and has not been edited for content.
Supplementary Data
This web only file has been produced by the BMJ Publishing Group from an electronic file supplied by the author(s) and has not been edited for content.
Footnotes
RC-S and NSBM are joint first authors.
Correction notice Author name 'Nils Sofus Borg Mortensen' has been corrected to 'Nils Sofus Borg Mogensen'.
Contributors RC-S: conceptualisation, patient inclusion, collecting data, image analyses, statistical analysis, manuscript draft and revision; NSBM: data analyses, manuscript revision and interobserver analysis; NLC: patient inclusion, collecting data, image analysis and manuscript revision; MA: interobserver analyses and manuscript revision; KBL: manuscript revision; PAP: manuscript revision; JEM: conceptualisation, image analysis, supervision and manuscript revision; JSD: conceptualisation, image analysis, supervision and final manuscript revision.
Funding This work was supported by the Danish Heart Association (grant numbers 13–04 R94-A4520-22801, 15-R99-A5841), the Region of Southern Denmark, Heede Nielsen foundation, Overlaegeraadets foundation, Free Research funds Odense University Hospital, Hartmann foundation, Aase and Ejnar Danielsens foundation and OPEN Region of Southern Denmark.
Competing interests None declared.
Patient consent for publication Not required.
Ethics approval The studies were approved by the Danish Data Protection Agency and the Regional Scientific Ethical Committees for Southern Denmark (S-20130063 and S-20130064).
Provenance and peer review Not commissioned; externally peer reviewed.
Data availability statement Data are not publicly available to due to Danish Data Protection Agency rules.