Article Text

Abstract
Aims Objective of this study was to evaluate the feasibility of the non-invasive dye dilution method to quantify shunt size related to atrial septal defects (ASD).
The diagnostic accuracy of shunt size determination in ASD’s has been suboptimal with common non-invasive methods. We have previously developed a cost-effective and time-effective non-invasive dye dilution method. In this method, the indocyanine green solution is injected into the antecubital vein and the appearance of the dye is detected with an earpiece densitometer.
Methods and results We studied 192 patients with an ASD. Mean pulmonary blood flow/systemic blood flow (Qp/Qs) was measured with dye dilution technique and compared with following methods: Fick’s invasive oximetry (n=49), transoesophageal echocardiography (TEE) measuring ASD size (n=143) and cardiac MR (CMR) (n=9).
For the first 49 patients, Qp/Qs was 2.05±0.70 with the Fick’s invasive oximetry and 2.12±0.68 with dye dilution method with an excellent correlation between the two methods (R=0.902, p<0.001). In the second study sample, the ASD size by TEE was 15±6 mm on average, and the mean Qp/Qs 2.16±0.65 measured with dye dilution method with a good correlation between the methods (R=0.674, p<0.001). Qp/Qs measured with CMR was 1.87±0.40 resulting in a good correlation with the dye dilution method (R=0.696, p=0.037).
Conclusion The dye dilution method with earpiece densitometer recording is a clinically feasible and reliable method to assess shunt size in ASDs.
- congenital heart disease
- stroke
- MRI
- transoesophageal
- minimally invasive
This is an open access article distributed in accordance with the Creative Commons Attribution Non Commercial (CC BY-NC 4.0) license, which permits others to distribute, remix, adapt, build upon this work non-commercially, and license their derivative works on different terms, provided the original work is properly cited, appropriate credit is given, any changes made indicated, and the use is non-commercial. See: http://creativecommons.org/licenses/by-nc/4.0/.
Statistics from Altmetric.com
Key questions
What is already known about this subject?
Invasive oximetry has been the gold-standard method for shunt size assessment.
What does this study add?
Non-invasive dye dilution has an excellent correlation to invasive oximetry and to atrial septal defect size measured with transoesophageal echocardiography.
How might this impact on clinical practice?
Non-invasive dye dilution is a time-effective and inexpensive alternative.
Introduction
Atrial septal defect (ASD) is the most common uncorrected congenital heart defect in adults.1 It creates a left-to-right shunt at the atrial level leading to volume overload and right ventricular enlargement.2 Dilatation of the right ventricle (RV) and atrium on transthoracic echocardiography (TTE) usually raises a suspicion of an ASD. The diagnosis is usually confirmed on transoesophageal echocardiography (TEE).
Decision to close ASD is primarily based on diagnosis of RV dilation by echocardiography but in borderline cases there is a need for shunt size assessment.2 The semi-invasive TEE examination provides good visualisation of the atrial septum and is a reliable method to assess the size of the ASD but does not provide reliable shunt size. On the other hand, cardiac MR (CMR) provides a reliable shunt size and an estimation of the ASD location and dimensions but is limited by cost and availability issues.3 There is an obvious need for a non-invasive, cost-effective and time-effective method for evaluating shunt size in patients with suspected ASD.
Shunt size can be assessed also by catheterisation,4 5 CMR,3 6 radionuclide method,7 8 doppler echocardiography9 10 or the dye dilution method.11 12 Invasive oximetric quantitation of shunting using Fick’s principle described in 19474 has been the gold-standard method for assessing the shunt size.13 However, the dye dilution method is considered equally accurate.14 Both the radionuclide method and echocardiography have suboptimal accuracy in the shunt size determination.15–17
The shunt size measured with dye dilution is an old method, nowadays rarely used. Classically, it has been an invasive method, detecting the appearance of the dye by continuous withdrawal through a densitometer cuvette. The appearance of the dye can also be detected non-invasively using an earpiece densitometer.18–21
The purpose of this study was to evaluate the efficacy of shunt size calculation using this non-invasive dye dilution method with indocyanine green solution and compare it to the gold standard of invasive oximetric quantitation of shunting using Fick’s principle. Second, we evaluated how well the measured shunt size correlates to the native and invasive stop-flow balloon measured size of the ASD on TEE. Third, we compared the dye dilution method with indocyanine green solution to CMR shunt size measurement.
Methods
Study population
Two separate populations were used (1) to evaluate dye dilution method against invasive oximetry and (2) to evaluate dye dilution method against ASD size measured on TEE. We included all the patients with measurable ASD and a left to right shunt. If there was no left-to-right shunt present, the defect was diagnosed as PFO and not included in the study.
For the first population, a total of 49 consecutive ASD patients aged 18–80 years old were assessed using dye dilution method and invasive oximetry. The dye dilution curves were measured during the catheterisation by injecting the indocyanine green solution into the inferior vena cava (IVC, 32 patients) or the right atrium (RA, 17 patients). Direct injection to IVC or RA was used instead of the standard antecubital injection since the measurements were done during the catheterisation. The appearance of the dye was detected with an earpiece densitometer.
For the second population, consecutive candidates of percutaneous or surgical ASD closure (n=143) aged 17–88 years old were assessed by (1) calculating the shunt size with the non-invasive dye dilution method, (2) measuring both native ASD size with TEE and (3) invasively with a balloon stop-flow technique during 1999–2018. Dye dilution curves were performed a second time 12 months after the ASD closure. All patients had EKG, chest X-ray and transthoracic echocardiography performed before and after the closure. For nine patients in this population, the shunt size was also measured with CMR.
Dye dilution
While patient laying still in supine position, a non-invasive dichromatic earpiece densitometer (an instrument which measures the concentration of dye in the blood by light absorption using two wavelengths) was placed on the left ear pinna and an arterializing warm-up period of 10 min was allowed before the measurements. Benzyl nicotinate lotion (10 mg/g) was used as a vasodilator. An intravenous cannula (17–18 G), connected with a three-way stopcock and a 10 cm extension tube, was inserted into an antecubital vein. 0.3–0.5 mL of the 10 mg/mL Indocyanine green (Cardiogreen, Becton- Dickinson, MD, USA or ICG-pulsion, Pulsion Medical Systems AG, Germany) was first placed into the extension tube and then flushed rapidly with 15 mL of 0.9% NaCl solution.
ASD was defined as present if there was a characteristic hump in the downslope of the main part of the dye dilution curve because of early recirculation (figure 1). A gamma-variate curve-fitting algorithm was used to determine the area under the primary portion according to Maltz and Treves.22 The exponential fit was used to separate the systemic recirculation and determine the area under the shunt portion of the curve. The pulmonary-to-systemic flow ratio was calculated as (primary area+shunt area)/primary area.23

Left side: normal dye dilution curve. Right side: dye dilution curve with Qp:Qs 1.8 left-to-right shunt. There is a characteristic hump in the downslope of the main part indicating early recirculation. Qp:Qs, pulmonary blood flow/systemic blood flow.
To minimise the error in the dye dilution at least two measurements were obtained, and the best quality curve was used in the analysis. The dye-dilution curves were analysed without knowledge of the results of other measurements of the patient.
The investigations were well tolerated and did not cause any adverse reactions to the subjects.
One of the authors of this paper (MV) designed the densitometer and the software for the computer analysis of the dye dilution curves and the oximeter recordings.18 20 The equipment became available for clinical use in 1993.
Invasive oximetry
Invasive oximetry measurements were done during catheterisation. Blood samples were drawn from the pulmonary artery (PA) (two samples), RV (two samples), RA (three samples: upper, mid and lower part), superior vena cava (SVC) (three samples: upper, mid and lower part), IVC (two samples) and a systemic artery. SVC samples were drawn according to Grossman: 1 cm, 3 cm and 5 cm from the RA.24 A left-to-right shunt was determined present if there was a significant step up in the blood oxygen saturation in some of the samples. The location of the shunt was determined by the criteria of Dexter et al.4 The pulmonary and systemic blood flows (Qs) were calculated using the Fick’s principle.24
Qp:Qs = (SA O₂ – MV O₂)/(PV O₂– PA O₂)
Arterial oxygen saturation (SAO₂) was used instead of pulmonary venous (PV) saturation, since we did not have the PV samples drawn. Mixed venous saturation (MVO₂) in ASD was calculated using three samples from the SVC and two from the IVC: (3 x SVC+IVC)/4.25 The IVC in the equation is the mean saturation of the two IVC samples.
Cardiac MR
CMR studies were performed on a 1.5 T or 3T scanner (Siemens Magnetom Symphony 1.5 T or Avanto 1.5 T or Siemens Magnetom Skyra 3 T). Morphological evaluation of cardiac shunts was provided by T1 spin echo black blood sequence. For assessing cardiac function and localisation of the shunt cine images were acquired by fast imaging with steady-state precession. Short axis stack and long-axis cine images were used to determine a difference between left and right ventricular stroke volumes to calculate shunt volume.
In addition, velocity encoded (VENC) phase contrast MR was used for quantification of vascular flow. VENC images were acquired perpendicular to the ascending aorta and main PA. Through-plane flow was assessed just above the pulmonary and aortic valves. Appropriate VENC was chosen (started with 150 ms). Shunt fraction was calculated by measuring the ratio of pulmonary blood flow (Qp) to Qs.
Statistical analysis
SPSS software (V.25, IBM) was used for the analysis. The variables were compared using Spearman’s bivariate correlation test and Fisher’s exact two-tailed test. In all statistical tests, a two-way significance level of <0.05 was considered significant. Bland-Altman analysis was used to further asses the correlation between the dye dilution and invasive oximetry.26 All values are presented as ±SD if not otherwise mentioned.
Results
In the first population (table 1) the mean Qp/Qs measured with dye dilution was 2.12±0.68 and the Qp/Qs measured with catheterisation was 2.05±0.70. The shunt sizes were strongly correlated between these two methods, R=0.902 and p<0.001 (figure 2). In the Bland-Altman analysis (figure 3) the mean difference (Qp/Qs dye dilution – Qp/Qs invasive oximetry) was 0.07, and the SD was 0.24.
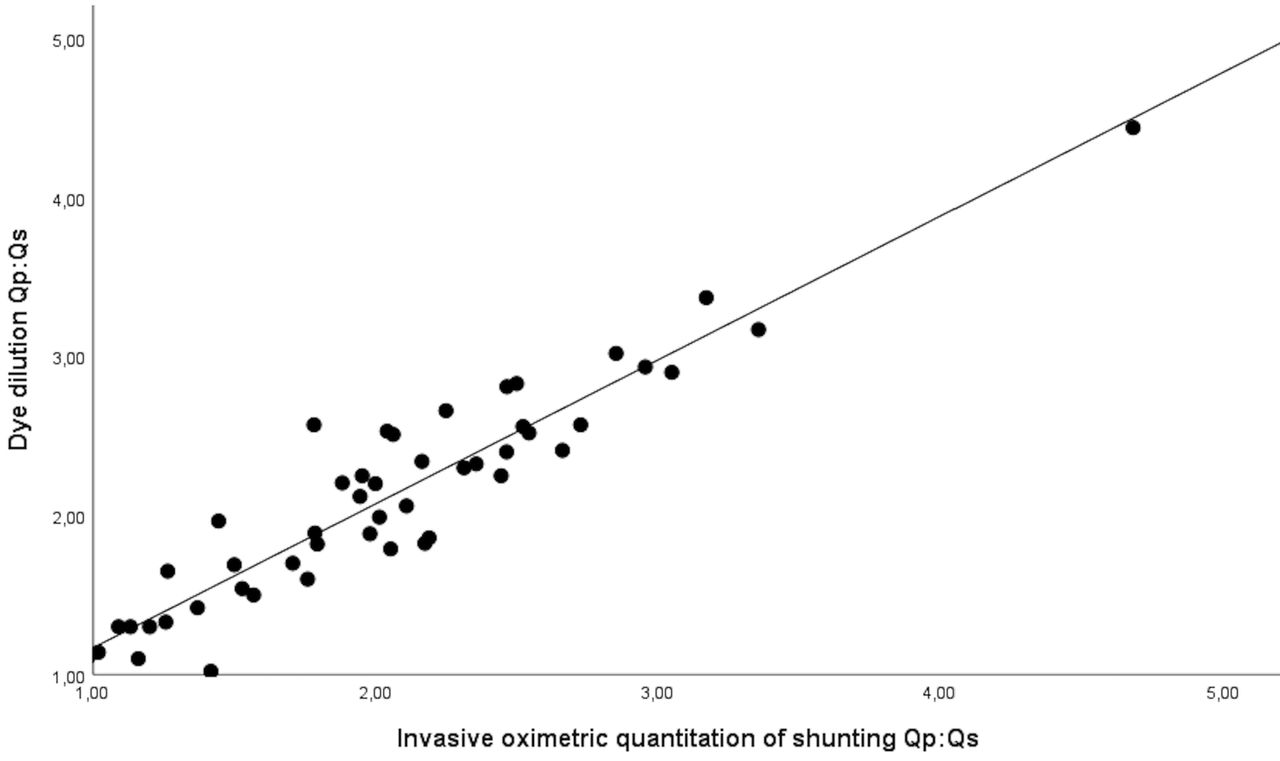
Correlation of dye dilution measured shunt size (y-axis) to invasive oximetric quantitation of shunting using Fick’s principle (x-axis). Qp:Qs, pulmonary blood flow/systemic blood flow.
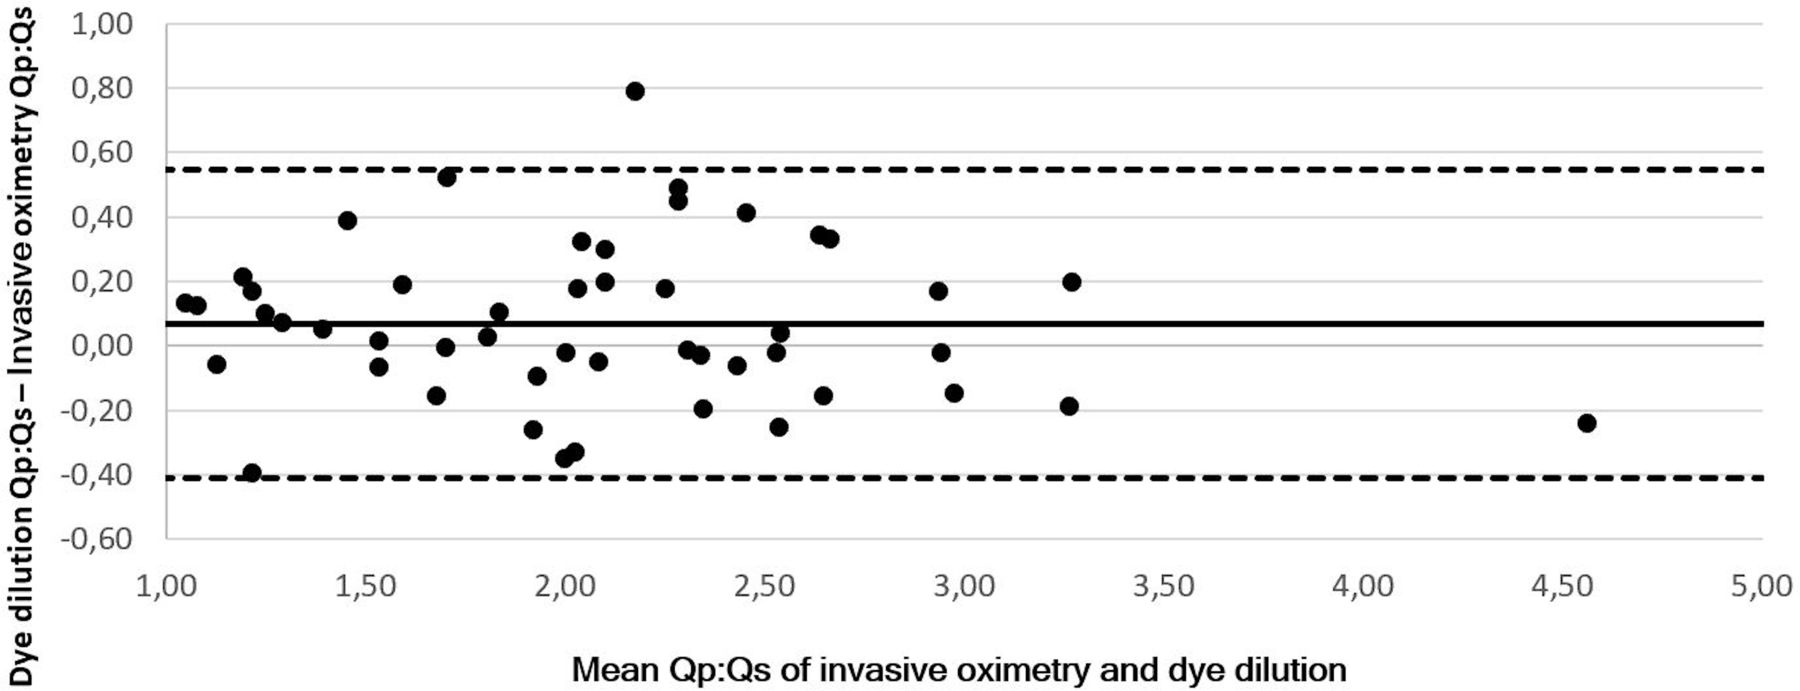
Bland Altman analysis comparing dye dilution measured shunt size and invasive oximetry measured shunt size. Dotted lines represent the upper and lower limits of agreement (−1.96 SD and +1.96 SD). Upper limit of agreement 0.55, lower limit of agreement −0.41. Qp, pulmonary blood flow; Qs, systemic blood flow.
Baseline variables of the two study populations
In the second population, vast majority of patients had normal left ventricular ejection fraction (62%±10%) and normal diastolic function (table 1). Seventy-six per cent of these patients had tricuspid valve regurgitation, most of these were trivial or mild. Twenty had moderate regurgitation, and none were severe. Mean tricuspid valve regurgitation gradient was 30 mm Hg (range 14–66 mm Hg). Pulmonary valve regurgitation was observed in 20 patients, two of those were moderate.
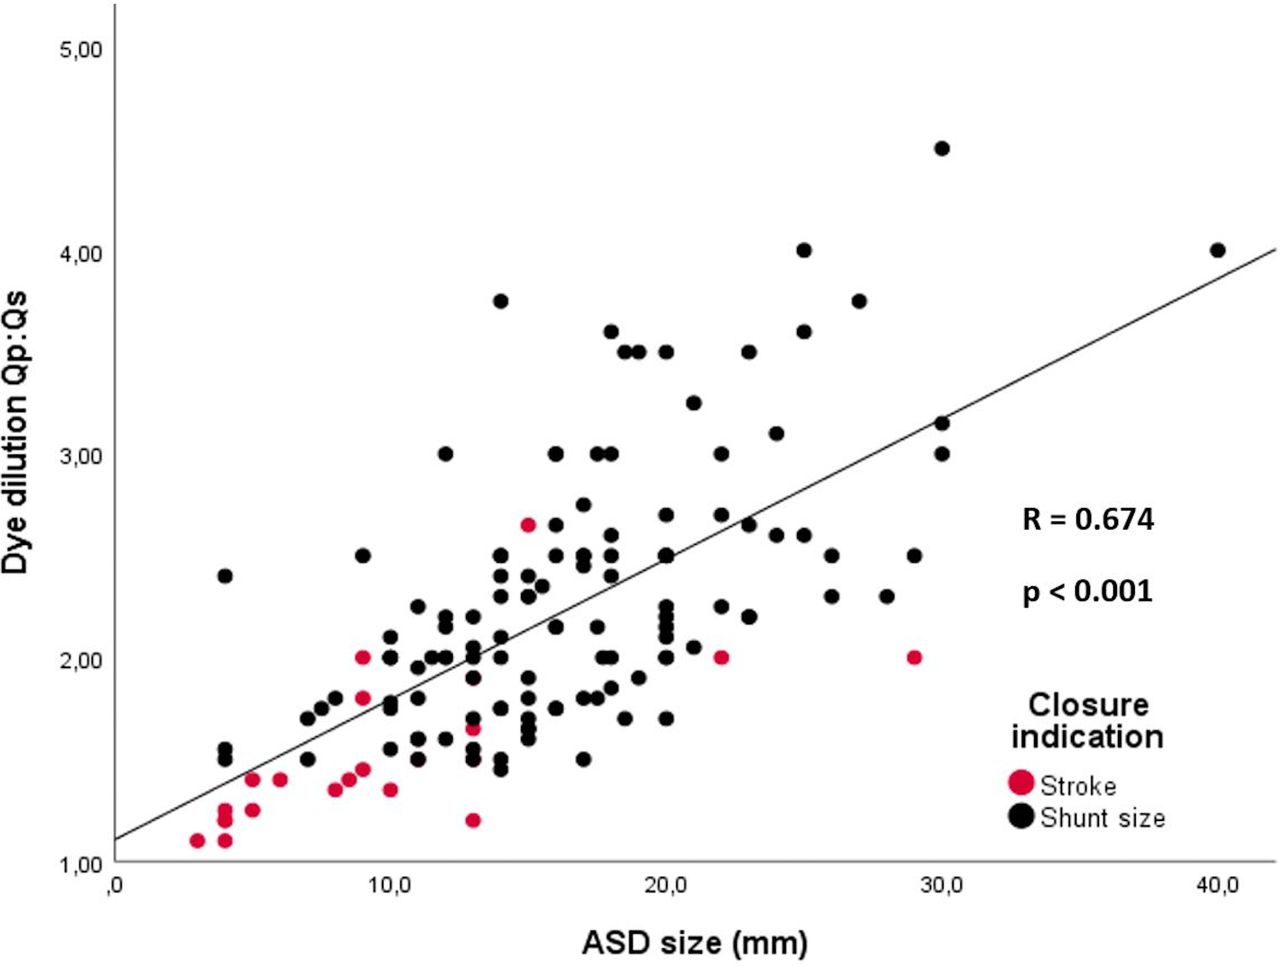
The mean size of the shunt measured with dye dilution was 2.16±0.65. The correlation between the shunt size and the ASD size was good (R=0.674, p<0.001) (figure 4). ASD diameter measured with a balloon at stop-flow was slightly bigger as expected (table 1). Correlation of stop-flow balloon measurements to shunt size measured with dye dilution was also good (R=0.667, p<0.001).

Correlation of dilution dye measured shunt size (Qp/Qs) to ASD sized measured on transoesophageal echocardiography. ASD, atrial septal defects; Qp:Qs, pulmonary blood flow/ systemic blood flow.
The shunt size also correlated with the echocardiographic measurement of the combined area of the RV and the RA size (R=0.311, p<0.001), but not with tricuspid valve regurgitant gradient (R=0.179, p=0.78), nor age (R=−0.086, p=0.305).
The dye dilution was repeated 12 months after the ASD closure for 91 patients. In these measurements, the mean Qp:Qs was 1.09±0.18, ranging from 1.0 to 1.85. The lower detection limit for dye dilution is 1.15. In four patients Qp/Qs was markedly above this value (Qp:Qs >1.3), indicating that there was some shunt left after defect closure. In three of these cases, residual shunt was also seen in colour Doppler.
CMR was also performed for 47 patients because of the suspicion of a partially anomalous PV return or some other shunt defect. In nine of these patients, the shunt size was also measured with CMR. Qp/Qs measured with CMR was 1.87±0.40 resulting in a good correlation with the dye dilution method (R=0.696, p=0.037).
In 16 patients, the shunt size was measured with the radionuclide method in different hospitals around Finland. In this study, the radionuclide method had no correlation with ASD’s size (R=−0.30, p=0.919).
Discussion
To our knowledge, this is the largest study comparing shunt size to ASD dimension measured with TEE, and the first study to compare the shunt size to ASD dimension in adult population. The shunt size measured with dye dilution method showed good correlation with the actual ASD size measured by TEE or TEE with balloon sizing. The shunt size measured both by gold standard invasive oximetry and by non-invasive dye dilution showed an excellent agreement. Also, the agreement seems to be excellent across all sizes of shunt Qp:Qs values. Furthermore, dye dilution method showed good correlation with CMR shunt size measurement.
Right ventricular (with or without atrial) enlargement is considered the most important indicator for ASD closure.2 This enlargement is thought to reflect a large enough shunt to strain the right side of the heart when no other obvious reason for the enlargement is present. Shunt size assessment is needed in borderline cases or in cases with elevated right-sided pressure. Shunt Qp:Qs ratio of 1.5 or larger is accepted to be significant enough to cause expansion of the right side, however, there is no strong evidence supporting this statement.27 There are no large data available to show which size of shunt can cause ventricular enlargement and which size of ASD’s should be closed. Studies only show that patients benefit from closure of ASD’s large enough to cause right ventricular enlargement.28–31
Closing smaller ASD’s has never been studied in an endpoint driven manner. A large retrospective Danish cohort showed that patients with ASD’s not fulfilling closure criteria have increased cardiac mortality and they would benefit from medical re-examination since the haemodynamic properties of an ASD can change with ageing.32 At this time, we do not know that which is the best method to determine patients in need for ASD closure and if we should close defects with small dimensions and shunt sizes smaller than 1.5.
The shunt size is determined by the ASD dimensions, pressure gradient between left and right atria, ventricular compliance and cardiac output. Our study demonstrates that the shunt size correlates well with the dimensions of the ASD shown before only in a paediatric population.27 The current study shows that ASD size explains more than 2/3′s of the shunt size. Having said this, our evaluations in above cardiac measurements are limited. We do not have neither actual pressure gradient between left and RA nor cardiac output values. However, tricuspid regurgitation peak gradient measured with TTE gives a good estimation of pulmonary pressure, and it was in most cases normal or only mildly elevated.
Non-invasive dye dilution method has many advantages compared with other shunt size measurement techniques. It provides accurate results agreeing with invasive oximetry. In our comparison to invasive oximetry the dye was injected into the IVC or the RA. We can assume that the dye acts similar way as the dye injected to the antecubital vein.21
Dye dilution can detect shunt fractions as small as 1.15.17 In detecting patent foramen ovale the sensitivity was reported to be 76% and specificity 100%.20 Interobserver agreement of dye dilution detection in small shunts has previously shown to be excellent. The method is also time-efficient and cost-efficient. One measurement takes only about 15 min, and the price per study is relatively low, being about one third of the price of the CMR in our hospitals price list.
The dye dilution method has also limitations. Fragmented dye boluses can cause erroneous results. Significant valve regurgitations may influence to the Qp:Qs value. In our material there were no significant valve regurgitations. In atrial fibrillation the variance of heart rate and stroke volume impacts the shape of the dye dilution curve. Thus, more measurements are needed to interpolate the mean value. Dye dilution gives a good estimate of shunt size but does not yield information regarding the location of the shunt in the cardiovascular system.
Invasive oximetry has been the standard method for assessing the Qp:Qs ratio in intracardiac shunts. The invasive nature of the study is considered its biggest downside. Other limitations are lack of sensitivity, requirement of a cardiovascular steady state during sample collection, and calculation of MVO2: normal variability of blood oxygen saturation in the right heart chambers is strongly influenced by the magnitude of Qs.5 24 The cardiac output spontaneously varies at rest, which introduces inaccuracies, especially if there are delays between blood samplings at various sites.25
CMR is suggested as a good alternative for shunt size evaluation. It is available in the most hospitals; however, capacity and costs are the usual limiting factors to use it. Studies demonstrate good correlation in shunt size assessment between CMR and invasive oximetry, however, based on rather small populations (n=10–50).3 6 33–36 Also, there are some limitations in using MRI for shunt size evaluation: interpretation of the shunt is difficult with irregular rhythms, pulmonary and aortic pathology disturb the calculations, Qp/Qs ratio is overestimated if the assessment of the systemic flow is done distal to the coronary ostia in the ascending aorta,35 and breathing can influence the values obtained by CMR.17 Regardless of the above limitations, CMR is widely used in shunt size evaluation.
In this study, no correlation between radionuclide angiography and ASD size was found. The radionuclide evaluations were performed in small medical centres, with a limited amount of evaluations annually. This may cause difficulties in executing and interpreting the radionuclide measurement and may have influenced on our results.
This study has potential limitations. It was done in a retrospective manner and the study was not designed to compare dye dilution to CMR or radionuclide method, therefore, it is hard to make conclusions of superiority of one method over the others. Second, we employed two populations to show correlation both to the invasive oximetry and to the ASD size measured with TEE. We acknowledge that haemodynamic parameters would be important in the study, however, these parameters are not available in either of the populations. In 12 months control visit four patients had a significant residual shunt, however, they did not undergo additional tests to quantify residual shunt seen in dye dilution.
Conclusion
The non-invasive dye dilution method with densitometer recording is a clinically feasible, inexpensive and time-effective method to assess shunt size in ASDs. It has a good agreement to the gold-standard method and to ASD size.
References
Footnotes
Twitter @VMuroke
Contributors VM: corresponding author, planning, data collection, analysis, writing and editing. MJ: data analysis, writing and figure editing. PS: data collection, writing and editing. MH: MRI data collection, writing and editing. MV: invasive oximetry data collection, methods section writing and editing. JS: main editor and supervisor of the work. All the authors have seen and approved the final manuscript and are fully conversant with its contents.
Funding This study was supported by The Finnish Medical Foundation.
Competing interests None declared.
Patient consent for publication Not required.
Ethics approval The study complies with the Declaration of Helsinki. The study protocol was reviewed and approved by the institutional review board of Heart and Lung Center, Helsinki University Hospital (HUS/26/2018).
Provenance and peer review Not commissioned; externally peer reviewed.
Data availability statement All the data are stored in a Helsinki University Central Hospital protected disc drive and are available on reasonable request.