Article Text

Abstract
Background There has been rapid growth in the demand for transcatheter aortic valve replacement (TAVR), which has the potential to overwhelm current capacity. This imbalance between demand and capacity may lead to prolonged wait times, and subsequent adverse outcomes while patients are on the waitlist. We sought to understand the relationship between regional differences in capacity, TAVR wait times and morbidity/mortality on the waitlist.
Methods and results We modelled the effect of TAVR capacity, defined as the number of TAVR procedures per million residents/region, on the hazard of having a TAVR in Ontario from April 2012 to March 2017. Our primary outcome was the time from referral to a TAVR procedure or other off-list reasons on the waitlist/end of the observation period as measured in days. Clinical outcomes of interest were all-cause mortality, all-cause hospitalisations or heart failure-related hospitalisations while on the waitlist for TAVR. There was an almost fourfold difference in TAVR capacity across the 14 regions in Ontario, ranging from 31.5 to 119.5 TAVR procedures per million residents. The relationship between TAVR capacity and wait times was complex and non-linear. In general, increased capacity was associated with shorter wait times (p<0.001), reduced mortality (HR 0.94; p=0.08) and all-cause hospitalisations (p=0.009).
Conclusions The results of the present study have important policy implications, suggesting that there is a need to improve TAVR capacity, as well as develop wait-time strategies to triage patients, in order to decrease wait times and mitigate the hazard of adverse patient outcomes while on the waitlist.
- aortic valve disease
- public health
- minimally invasive
This is an open access article distributed in accordance with the Creative Commons Attribution Non Commercial (CC BY-NC 4.0) license, which permits others to distribute, remix, adapt, build upon this work non-commercially, and license their derivative works on different terms, provided the original work is properly cited, appropriate credit is given, any changes made indicated, and the use is non-commercial. See: http://creativecommons.org/licenses/by-nc/4.0/.
Statistics from Altmetric.com
Key questions
What is known about this subject?
Increasing wait times for transcatheter aortic valve replacement (TAVR) are associated with increased mortality and morbidity.
What does this study add?
We found that regions with increased capacity have lower wait times, and also reduced wait-time morbidity and mortality.
How might this impact on clinical practice?
Our results suggest the need to increase TAVR capacity. However, this will not be sufficient given the increase in referrals of different severities of patients with aortic stenosis. An evidence-informed triage strategy to assign patients based on risk of wait-time deterioration is also needed.
Introduction
Transcatheter aortic valve replacement (TAVR) is the preferred treatment for inoperable, high-risk and intermediate-risk patients with severe aortic stenosis, with emerging evidence that it is a reasonable alternative to surgical aortic valve replacement (SAVR) in low-risk patients.1–4 There has been rapid growth in demand for TAVR, which has the potential to overwhelm current capacity. This imbalance between demand and capacity may lead to prolonged wait times, and subsequent adverse outcomes while patients are on the waitlist.
There is a paucity of literature on the relationship between TAVR capacity and wait times.5–8 Although variation in TAVR capacity has been investigated in Europe,9–11 much of this was in the early era of TAVR adoption and not reflective of contemporary practice. Moreover, these studies did not examine how TAVR capacity impacts wait times or health outcomes. Work from our group has shown that median TAVR wait times are approximately 80 days from referral to procedure.5 This period is associated with important morbidity and mortality, with approximately 4.3% of patients dying while waiting for TAVR, and a further 14.7% hospitalised for heart failure (HF).8 It remains unclear what the drivers are of either wait times or clinical deterioration while on the waitlist. A potentially important system driver of both is TAVR capacity.
In order to address this gap in knowledge, we sought to elucidate both the relationship between TAVR wait times and regional TAVR capacity, as well as the association between regional TAVR capacity and adverse waitlist outcomes, including morbidity and mortality. We believe that this information will be invaluable to policy-makers to facilitate evidence-informed decision-making regarding TAVR funding allocation and capacity planning.
Methods
The use of data in this retrospective cohort study was authorised under section 45 of Ontario’s Personal Health Information Protection Act, which does not require review by a Research Ethics Board. The use of anonymised administrative data without patient consent at ICES is allowed in Ontario based on provincial privacy legislation. We adhered to the Strengthening the Reporting of Observational Studies in Epidemiology statement for reporting of observational studies.
Context
Ontario is the largest province in Canada with a population of 14.2 million. All residents have universal access to healthcare and hospital services through a publicly funded healthcare programme administered by a single third-party payer, the Ontario Ministry of Health and Long Term Care. The province is divided into 14 local health integration networks (LHINs), which are crown agencies established by the Government of Ontario to plan, coordinate, integrate and fund health services at a local level. The LHINS are mandated to independently provide health services to patients in a particular geographical area. In this study, we leveraged Ontario’s regional system of healthcare delivery as a natural experiment given that each LHIN had a different capacity for TAVR during the study period. TAVR has been available in Ontario since 2012, at which point provincial funding was approved.
Data sources
Our study used data collected in the CorHealth Ontario TAVR Registry. The TAVR CorHealth Registry contains demographic, comorbidity and procedural variables from the 11 tertiary centres across the province that provide TAVR. These data elements have been validated through selected chart abstractions and core laboratory analyses.12
Data from the CorHealth registry were linked using unique encoded identifiers to the following administrative datasets held at ICES. We used the Canadian Institute for Health Information Discharge Abstract Database for data on acute hospitalisations, as well as to supplement baseline comorbidity and procedural data. Validated ICES-derived databases were used to identify diabetes,13 14 HF,15 hypertension (HTN),16 17 chronic obstructive pulmonary disease (COPD)18 and dementia.19 Medical frailty was determined using the hospital frailty risk score developed by Gilbert et al.20 Mortality was ascertained via the Registered Persons Database as were additional demographic variables such as quintile of median neighbourhood income and rural residence.
Patient selection
We included all patients≥18 years old that were referred for TAVR in Ontario from 1 April 2012 to 31 March 2018. We excluded patients with data quality issues (ie, patients with a death date prior to the procedure date) or with an invalid procedure date. The unit of analysis was episode of care, defined as the period from referral to an off-list (reasons for off-listing included: TAVR procedure, death, rereferral to surgery, follow-up/observation, patient or physician decision, or medical treatment only) or the end of the observation period. As such, a single patient could have multiple episodes of care, if they either had multiple TAVR procedures, or were referred and off-listed multiple times as separate records.
Outcome variables
Our primary outcome was the time from initial referral to off-list in the registry/end of the observation period as measured in days. Clinical outcomes of interest were all-cause mortality, all-cause hospitalisations or HF-related hospitalisations while on the waitlist for TAVR.
TAVR capacity
Similar to previous publications, we defined TAVR capacity as the number of TAVR procedures per million population, per fiscal year, based on LHIN of patient residence.
Statistical analysis
Differences in baseline characteristics between patients based on LHIN of residence were compared using analysis of variance for continuous variables and χ2 tests for categorical variables. Descriptive statistics were provided for total wait time and TAVR capacity over the entire period of time by LHIN. For the purpose of understanding the relationship between TAVR capacity and wait times, we modelled the effect of TAVR capacity on the hazard of having a TAVR using a cause-specific Cox multivariable proportional hazard model. The advantage of modelling the wait times using a hazard function is that twofold: (1) it accounts for subjects still on the waitlist at the end of the study period (censoring) and (2) it accounts for the competing risk of off-listing due to competing events (eg, mortality) while on the waitlist. The HR from these models is interpreted as follows: an HR <1 indicates a decreased hazard of undergoing TAVR (ie, a longer wait time), while an HR >1 indicates an increased hazard of undergoing TAVR (ie, a shorter wait time). In our figures, we graph the log hazard of undergoing TAVR, with an increasing log hazard indicating a shorter wait time.
Similarly, a cause-specific Cox model was developed to model effect of TAVR capacity on the hazard of mortality while on the waitlist for TAVR, treating TAVR procedure or off-listing (for reasons other than death) as a competing risk. We modelled the effect of TAVR capacity on the hazards of all-cause and HF hospitalisations were modelled using cause-specific Cox models, with TAVR procedure or off-listing or wait-time mortality treated as competing risks.
In all models, we modelled TAVR capacity using restricted cubic splines, to evaluate if there was a non-linear relationship with outcomes. All multivariable models were adjusted for all baseline and procedural variables, which were chosen based on clinical relevance. All data analyses were performed using SAS V.9.4 (SAS Institute). Statistical significance was considered to be two-sided p values of <0.05.
Results
Cohort
There were a total of 8098 TAVR referrals between 1 April 2012 and 31 March 2018, after applying exclusions for data quality (n=28; figure 1). There were 3894 (48%) referrals that led to a TAVR procedure, with 21 patients having more than one procedure. There were 3507 (43%) referrals that were off-listed without a TAVR procedure. Reasons for off-list included: medical treatment (n=197), medical decision (n=1631), patient decision (n=577), death on waitlist (n=413), patient rereferred for SAVR (n=588), ongoing clinical follow-up/observation (n=80) and referred without known outcome (n=21). The remaining 697 (9%) of referrals were still on the waitlist at the end of our study period and were therefore censored.
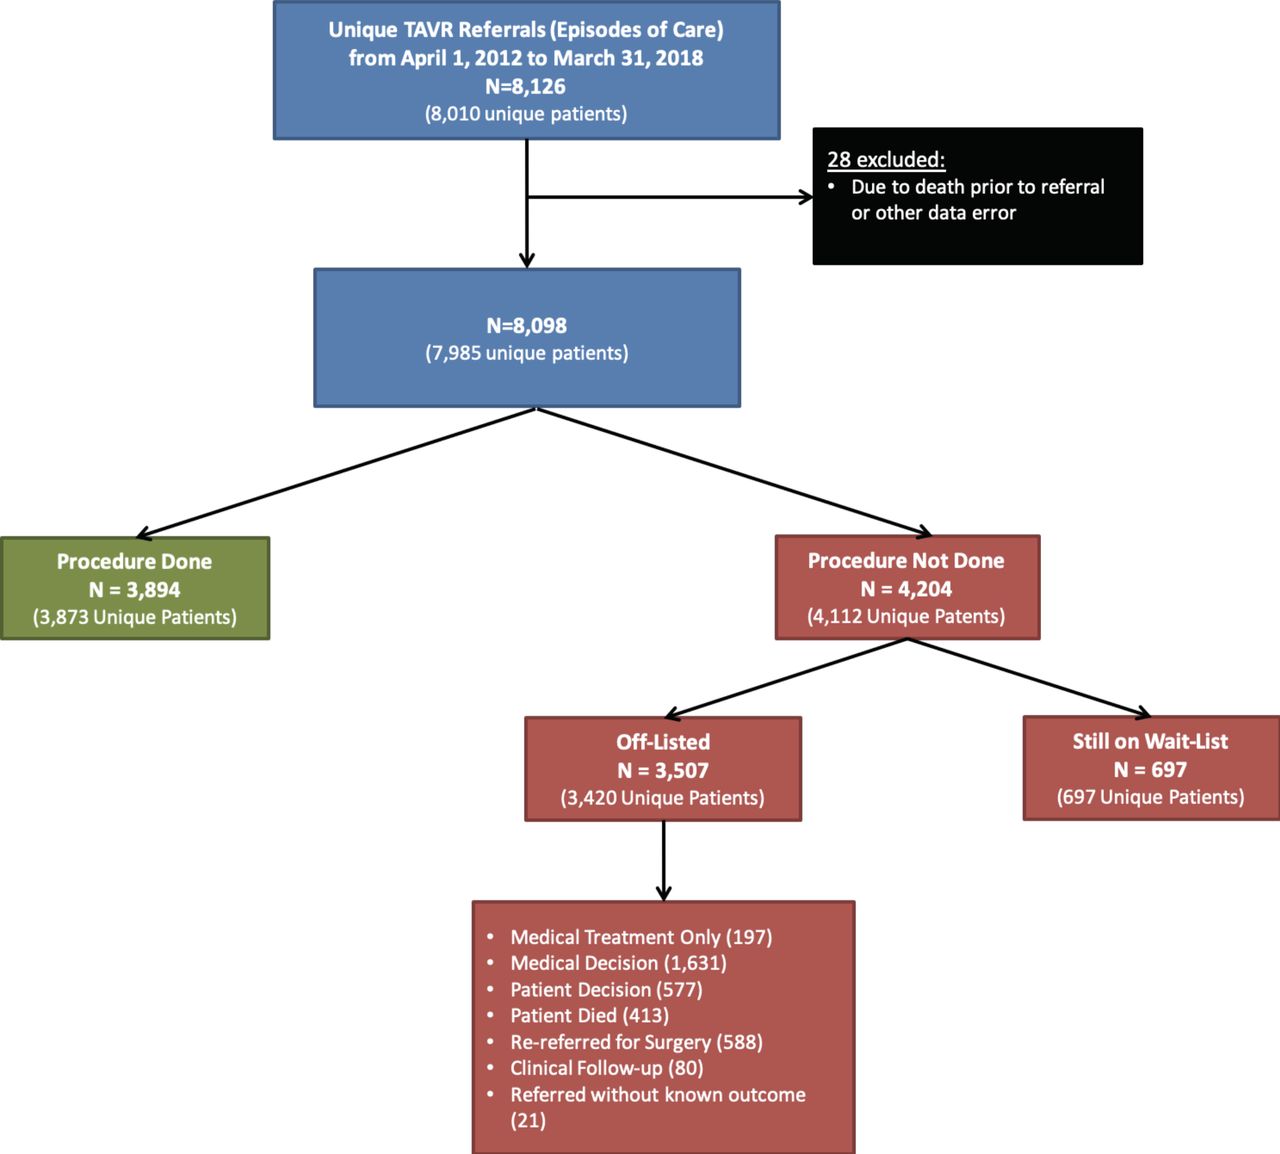
Patient flow diagram and cohort creation. TAVR, transcatheter aortic valve replacement.
Baseline characteristics
The mean age of our cohort was 81.4 years and 46% were women (table 1). Common medical comorbidities were HTN (92%), dyslipidaemia (57%), congestive HF (56%) and diabetes (43%). The baseline characteristics by LHIN are found in online supplementary table 1. The total number of referrals in each LHIN over the study period ranged from 156 in North West to 1214 in Central. Year over year, total referrals for the province increased from 437 in fiscal year 2012 to 1981 in fiscal year 2017, with a steady quarter on quarter increase (online supplementary figure 1).
Supplemental material
Cohort baseline characteristics
TAVR capacity and wait times
TAVR capacity, as defined as number of TAVR procedures per million population, is shown in figure 2. TAVR capacity increased in all LHINs over the study period (figure 3A). However, as is apparent in figure 3A, there was marked regional variation. There was an almost fourfold difference in TAVR capacity in fiscal year 2017, ranging from 31.5 TAVR per million residents in Waterloo-Wellington to 119.5 TAVR per million residents in South East. The median TAVR capacity during the study period was 56 TAVR per million residents.
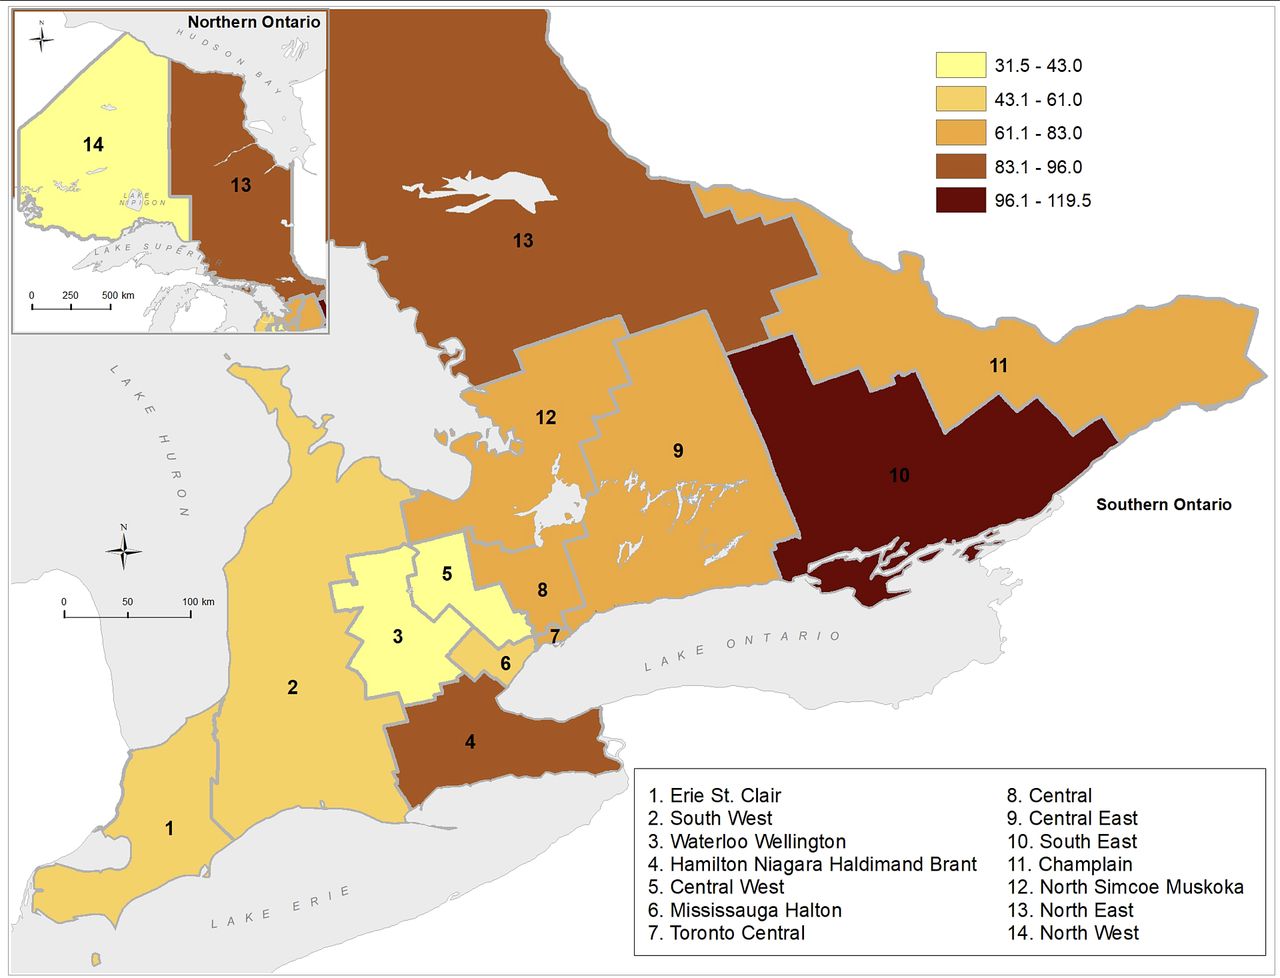
Transcatheter aortic valve replacement capacity by local health integration networks.

(A) Transcatheter aortic valve replacement (TAVR) capacity, by local health integration networks (LHIN), by fiscal year, 2012–2017. (B) Median wait time to TAVR, by LHIN, by fiscal year, 2012–2017. HNHB, Hamilton Niagara Haldimand Brant.
Similarly, although the median total wait time based on the quarter of TAVR procedure fluctuated throughout the study period, there was a steady increase from 99 days in 2012 Q2 to 137.5 days in 2018 Q1 (online supplementary figure 1). Within each LHIN, there was no consistent trend in wait time, with waiting times from referral to TAVR increasing in half of the LHINs and decreasing in the remaining LHINs during our study period (figure 3B). Nonetheless, similar to TAVR capacity, there was marked geographical variation between LHINS, with the median wait time ranging from 55 days in North West to 126 days in Central in fiscal year 2017.
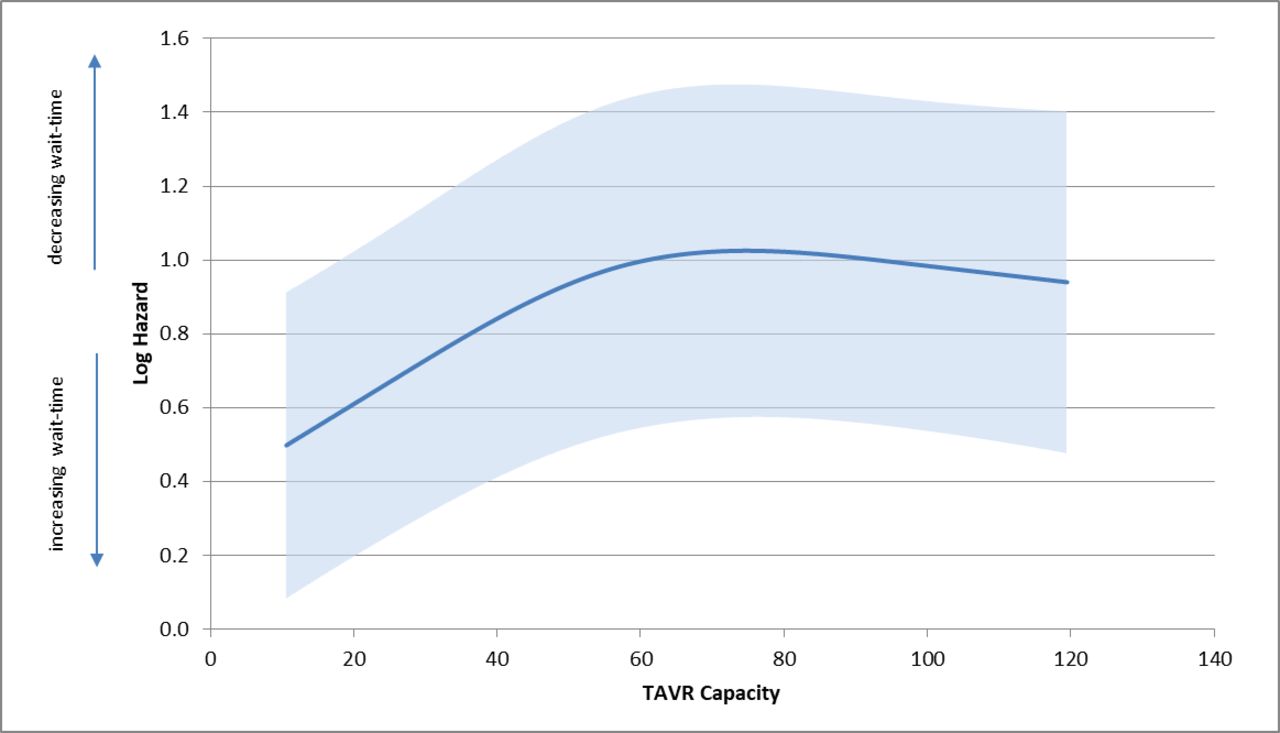
The association between TAVR capacity and wait times was statistically significant (p<0.001), with a complex, non-linear (p=0.004) relationship (figure 4). As TAVR capacity increased, the log hazard for TAVR increased (ie, wait times decreased) until a capacity of approximately 56 per 1 000 000 residents. Beyond this capacity, wait times were relatively stable (ie, log hazard was unchanged).
Transcatheter aortic valve replacement (TAVR) capacity and log hazard of time to TAVR.
The estimates from the full Cox model are shown in table 2. Interestingly, the strongest predictor was a temporal effect, with referral earlier in the study period associated with shorter wait times. Clinical factors driving shorter wait times included congestive HF, ischaemic heart disease and previous cardiac procedures. Higher frailty score, COPD and being in the lowest income quintiles were associated with longer wait times.
Full Cox model, transcatheter aortic valve replacement (TAVR) capacity and time to TAVR procedure
Clinical outcomes
There were 413 deaths while on the waitlist, comprising 5.1% of the study population. Mortality of patients on the waitlist increased from 2.3% to 5.2% over the study period (table 3), which was statistically significant (online supplementary table 2). We did not find a significant non-linear relationship between capacity and wait-time mortality. With each 10-unit increase in TAVR capacity, there was a non-significant decrease in mortality (HR 0.94, 95% CI 0.88 to 1.01; online supplementary table 2 and figure 2). Older age (HR 1.03 per 1 year increase, 95% CI 1.01 to 1.05), congestive HF (HR 2.13, 95% CI 1.69 to 2.69) and dialysis (HR 2.30, 95% CI 1.48 to 3.57) were all associated with an increased hazard of waitlist death.
Mortality on waitlist by fiscal year, 2012–2017
In the cohort, we found that 31.7% of referrals had an all-cause hospitalisation while waiting, while 7.1% had an HF-related hospital admission. We found a significant non-linear relationship between TAVR capacity and the hazard of hospitalisation while on the waitlist (p=0.009). The relationship had an inverted U shaped. As TAVR capacity increased, there was actually a higher hazard of hospitalisation until a capacity of ~60 TAVR/million, after which the hazard of hospitalisation decreased (online supplementary figure 3A). Referral in early years (2012 vs 2017 hours 1.45; 95% CI 1.14 to 1.85), diabetes (HR 1.11; 95% CI 1.01 to 1.22) and congestive HF (HR 1.42; 95% CI 1.30 to 1.55) were predictors of increased hazard of hospitalisation (online supplementary table 3). Female sex was associated with lower hazard of hospitalisation when compared with males (HR 0.92; 95% CI 0.84 to 0.99). There was no significant association between TAVR capacity and HF-related hospitalisations (p=0.39) (online supplementary figure 3B and table 4).
Discussion
In this population evaluation of TAVR in Ontario, Canada, we found marked regional variation in both TAVR capacity and TAVR wait times, indicating geographical inequity of access. The relationship between TAVR capacity and wait times, as well as clinical consequences while on the waitlist, was complex. In general, with increasing capacity, there was a decrease in wait times and a general trend for fewer adverse events, including death and hospitalisations. However, the relationship was non-linear with respect to wait times and hospitalisations, and there was an important temporal effect with all outcomes. Understanding these complex relationships will be important for decision-makers in order to allocate procedural funding in a fair manner to improve overall capacity and therefore access to this potentially life-saving therapy.
Previous research on TAVR capacity has also found considerable regional variation. Earlier work from 11 European countries found that TAVR per million population ranged from a low of 6.1 to high of 88.7 in 2011.9 A more contemporary study in Poland found that the TAVR capacity was 17.4 per million population in 2015.11 Our study adds to the literature by showing that although TAVR capacity has consistently increased in recent years, there is a complex relationship between capacity and wait times to procedure. We determined that this relationship was non-linear in nature, resulting in an inflection point once TAVR capacity reached a certain threshold. We hypothesise that past this inflection point, the regions with higher capacity had proportionally greater referrals, potentially due to being early adopters. The temporal effect observed in our study is suggestive of this; increased capacity earlier on would attract more referrals, compounding the issue of long wait times to TAVR. Further study is needed to confirm whether this is driving the relationship observed in the present study. Though non-significant, our finding that increased TAVR capacity is associated with a decreased hazard of death is encouraging. It is possible that our study lacked the power to detect a statistical difference, and further research into this relationship would be meaningful to support this promising result. Regarding the non-linear relationship between capacity and hospitalisations, we hypothesise that at lower capacities, there is not sufficient capacity to improve outcomes. However, when capacity is at or above the inflection point, increased capacity is associated with a reduction in hospitalisations for patients on the waiting list.
Our work has important implications for policy. Specifically, the results from the current study demonstrate that there remain inequities in access to TAVR based on the regional variation in wait times. Despite funding challenges, a greater emphasis should be placed on improving capacity to reduce wait times, while also minimising capacity variation between LHINs to provide more equitable access. Ideally, funds would be allocated by standardising to the per million per fiscal year metric across all LHINs. It is important to note that our definition of TAVR capacity does not fully address the complexity of health service capacity. Similar to our previous work, we have defined capacity based on the number of procedures per million population. This definition is a useful marker of the TAVR capacity at the population level; however, the number of procedures per population does not capture multiple other factors that contribute to capacity. These include funding allocation, as well as adequate availability of facilities (ie, infrastructure), diagnostic testing capacity and trained healthcare professionals. Each of these is also central considerations for policy-makers. Equity in access to TAVR will become a more prominent issue now that clinical practice guidelines suggest the inclusion of intermediate and lower risk patients.21 It is interesting to note that the two LHINs with the highest average capacity over the study period, South East and North East, also have among the highest proportions of referred patients from rural settings, 30.2% and 33.3% respectively. Conversely, the LHIN with the lowest capacity, Waterloo-Wellington has a rural proportion of 8.7%, less than the provincial average of 11.5%, suggesting that proximity to major urban centres is not necessarily a prerequisite for increased capacity.
The increasing median wait time to TAVR during our study period, despite a general upward trend in capacity across the province, merits further attention to the drivers of wait times. While funding to increase capacity would theoretically facilitate a greater number of procedures, it does not necessarily expedite TAVR workup diagnostic testing such as coronary angiogram, echocardiogram and CT. Delays in patients undergoing workup could translate into a later decision date by the TAVR team, and a longer overall wait time. This hypothesis is supported by our recent study demonstrating that patients have to wait 54 days for a coronary angiogram, 63 days for an echocardiogram and 63 days for a CT scan, while it only takes TAVR teams 28 days to accept a patient following the last diagnostic test.8 Limitations in diagnostic infrastructure could also explain the inflection point in the time to TAVR because the substantial increase in referrals cannot be efficiently managed, despite increased capacity. Therefore, investigation into building capacity in diagnostic infrastructure may prove fruitful in explaining these trends in our data.
Furthermore, we identified a number of clinical features associated with increased mortality and hospitalisations while on the waitlist. This reinforces that increasing capacity alone through increased funding is not sufficient to manage access. Instead, a comprehensive wait-time strategy whereby triaging TAVR candidates based on the risk of deterioration is necessary. Currently, in Ontario, there is no accepted triage tool or urgency rating scale by which to appropriately triage TAVR patients and have an informed queuing to minimise deterioration on the waitlist. Indeed, it is an ongoing focus of research in our group to develop urgency rating/risk scores to aid in such triaging.
Our findings must be interpreted in the context of several limitations that merit discussion. First, there are not reliable estimates of the total prevalence of aortic stenosis in Ontario. As a result, when calculating capacity, we are unable to use a denominator that would represent those elderly patients with severe aortic stenosis who are eligible to receive TAVR, which would likely provide a better indicator of capacity to treat. Second, there have been significant developments in TAVR technology and care delivery over the study period, especially considering that provincial funding has only been available since 2012. Finally, given the observational nature of the study, there are a number of confounders that could not be accounted for in our analyses. Therefore, our conclusions should be considered hypothesis generating, and not conclusive.
In conclusion, this population-based study revealed marked geographical variation in TAVR capacity and TAVR wait times. Our results suggested that regions with higher TAVR capacity experience shorter wait times, and improved waitlist outcomes, including mortality and hospitalisations. The findings from this study indicate that there is an opportunity for improvement in TAVR capacity in Ontario to ensure that there is equal access to TAVR across the province.
Acknowledgments
The authors acknowledge that the clinical registry data used in this publication are from participating hospitals through CorHealth Ontario which serves as an advisory body to the Ontario Ministry of Health and Long-Term Care (MOHLTC), is funded by the MOHLTC, and is dedicated to improving the quality, efficiency, access and equity in the delivery of the continuum of adult cardiac, vascular and stroke services in Ontario, Canada. They thank IMS Brogan for use of their Drug Information Database.
References
Footnotes
Contributors HCW is responsible for overall content as guarantor. KH, MR and HCW were involved in study conception. FQ performed all analyses. All authors were involved in interpretation of results. KH and MR drafted the manuscript. HCW, FQ, NM, TS and PA revised manuscript critically. The corresponding author affirms that he has listed everyone who contributed significantly to the work. The authors had access to all the study data, take responsibility for the accuracy of the analysis and had authority over manuscript preparation and the decision to submit the manuscript for publication. The corresponding author confirms that all authors read and approve the manuscript.
Funding This study was funded by a grant in aid from the Heart and Stroke Foundation of Canada. This study was supported by ICES, which is funded by an annual grant from the Ontario Ministry of Health and Long-Term Care. HCW is supported by a Phase 2 Clinician Scientist Award from the Heart and Stroke Foundation of Canada, Ontario office. PA is supported by a Mid-Career Investigator award from the Heart and Stroke Foundation.
Map disclaimer The depiction of boundaries on this map does not imply the expression of any opinion whatsoever on the part of BMJ (or any member of its group) concerning the legal status of any country, territory, jurisdiction or area or of its authorities. This map is provided without any warranty of any kind, either express or implied.
Competing interests NF is a consultant for Edwards Life Sciences.
Patient consent for publication Not required.
Provenance and peer review Not commissioned; externally peer reviewed.
Data availability statement No data are available. As per privacy laws in Ontario Canada, the data analysed for this manuscript are not publicly available.