Article Text

Abstract
Background As a measure of the global left ventricular afterload, valvuloarterial impedance (ZVA) can be estimated using transthoracic echocardiography (TTE) and invasive measuring methods. The objective of this study was to compare the performance of TTE in measuring ZVA with invasive haemodynamics, direct Fick and thermodilution (TD), in patients with severe aortic stenosis (AS).
Methods This is a retrospective cohort study of 66 patients with severe AS who underwent TTE and bilateral heart catheterisation preaortic valve replacement. ZVA was calculated non-invasively from TTE and invasively using TD and Fick. The differences in measurements were estimated using a generalised estimating equation approach. The exchangeability of the measurements from different methods was evaluated under binary risk stratification rules.
Results The mean±SD ZVA by TTE was 4.6±1.4 vs 4.9±1.6 by TD vs 4.3±1.2 mm Hg m2/mL by Fick. From multivariate analyses, ZVA by TTE was 5.9% (95% CI −15.0 to 2.5) lower than by TD and 5.9% (95% CI −1.5 to 12.8) higher than by Fick. At the same time, ZVA by TD was 12.5% (3.0 to 22.9) higher than with Fick. Risk classifications for ZVA-based binary decision rules showed poor agreement between TTE and invasive methods (kappa ≤0.3).
Conclusions The differences in ZVA estimates between TTE and invasive standards do not appear to exceed those between the standards. As such TTE-based estimates may be deemed acceptable as a clinical measure of global haemodynamic load. However, TTE-based and invasive measurements may not be interchangeable to identify patients at risk using binary classification rules based on ZVA.
- echocardiography
- aortic valve disease
- haemodynamics
This is an open access article distributed in accordance with the Creative Commons Attribution Non Commercial (CC BY-NC 4.0) license, which permits others to distribute, remix, adapt, build upon this work non-commercially, and license their derivative works on different terms, provided the original work is properly cited, appropriate credit is given, any changes made indicated, and the use is non-commercial. See: http://creativecommons.org/licenses/by-nc/4.0/.
Statistics from Altmetric.com
Key questions
What is already known about this subject?
Valvuloarterial impedance (ZVA) is a measure of the global left ventricular (LV) afterload and is traditionally measured invasively with bilateral heart catheterisation (BHC).
Non-invasive transthoracic echocardiography (TTE) has been proposed to measure global LV haemodynamic load in aortic stenosis.
However, despite broad adoption of ZVA as a measure of global LV haemodynamic load, the agreement between TTE estimates and current BHC standards has not been quantified yet.
What does this study add?
Our study shows that the differences in ZVA estimates between TTE and invasive standards do not appear to exceed those between the standards.
As such TTE-based estimates may be indeed deemed acceptable as a clinical measure of global haemodynamic load.
How might this impact on clinical practice?
Being able to avoid an invasive test in order to obtain ZVA measurements in the work-up of a patient with aortic stenosis will increase patient safety, in addition to the fact that non-invasive testing in general is more readily available.
ZVA measured by TTE alone should be considered a routine assessment for further risk stratification in the work-up for patients with aortic stenosis, especially in those who do not meet the classic guideline criteria of severe aortic stenosis like those with low-flow, low-gradient severe aortic stenosis and preserved LV ejection fraction (paradoxical low-flow, low-gradient severe aortic stenosis).
Introduction
Valvuloarterial impedance (ZVA) is a measure of the global left ventricular (LV) afterload. In patients with aortic stenosis (AS), the haemodynamic index is defined as the ratio of the LV systolic pressure over stroke volume indexed to body surface area (BSA), that is, ZVA=(SAP+MPG)/SVI, where SAP is the systolic aortic pressure and MPG is the mean transvalvular pressure gradient after pressure recovery.1 Thus, the ZVA index takes into account both the aortic and LV valvular loads. Previous studies have suggested that ZVA may be associated with LV systolic and diastolic dysfunction,1 and may serve as an independent predictor of mortality in both symptomatic2 and asymptomatic3 patients with severe AS. This is particularly useful in patients who do not meet the classic guideline criteria of severe AS like those with low-flow, low-gradient severe AS and preserved LV ejection fraction (LVEF) (paradoxical low-flow, low-gradient severe AS). Hachicha et al4 have demonstrated that in these patients, ZVA (>5.5 mm Hg mL/m2) is an independent predictor of increased mortality and hence should be considered for risk stratification and clinical decision making.
The ZVA index can be estimated using invasive and non-invasive techniques. The invasive thermodilution (TD) and Fick CO2 rebreathing methods are the established clinical standards to measure cardiac output (CO).5 More recently, non-invasive transthoracic echocardiography (TTE) has been proposed to measure global LV haemodynamic load in AS.6 Earlier studies of LV functional measurements compared the methods for CO estimation.7–9 However, despite broad adoption of ZVA as a measure of global LV haemodynamic load, the agreement between TTE estimates and current bilateral heart catheterisation (BHC) standards has not been quantified yet.
The goal of this study was to compare measurements of ZVA from TTE and current invasive standards on a cohort of patients with severe AS who underwent BHC and TTE as part of their clinical work-up. The TD and Fick methods were used as established standards to measure stroke volume. We hypothesised that ZVA measurements by the three methods are equivalent in the sense that the differences in ZVA estimates from TTE versus BHC methods do not exceed the difference in ZVA between the two BHC standards. Furthermore, we also hypothesised that in binary risk stratification rules, the ZVA measurements from invasive and non-invasive methods may be used interchangeably.
Materials and methods
Patients
Patients with severe AS who underwent both TTE and BHC within 7 days of one another at Allina Health institutions were identified from the medical record database. Severe AS was defined according to BHC measurements, that is, if an aortic valve area (AVA) ≤1 cm2 or AVA indexed to BSA ≤0.6 cm2/m2. The indication for BHC was preprocedure evaluation for aortic valve replacement (AVR). The exclusion criteria for this study were (1) greater than mild aortic regurgitation, mitral regurgitation, mitral annular calcification or mitral stenosis; (2) severe tricuspid regurgitation; (3) prior AVR and/or balloon aortic valvuloplasty; (4) catheterisation with a less than 6″ French diagnostic catheter; and (5) transaortic mean gradient measured only via pullback with a single-lumen pigtail catheter.
A waiver of consent was granted for this study; individuals whose data were used were not individually approached. In accordance with the Minnesota Health Records Act, patients were provided the opportunity at the time of hospital/clinic registration to restrict the use of their data for research purposes. Those individuals who have not provided such a general consent were excluded. The study data were abstracted from the Allina Health Enterprise Data Warehouse.
Echocardiography
Clinical TTE was performed either with Acuson SC2000 (Siemens Healthcare, Mountain View, California) or EPIQ (Philips Medical Systems, Bothell, Washington) systems. Echocardiographic parameters were measured following the guidelines of the American Society of Echocardiography and the European Society of Echocardiography.10 For each patient measurements of LV stroke volume and the peak and mean transvalvular gradient were obtained using spectral Doppler and abstracted from TTE reports. SAP was measured by an arm-cuff sphygmomanometer. From these, valvuloarterial impedances, ZVATTE, were estimated.
Heart catheterisation
Patients underwent a standard (simultaneous) right and left heart catheterisation procedure using ≥6″ French diagnostic catheters. Transaortic mean gradient was measured either by two diagnostic catheters placed simultaneously in the left ventricle and ascending aorta or by simultaneous readings from the LV and Aorta (AO) via a dual-lumen pigtail catheter. CO was measured via indirect Fick (oxygen consumption assumed) and TD methods and used to calculate valvuloarterial impedances: ZVAFick and ZVATD.
Statistical analysis
Demographic and clinical variables as well as parameters of LV systolic function were summarised using counts (%) for categorical variables and mean±SD (median) for continuous variables. Differences and their SEs in ZVA and its components between TTE and BHC methods were estimated using a generalised estimating equation approach with Gaussian distribution and an exchangeable working correlation structure to account for within-patient dependencies; skewed variables were log-transformed prior to the analysis. The models were adjusted for baseline demographic characteristics (age, gender, BSA) and cardiovascular parameters (AVA, LVEF, SAP, MPG) as appropriate; estimates and their 95% CIs are reported.
The exchangeability of ZVA measurements from different methods was established with respect to risk stratification rules of the form ZVA>z0. For this, 31 equidistant threshold values z0 between 3.0 and 6.0 were selected and the binary rule was applied separately to ZVA from TTE and BHC; the agreements in risk classifications resulting from ZVATTE and ZVAFick and ZVATD were assessed using Cohen’s kappa statistic, K.11 Further, the performance of logistic regression as a calibration tool to improve the agreement in risk classification between TTE and BHC was assessed. For this, for each z0, logistic regression models were used to estimate pi, the probability of ZVATTE>z0 for patient i separately from ZVAFick and ZVATD. The Fick-based and TD-based models were compared using the Brier score, B=n−1∑(pi−yi)2, where the sum is over all n patients; yi=1, if ZVATTE>z0 for patient i, and 0 otherwise. As a proper scoring rule, the Brier score is a relative measure of model performance that takes into account both calibration (ie, bias) and sharpness (variability). The score varies from 0 to 0.25, with 0 indicating that risk stratification based on one kind of measure (eg, TTE) can be recovered from measurements done by BHC (eg, TD). The 95% CI for the Brier scores was estimated via a bootstrap approach with 1000 samples.12 13
In addition, we conducted a sensitivity analysis to evaluate the effect of SAP and CO measurements by BHC and TTE on classification results. For this, ZVA*TTE values were calculated using SAP and CO measurements from BHC, then risk classifications based on ZVA*TTE were compared with those based on ZVAFick and ZVATD using kappa statistics.
Results
From 101 patients enrolled in the study, 66 had CO measured using all three methods: TTE, Fick and TD (5 patients had no Fick measurements and 30 were without TD). Patients in the study were predominantly Caucasian (92%) and male (58%), with a mean age of 77±9 years. Majority had hypertension (91%) and dyslipidaemia (82%) and were taking aspirin (83%), beta-blockers (74%) and diuretics (59%) (see table 1 for more details).
Demographic and clinical characteristics of study patients
The median (IQR) time from TTE (table 2) to BHC was 2 (1–4) days. There were no appreciable differences neither in AVA measurements nor in SAP levels between TTE and BHC methods. The mean aortic valve pressure gradient on TTE was 5.8% (−15.1, 4.6) lower than when measured by BHC. The SVI by TTE was 6.5% (−0.9, 13.5) higher than by TD and 5.2% (−12.9, 2.0) lower than by Fick. In comparison, SVI based on indirect Fick was 12.5% (3.7, 22.1) larger than by TD. Using the SVI <35 mL/m2 criteria for low-flow state, 48 (73%) and 50 (76%) patients were classified into the same categories by TTE and Fick and TTE and TD, respectively. For additional information, see online supplementary appendix figures.
Supplemental material
Supplemental material
Echocardiographic parameters
On average, the differences in ZVA between TTE and BHC methods appear to be smaller than that of the two BHC methods. At the same time, the differences in ZVA between TTE and BHC are larger than between the BHC methods; in particular, the SD of the pairwise differences is 1.7 mm Hg m2/mL for TTE versus Fick, 1.9 mm Hg m2/mL for TTE versus TD, and 1.0 mm Hg m2/mL for TD versus Fick (see figures 1 and 2 and table 3). The fanning of the residuals in figure 2A,B indicates that the variability between ZVAs from TTE and BHC methods tends to increase with average ZVA. Indeed, for a 1% increase in average ZVA, the estimated increases (95% CI) in pairwise differences are 1.5% (−0.1 to 3.1) for TTE versus Fick and 1.3% (0.2 to 2.4) for TTE versus TD. For an average ZVA of 4.6 mm Hg m2/mL, these increases correspond to 0.07 mm Hg m2/mL and 0.06 mm Hg m2/mL, respectively; in comparison, the IQR of ZVA is 1.5 mm Hg m2/mL.
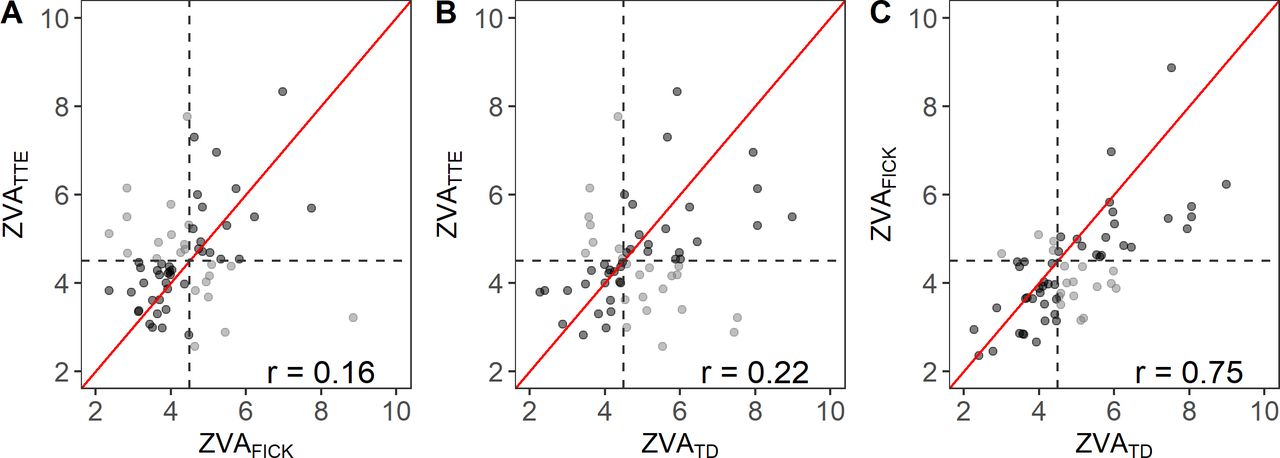
A scatter plot of ZVA measurements. (A) Fick versus TTE, (B) TD versus TTE, and (C) TD versus Fick. If agreement between methods was strong, the measurements would be clustered tightly along the diagonal (red line). (A) TTE overestimates ZVA when compared with Fick (points are mostly above the diagonal) and (B) underestimates ZVA when compared with TD (points are mostly below the diagonal). The spread of the scatter indicates that the variability between the TTE and invasive methods (A, B) is much larger than between the BHC methods (C). For risk rule ZVA >4.5 (dashed lines), Fick tends to underestimate the risk relative to TTE, and TD tends to overestimate the risk relative to both TTE and Fick; see shaded points off in the upper and lower off-diagonal quadrants, respectively. The r number in each plot is the estimated correlation coefficient. BHC, bilateral heart catheterisation; TD, thermodilution; TTE, transthoracic echocardiography; ZVA, valvuloarterial impedance.
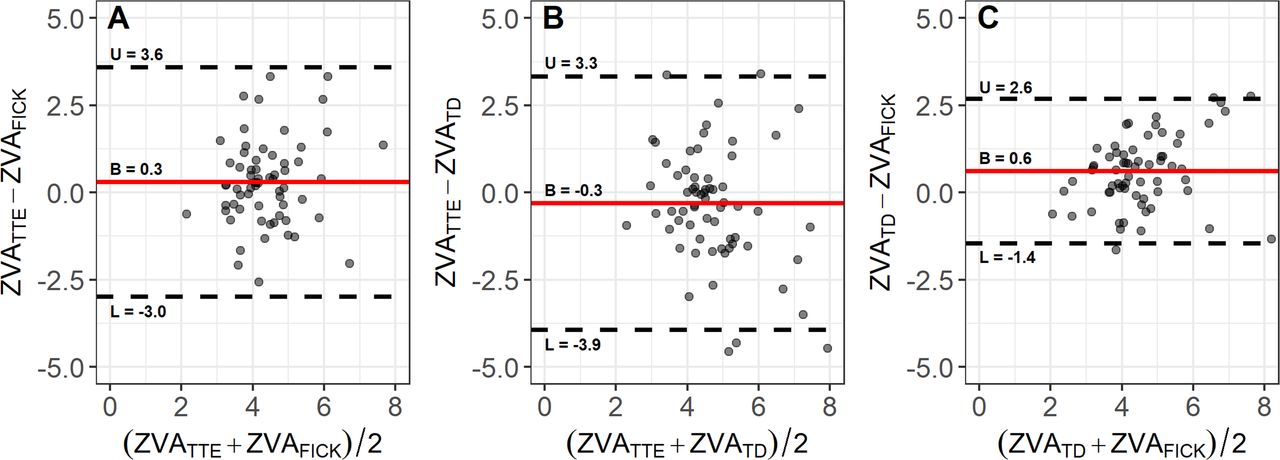
Tukey’s mean difference plots for (A) TTE versus Fick, (B) TTE versus TD, and (C) TD versus Fick with estimated mean differences (red lines) and their variability (dashed lines; L and U correspond to mean difference ±2 SD). Strong agreement between the methods would be characterised by small mean difference and small variability. Here, the mean differences for TTE versus BHC methods (A, B) are much smaller than between Fick and TD (C); however, the latter differences between are less variable than the former. BHC, bilateral heart catheterisation; TD, thermodilution; TTE, transthoracic echocardiography; ZVA, valvuloarterial impedance.
TTE and BHC parameters
From the multivariate analyses, ZVATTE was on average 5.9% (−15.0 to 2.5) lower than ZVATD and 5.9% (−1.5 to 12.8) higher than by ZVAFick. In comparison, when CO is measured by TD, the resulting haemodynamic load is 12.5% (3.0, 22.9) higher than when estimated by Fick. For an average ZVA of 4.6 mm Hg m2/mL, the 6% and 13% differences in magnitude are 0.28 mm Hg m2/mL and 0.60 mm Hg m2/mL, respectively.
For risk stratification rules of the form ZVA>z0, with z0 in the 3.0–6.0 range, the median (IQR) of kappa statistics for TTE versus BHC measurements was 0.19 (0.12–0.23), suggesting poor agreement between classifications based on ZVATTE as compared with those based on either ZVATD or ZVAFick (see figure 3A). In comparison, the summary values for kappa for Fick versus TD were 0.41 (0.36, 0.48), showing better agreement between risk classification based on BHC measurements. For ZVA >4.5, 43 (65%, K=0.29, p=0.02) patients were classified into the same risk groups by both TTE and Fick; for TD, these numbers were 41 (62%, Κ=0.25, p=0.04).
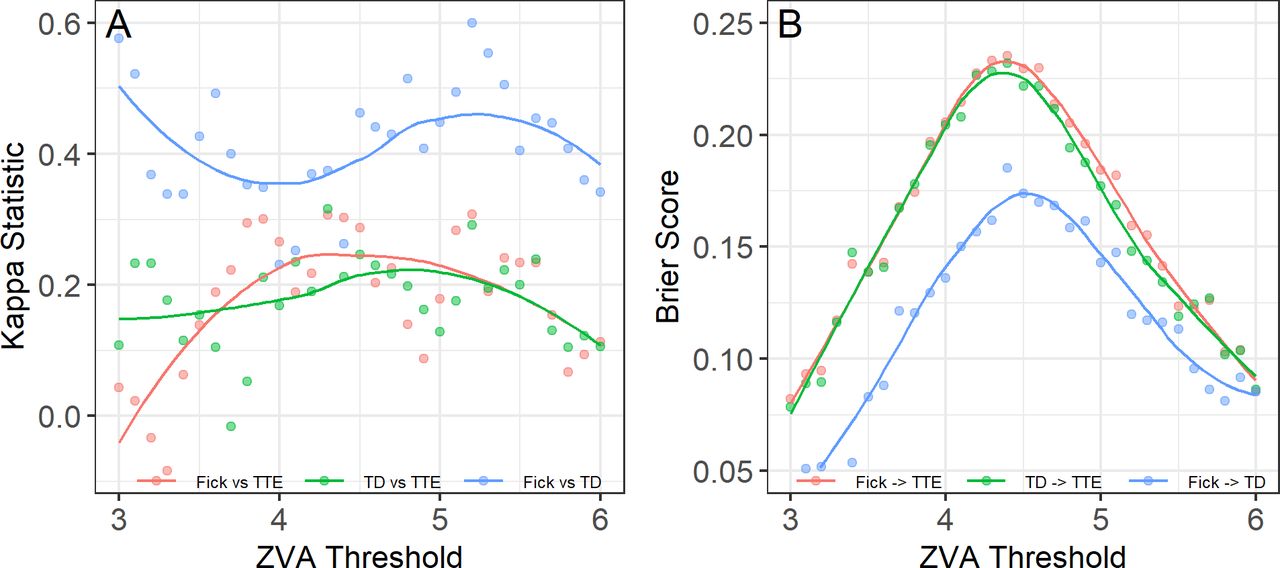
(A) Kappa statistic as a function of threshold z0 for risk stratification rule of ZVA>z0. Small kappa values indicate poor agreement in risk classification between TTE and BHC over the range of threshold values. Notably the kappa values are higher for classifications based on BHC methods. (B) Brier scores as a function of z0 for classification models to identify high-risk patients per TTE from BHC measurements (red and green colours); the lower scores the higher the agreement between classifications. The scores were calculated for 31 equidistant threshold values z0 between 3.0 and 6.0. For each z0, patients at risk were identified as ZVA>z0, separately from TTE and BHC, and the scores were computed for the resulting classifications as detailed in the methods. The score values are plotted against the corresponding thresholds with a local polynomial overlay for each model. The results indicate poor agreement between risk stratifications from BHC and TTE. In contrast, recovering TD risk classification from Fick measurements appears to be more accurate (blue colours). BHC, bilateral heart catheterisation; TD, thermodilution; TTE, transthoracic echocardiography; ZVA, valvuloarterial impedance.
The logistic regression analysis showed no apparent differences between Fick-based and TD-based ZVA values as predictors of high-risk patients per TTE threshold; the estimated balanced accuracy was 0.59±0.05 for both Fick-based and TD-based models, and the median difference (IQR) in Brier scores between the two models was 0.004 (−0.002 to 0.007) (see figure 3B, red and green curves). In contrast, lower scores indicate that the classification per TD can be recovered from Fick with much higher accuracy (see figure 3B, blue curve). At z0=4.5, the Brier scores for Fick-based and TD-based models to recover classification per TTE were 0.23 and 0.22, respectively, whereas the score for Fick-based model to recover classification per TD was 0.17.
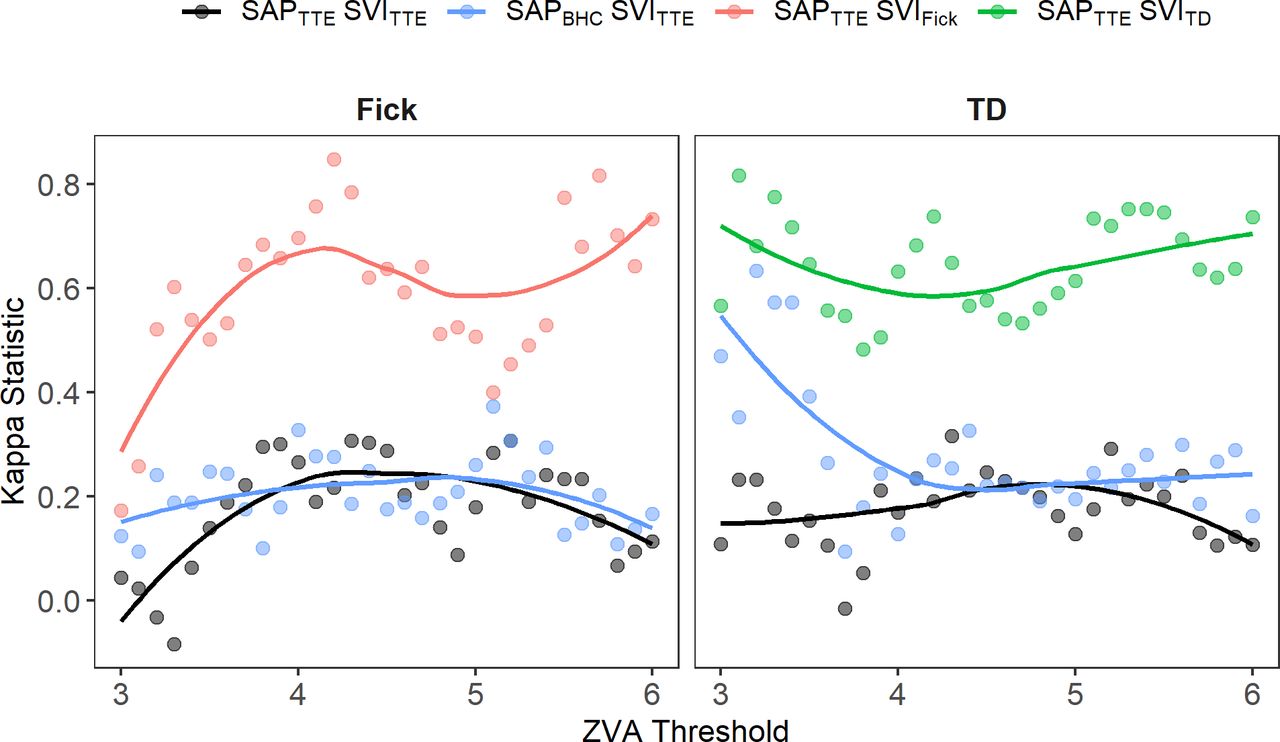
From the sensitivity analysis, the CO appears to be a more significant contributor to misclassification, that is, using ZVA*TTE based on SVIBHC improves the agreement in risk classifications relative to either ZVATD or ZVAFick, with median (IQR) kappa values of 0.6 (0.5–0.7) and 0.6 (0.5–0.7) for Fick and TD, respectively (see figure 4).
Kappa statistic as a function of threshold z0 for risk stratification rule of ZVA>z0 showing the effect of SAP and CO on classification agreement. Classification statistics based on ZVATTE and ZVA based on BHC are shown in black. Using SAP on BHC does not seem to improve the classification agreement relative to Fick and shows some improvement for z0 <3.5 for TD; see kappas and the smoother plotted in blue. Using CO based on BHC improves the agreement in risk classifications, with kappa values being above 0.5 for 75% of threshold cut-offs. BHC, bilateral heart catheterisation; CO, cardiac output; SAP, systolic aortic pressure; SVI, stroke volume index; TD, thermodilution; TTE, transthoracic echocardiography; ZVA, valvuloarterial impedance.
Discussion
The present study compared the performance of a TTE-based method for measuring ZVA in patients with severe AS relative to the two established invasive haemodynamic standards, TD and Fick. To our knowledge, this study is the first to compare TTE-based measurements of the global LV haemodynamic load with the established BHC standards. The following are the main findings of the study: (1) the differences in ZVA from TTE and BHC methods do not appear to exceed the difference in ZVA between the two invasive standards; thus, TTE may be deemed acceptable as a clinical measure of global haemodynamic load; and (2) applying a risk stratification rule of ZVA >4.5 mm Hg m2/mL, the misclassification rate for BHC relative to TTE-based measurements is about 40% for both TD and Fick; thus, TTE-based and BHC-based measurements may not be interchangeable to identify patients at risk.
In a multicentre study of patients with classic low-flow, low-gradient severe AS, ZVA did not appear to differ between true and pseudo-severe AS and was not found to be associated with operative or long-term mortality in patients with AS who underwent AVR.14 Similarly, preoperative ZVA was not associated with the long-term (≥5 year) postoperative survival in patients with high-gradient, normal-flow severe AS and preserved LVEF.15 However, in patients with paradoxical low-flow, low-gradient severe AS (normal preserved ejection fraction), an increased ZVA (>5.5 mm Hg mL/m2) was an independent predictor of increased mortality, thus guiding risk stratification and clinical decision making in clinically challenging patient populations.4
The goal of the current study was to determine the accuracy of TTE-based measurements relative to the current BHC standards. We surmised that ZVA by TTE can be deemed clinically acceptable if differences in ZVA estimates between TTE and BHC methods do not exceed that between the two BHC standards. Here, the differences in ZVA from TTE relative to BHC standards were estimated using a statistical method for repeated measurements analysis that accounts for within-patient dependencies. The results suggest non-negligible differences in TTE measurements of ZVA in patients with severe AS as compared with existing BHC standards. In particular, ZVA on TTE was on average approximately 6% (or 0.28 mm Hg m2/mL) lower than on TD and higher than by Fick; from confidence limits ZVATTE could be as much as 12% (0.55 mm Hg m2/mL) higher than ZVAFick or as much as 15% (0.69 mm Hg m2/mL) lower than ZVATD. At the same time, ZVATD is 12% (0.52 mm Hg m2/mL) higher than ZVAFick, and this difference can be as large as 23% (1.0 mm Hg m2/mL). Taken together, the results indicate that if measured in quick succession (eg, within 7 days here), the differences in ZVA values between TTE and BHC standards do not appear to exceed the difference between the adopted standards. In that sense, the TTE-based estimates may be deemed acceptable for clinical use.
With increased adoption of data-driven models in clinical practice, our study evaluated the performance of TTE with respect to risk stratification rules of the form ZVA>z0. The majority of risk rules in the literature were derived from echocardiographic measurements. As both TTE and BHC methods are used commonly to estimate ZVA, it is important to determine whether the ZVA values can be used interchangeably to identify patients at risk. Our results indicate that TTE and BHC methods are not exchangeable with respect to threshold-based risk stratification rules. For example, consider a risk stratification rule of ZVA >4.5 mm Hg mL/m2 derived from Doppler echocardiographic measurements.2 Applying this rule to ZVATTE identifies 30 of 66 patients as high risk. If the rule is applied to ZVAFick, then 23 (35%) patients would be misclassified and 14 (21%) of those may have their risk underestimated. For ZVATD, these numbers are 25 (38%) and 10 (15%), respectively. Furthermore, using a simple logistic regression to calibrate the ZVA measurements from different modalities does not appear to improve the agreement in risk classification for BHC methods relative to TTE. These results imply that while differences in ZVA between TTE and BHC do not appear to exceed those between the two standard invasive methods, ZVA estimates from different methods may not be used interchangeably in risk classification rules. Further outcome data studies are required to definitively address the question of exchangeability of ZVA measurement methods with respect to risk stratification rule.
Limitations
The echocardiographic components of ZVA (stroke volume, valve gradients) were based on published echocardiography reports in patients’ medical records. The retrospective study design is prone to selection bias. The TTE measurements were performed by trained technicians at our echocardiography department; however, the interobserver variability was not assessed. For TTE, the pressure recovery was not accounted for due to its inherent challenges in assuring reproducibility in a routine clinical setting.
Although we excluded patients with severe tricuspid valve regurgitation (TR), the presence of moderate TR (and perhaps even mild TR) may have influenced some of the TD measurements. The oxygen consumption was not directly measured in our study and may have biased Fick-based CO assessment. Due to generalised progressive arteriosclerosis in patients with AS, the central aortic systolic pressures measured with a heart catheter differ from the SAPs measured with an arm-cuff sphygmomanometer.
Conclusions
In this study, we observed that differences in ZVA estimates between TTE and BHC standards do not appear to exceed those between the standards. As such TTE-based estimates may be deemed acceptable as a clinical measure of global haemodynamic load. However, ZVA-based risk stratification rules are specific to the measurement methods based on which they were originally developed. Thus, ZVA values obtained from TTE and BHC cannot be used interchangeably to identify patients at risk.
References
Footnotes
Contributors LS: planning, conduct and reporting, overall content. AA: conduct. PS: planning and reporting. JLC: conduct and reporting. MG: planning, conduct and reporting, overall content.
Funding This work was supported by the Minneapolis Heart Institute Foundation.
Competing interests None declared.
Patient consent for publication Not required.
Ethics approval No ethics approval required.
Provenance and peer review Not commissioned; externally peer reviewed.
Data availability statement All data relevant to the study are included in the article or uploaded as supplementary information.