Article Text

Abstract
Objectives The aims of this study were to evaluate the inconsistency of aortic stenosis (AS) severity between CT aortic valve area (CT-AVA) and echocardiographic Doppler parameters, and to investigate potential underlying mechanisms using computational fluid dynamics (CFD).
Methods A total of 450 consecutive eligible patients undergoing transcatheter AV implantation assessment underwent CT cardiac angiography (CTCA) following echocardiography. CT-AVA derived by direct planimetry and echocardiographic parameters were used to assess severity. CFD simulation was performed in 46 CTCA cases to evaluate velocity profiles.
Results A CT-AVA>1 cm2 was present in 23% of patients with echocardiographic peak velocity≥4 m/s (r=−0.33) and in 15% patients with mean Doppler gradient≥40 mm Hg (r=−0.39). Patients with inconsistent severity grading between CT and echocardiography had higher stroke volume index (43 vs 38 mL/m2, p<0.003) and left ventricular outflow tract (LVOT) flow rate (235 vs 192 cm3/s, p<0.001). CFD simulation revealed high flow, either in isolation (p=0.01), or when associated with a skewed velocity profile (p=0.007), as the main cause for inconsistency between CT and echocardiography.
Conclusion Severe AS by Doppler criteria may be associated with a CT-AVA>1 cm2 in up to a quarter of patients. CFD demonstrates that haemodynamic severity may be exaggerated on Doppler analysis due to high LVOT flow rates, with or without skewed velocity profiles, across the valve orifice. These factors should be considered before making a firm diagnosis of severe AS and evaluation with CT can be helpful.
- aortic valve
- valve stenosis
- CT
- echocardiography
- computational fluid dynamics
This is an open access article distributed in accordance with the Creative Commons Attribution Non Commercial (CC BY-NC 4.0) license, which permits others to distribute, remix, adapt, build upon this work non-commercially, and license their derivative works on different terms, provided the original work is properly cited, appropriate credit is given, any changes made indicated, and the use is non-commercial. See: http://creativecommons.org/licenses/by-nc/4.0/.
Statistics from Altmetric.com
Key questions
What is already known about this subject?
Inconsistencies between the different echocardiographic parameters for grading aortic stenosis (AS) severity and with catheterisation are already known. Doppler parameters are flow-dependent, increasing with high output states, but the latter are rarely considered in clinical practice. The elliptical shape of left ventricular outflow tract is known to cause underestimation of aortic valve area (AVA) from the continuity equation, and thus overestimate the AS.
What does this study add?
Almost one-fourth of patients with severe AS on Doppler criteria may have an AVA of >1 cm2 on direct planimetry using cardiac CT angiography and are associated with lower valve calcification. This inconsistency results from high flow through the outflow tract possibly causing a skewed velocity profile through the AV orifice.
How might this impact on clinical practice?
Patients with suspected severe AS on echocardiographic criteria can benefit from assessment of AVA on cardiac CT angiography (besides calcification in the valve) to confirm the diagnosis.
Introduction
Aortic stenosis (AS) is the most common valve disorder in Western countries with an increasing prevalence due to the ageing population.1 Transthoracic echocardiography (TTE) is the first-line modality in the assessment of AS using haemodynamic Doppler parameters, such as maximum flow velocity (Vmax) and mean pressure gradient (MG), across the valve along with the aortic valve area (E-AVA) derived from the continuity equation.2–4
The aortic valve area (AVA) is theoretically considered to best represent the severity of AS, as it is less affected by flow compared with velocity and gradients. In the 1980s, E-AVA and Doppler parameters were validated against Gorlin’s AVA (G-AVA) and haemodynamic measurements obtained from cardiac catheterisation (CC)5 6 and outcome data.7 However, inconsistency in AS severity with E-AVA became evident early8 and continue to be demonstrated in several studies when compared with G-AVA9 10 and pressure gradients.11–13 Underestimation of E-AVA is more common and can cause overdiagnosis of AS severity in the presence of non-severe Vmax and MG,14 particularly in the presence of low flow,12 resulting in a call for potentially abandoning E-AVA as a primary diagnostic parameter for AS diagnosis.15 The main reason now considered to cause a smaller E-AVA is the measurement of the smaller dimension of the elliptical left ventricular outflow tract (LVOT) on TTE, resulting in a smaller area using the continuity equation.16
CT with its ability to demonstrate and quantify the AV calcium score (AVCS) has been shown to correlate well with both AS severity and prognosis14 17 and has recently been included in the European guidelines for assessment of patients with low-flow, low-gradient stenosis.2 3 Besides, ECG-gated CT cardiac angiography (CTCA) allows measurement of AVA (CT-AVA) by direct planimetry, and unlike AVA obtained from TTE or Gorlin’s method, it is not dependent on any assumptions.18 Being a three-dimensional (3-D) high-resolution volumetric data, it is routinely possible to align the images parallel to the plane of AV orifice after the scan acquisition, an ability that is unique to CTCA.19 Several studies have shown that CT-AVA is slightly larger than E-AVA,18–20 with the latter being smaller due to a smaller LVOT size measured on TTE, and the two areas become similar when CT-derived LVOT area is used in the continuity equation.21 CT-AVA may, thus, represent a more accurate representation of the anatomical area with less flow dependence.
In patients undergoing CTCA as part of transcatheter AV implantation (TAVI) assessment, we have observed a CT-AVA>1.0 cm2 even in those with severe TTE haemodynamic parameters, an inconsistency that is less well described. We hypothesised that this might be due to the valve orifice having a heterogeneous velocity profile due to its complex shape, valve thickening and calcification; all factors that may affect the AS severity estimation on TTE. In this study, our aim was to quantify the frequency of Doppler TTE and CT-AVA mismatch in patients with different levels of ventricular function and flow, and explain the cause of this inconsistency using computational fluid dynamics (CFD). CFD is a well-established technique in bioengineering and fluid mechanics that has more recently been used in clinical medicine to assess flow in cardiac and vascular structures.22 23 Further details of the CFD technique are given in the online supplementary file.
Supplemental material
Methods
Study design
A retrospective analysis was undertaken on consecutive patients diagnosed with severe AS on TTE who underwent ECG-gated cardiac CT as part of TAVI assessment over 5 years (2011–2015) at Harefield Hospital (Royal Brompton and Harefield NHS Foundation Trust), a tertiary cardiothoracic centre. Patients were excluded if they had non-interpretable CT images, bicuspid AV, moderate or greater aortic or mitral regurgitation, prosthetic AV, incomplete CT or TTE data, where the CT and TTE were performed more than 3 months apart, or had intervening balloon valvuloplasty. Patient’s demographics and baseline clinical parameters, including body mass index, heart rate, blood pressure, symptoms and cardiovascular risk factors, were collected prospectively. We have attempted to describe the study and report its findings as per the STARD (Standards for Reporting Diagnostic Accuracy) 2015 criteria.24
Echocardiography
All patients underwent comprehensive TTE using commercially available echocardiography machines (Vivid 7 or 9, GE Healthcare, Milwaukee, Wisconsin, USA and IE33, Phillips Healthcare, Andover, Massachusetts, USA) using recommended methods for evaluation and diagnosis of AS.4 The left ventricular volumes and ejection fraction (E-LVEF) were measured and calculated using Simpsons’ biplane method. LVOT diameter was measured from the parasternal long axis view at early systole. LVOT velocity time integral (VTI) and mean velocity (Vmean) were measured using pulse wave Doppler in the apical five-chamber view. The AV Vmax and MG were measured using continuous wave Doppler on multiple views. The E-AVA was calculated using the continuity equation. Stroke volume was obtained by multiplying LVOT area by LVOT VTI and was indexed to body surface area (stroke volume index (SVI)). The flow rate was calculated as LVOT area multiplied by LVOT Vmean (Qmean) or LVOT Vmax (Qmax). Velocity ratio was obtained as the ratio of VTI at LVOT and AV. Severe AS on TTE was considered as an E-AVA of ≤1 cm2, Vmax≥4 m/s, or MG≥40 mm Hg.3 4
Cardiac CT
All CT scans were performed on 64-slice (Toshiba Aquilion, Otawara, Japan) or 128-slice (General Electric, Milwaukee, USA) multidetector CT scanners. For AVCS, a standard protocol with 120 kVp, 3 mm contiguous acquisition and prospective ECG-gating was used without contrast. CTCA was performed using 100 or 120 kVp and 400–600 mA depending on the patient’s body size with retrospective ECG-gating and dose-modulation in the systolic (0%–40%) phase of the cardiac cycle. Heart rate-lowering drugs were not used due to a diagnosis of severe AS. About 70–90 mL of non-ionic, low-osmolar contrast (Iopromide, Ultravist 370, Bayer Healthcare, Reading, UK) was administered intravenously. Images were reconstructed with contiguous 2 mm collimation at every 10% interval throughout the cardiac cycle. The mean radiation dose was 13.1 and 7.2 mSv (using a conversion factor of 0.014) for CT scans performed on 64-slice and 128-slice scanners, respectively.
CT analysis
AVCS was quantified using the Agatston method including only the calcification in the AV leaflets.14 For calculation of CT-AVA, CTCA data in the systolic phase (10%–30%) was used. The method used to obtain the AV orifice in its true short-axis plane in midsystolic phase and to quantify the CT-AVA by direct planimetry is demonstrated in figure 1. A CT-AVA of ≤1 cm2 was considered as severe AS.4 End-diastolic and end-systolic phases were used to obtain LV volumes, CT-SVI and ejection fraction CT-LVEF. All post-processing was performed by a level 3 SCCT (Society of Cardiovascular Computed Tomography) cardiac radiologist, with >10 years’ experience, using advanced post-processing tools (Vital Images, Minnetonka, Minnesota, USA). All CT evaluation was performed without the knowledge of details of the patient’s clinical status and TTE results.

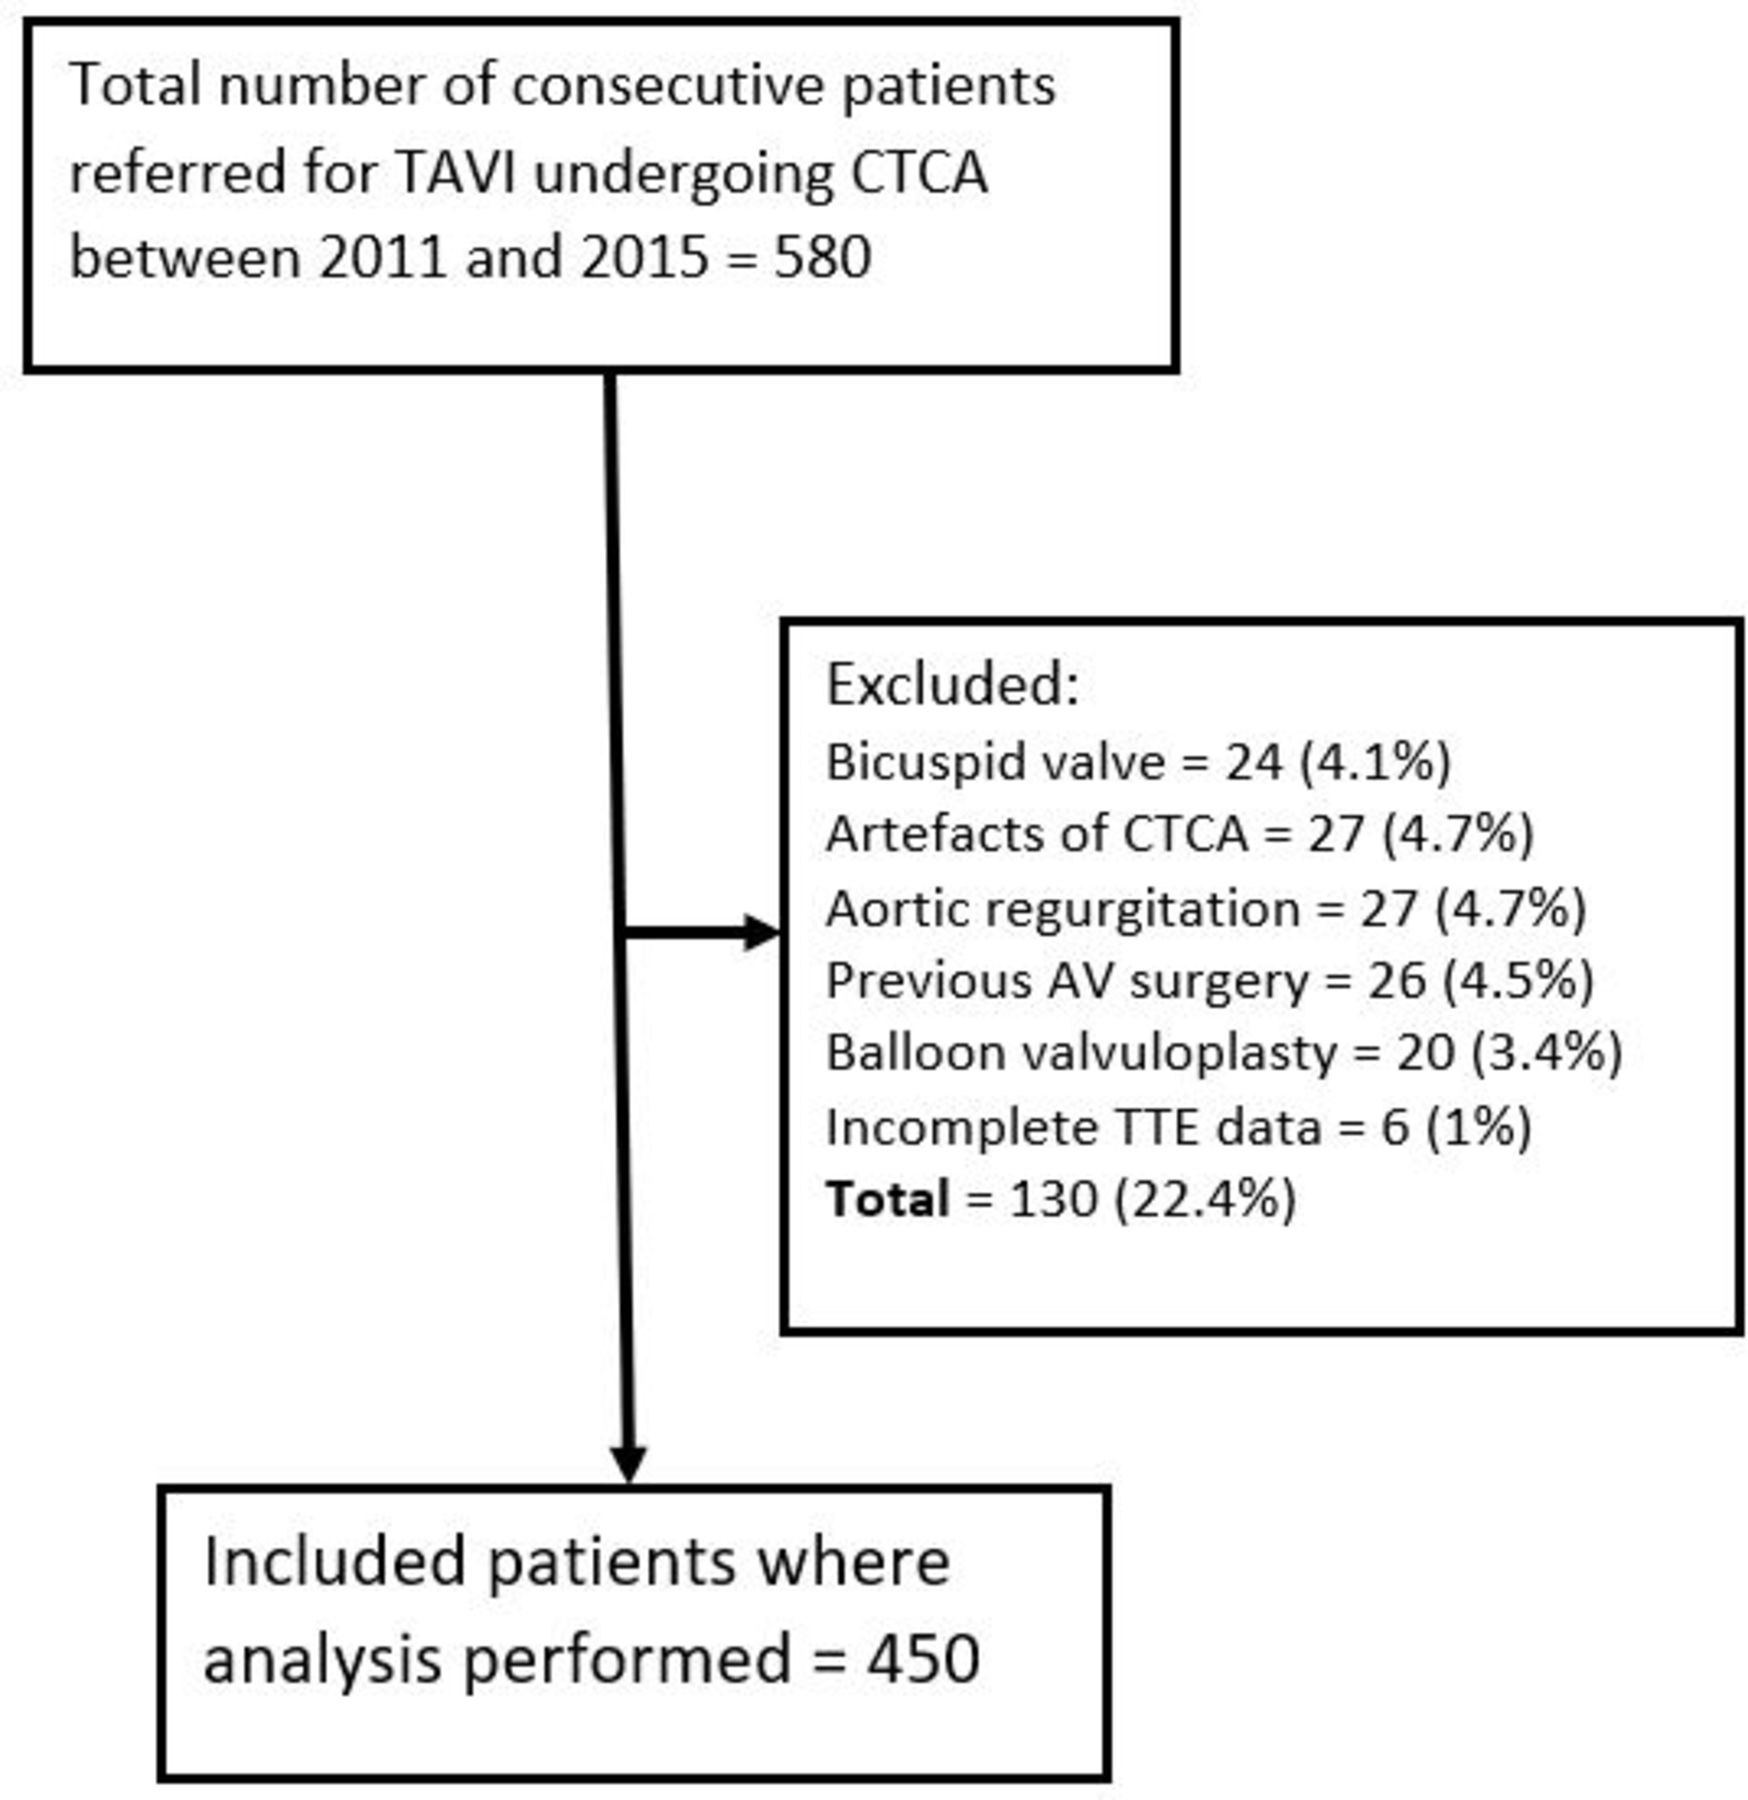
Flow diagram showing recruitment of patients in the study. AV, aortic valve; CTCA, CT cardiac angiogram; TAVI, transcatheter aortic valve replacement; TTE, transthoracic echocardiogram.
CFD method and analysis
CTCA image data from 46 patients with a tricuspid valve and Vmax≥4 m/s or MG≥40 mm Hg were selected for CFD analysis. Half of these patients had a CT-AVA of ≤1 cm2 (consistent grading), while the other half had a CT-AVA of >1 cm2 (inconsistent grading). The CTCA data at midsystolic phase were uploaded on standard CFD software (ANSYS16.2-CFX, ANSYS, Cannonsburg, Pennsylvania, USA) to generate the 3-D computational mesh and CFD simulation through the LVOT, AV and the aortic root extending into the ascending aorta. Further details of the CFD procedure are given in the online supplementary file.
Both LVOT and AV area were calculated on CFD software. The flow rate at the LVOT was derived from TTE Vmax and CFD-LVOT area, and this was used as the CFD boundary condition at the inlet plane. The distribution of peak velocities (CFD-AV) at the AV orifice was evaluated, and a ratio of ≥1.2 between peak and Vmean across the AV orifice was considered as skewed. Peak pressure gradient (PG) was obtained at the AV orifice. Additionally, the velocity ratio between LVOT and AV were obtained.
Statistical analysis
Patients were divided into three groups based on echocardiography LV function and LVOT flow: Group A: E-LVEF≥50% and SVI≥35 mL/m2; Group B: E-LVEF≥50% and SVI<35 mL/m2; and Group C: E-LVEF<50%. The strength of association of severity of AV stenosis on CT-AVA was compared with TTE parameters on a continuous scale within each group using Pearson correlation. Comparison was made across the three groups for the severity of stenosis and the degree of inconsistency was compared using the χ2 test. Continuous variables are presented as mean±SD or median (IQR), while categorical variables are presented as frequencies with percentages.
Patients with severe Doppler parameters (Vmax≥4 m/s or MG≥40 mm Hg) were divided into those with CT-AVA≤1 cm2 (consistent grading) and CT-AVA>1 cm2 (inconsistent grading). Imaging parameters were compared between the groups using χ2 test (or Fisher’s exact test for CFD parameters) for categorical variables and unpaired t-test or the Mann-Whitney test for continuous variables. Subsequently, multiple logistic regression analysis was used to examine parameters associated with inconsistent grading using a backward selection procedure. Interobserver and intraobserver variability, as well as inter-rater reliability, was performed for measurement of CT-AVA between two SCCT level 3 cardiac CT experts, with >10 years of experience, using interclass correlation (ICC) on a random selection of 50 cases with severe Doppler parameters. All analysis was performed using STATA V.13.0. A two-tailed p value of <0.05 was considered statistically significant.
Results
A total of 580 patients referred for TAVI underwent both echo and CT (mean interval 34±16 days), of whom 450 (84%) fulfilled the inclusion criteria (figure 1). The baseline clinical characteristics are given in table 1.
Baseline clinical characteristics (n=450 patients)
Comparison between CT and TTE
The majority of patients (95%) referred for TAVI had a diagnosis of severe AS due to E-AVA≤1 cm2, while only two-thirds had haemodynamically severe AS (table 2). This could be due to almost one-third of patients been referred for TAVI mainly on the basis of E-AVA≤1 cm2. A CT-AVA≤1 cm2 was also present in 65% of patients. In Group A patients, the estimation of severe E-AVA was not consistent with CT-AVA in almost one-third of patients (31%), with a mean area difference of 28% (95% CI −31% to −26%). A CT-AVA>1 cm2 was present in 28% of patients with E-Vmax≥4 m/s, and in 20% of patients with E-MG≥40 mm Hg. These differences remained in Group B and C patients, with no statistical difference between the groups (table 2).
Number of patients with severe aortic valve stenosis and inconsistent grading on CT and echo parameters in different groups. The p values are for comparison between inconsistent grading
In the 292/450 patients (65%) with a Vmax≥4 m/s and/or MG≥40 mm Hg, 67 (23%) had inconsistent grading (CT-AVA>1 cm2). The univariate analysis between the consistent and inconsistent groups is demonstrated in table 3. On logistic regression analysis, lower AV calcification, higher CT-derived stroke volume and higher LVOT flow rates were statistically significant predictors of inconsistency grading with ORs of 0.44 (95% CI 0.33 to 0.60), 1.85 (95% CI 1.31 to 2.61) and 1.76 (95% CI 1.30 to 2.39), respectively, (p<0.05).
Comparison of different parameters on CT and echo in patients with Vmax≥4 m/s and/or MG≥40 mm Hg and consistent (CT-AVA≤1 cm2) and inconsistent grading (CT-AVA>1 cm2)
The ICC for intraobserver and interobserver variability was 0.87 (95% CI 0.78 to 0.92) and 0.78 (95% CI 0.67 to 0.88), respectively. The inter-rater reliability among the two experts was 92%.
CFD analysis
The CFD simulations demonstrated that the inconsistent group had a significantly larger AVA, lower Vmax, lower peak PG and a higher velocity ratio (p<0.001) (table 4). On logistic regression analysis, the LVOT flow rate, both absolute and ≥450 cm/s3 (p=0.01), was found to be significantly greater in the inconsistent group and perhaps the main cause for the high velocity or gradient despite a CT-AVA>1 cm2. Although there was no significant difference in the velocity profile (CFD-AV) between the two groups, when combined with a high LVOT flow rate≥450 cm/s3, a skewed velocity profile (a ratio of ≥1.2 between peak and Vmean across the AV orifice) was seen to be present in 61% of inconsistent group patients compared with 22% of consistent group (p=0.007) (table 4 and figure 2). Although the velocity ratio was significantly different in the two groups (p<0.001), it was ≤0.20 in both, thus limiting its ability to distinguish between them. Different representative examples of CT-AVA and CFD correlation are shown in figure 3.
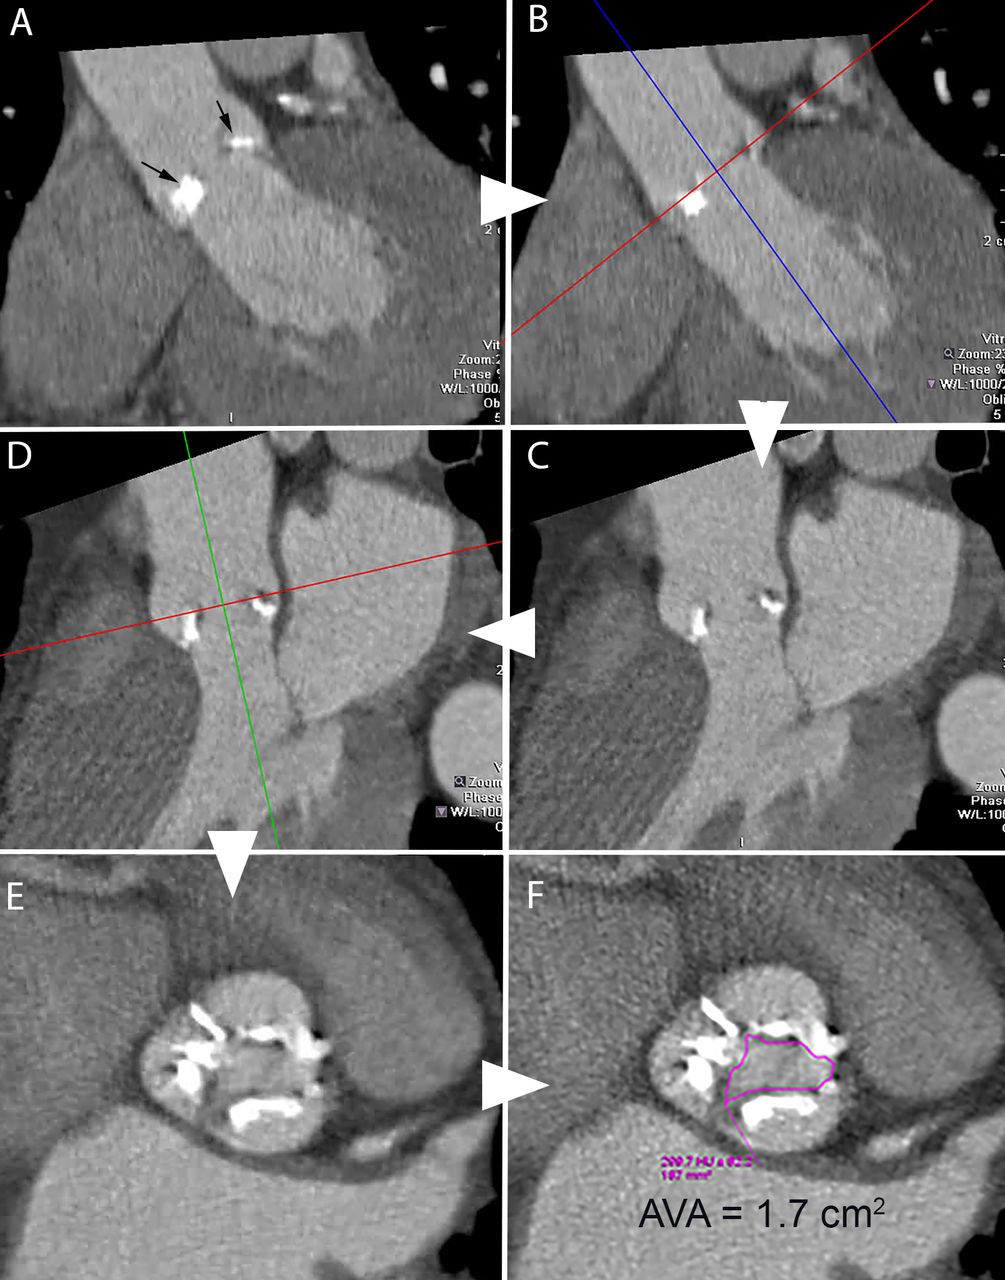
Measurement of CT aortic valve (AV) area. CT cardiac angiography images demonstrating a method of obtaining AV area in a patient with tricuspid valve with calcification. Midsystolic phase of the cardiac cycle with the maximum opening of the AV is first selected. Starting from a coronal image (A) with non-coronary (left) and left leaflets (right) (black arrows), one of the crosshair is aligned (B) such that it passes parallel to the AV plane and the other perpendicular through the AV orifice, resulting in a left ventricular outflow tract view (C). The crosshair is further aligned parallel to the valve plane (D) to produce a true short-axis view through the AV (E). By scrolling in this plane, the smallest orifice is obtained and direct planimetry of the orifice (F) is performed along the inner edges of the leaflets to obtain the AV area.

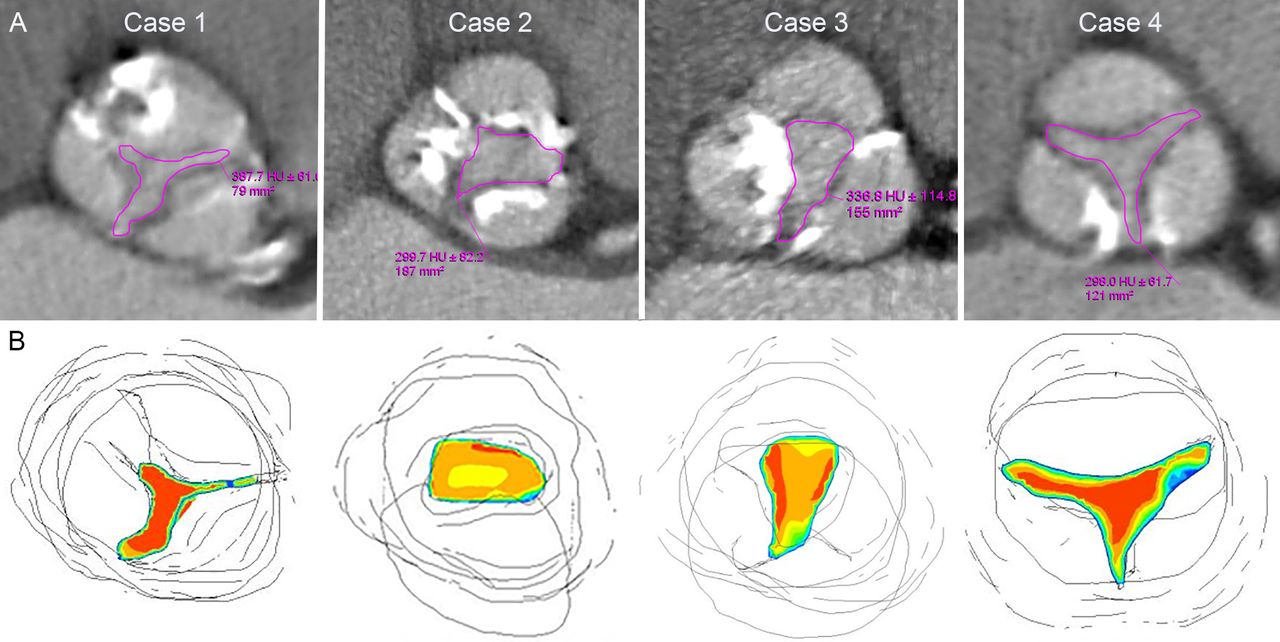
Cases demonstrating the correlation of CT aortic valve area (CT-AVA) with computational flow dynamics. All cases have echocardiographic Vmax>4 m/s and mean gradient>40 mm Hg. (A) Upper row demonstrates CT-AVA by direct planimetry, while lower row (B) depicts computational fluid dynamics simulation (red colour representing highest velocity, blue intermediate and yellow lowest). Case 1 represents consistent aortic stenosis grading with CT-AVA=0.8 cm2, flow rate=517 and flat velocity profile of 1.1. Cases 2, 3 and 4 represent inconsistent grading with CT-AVA=1.7 cm2, 1.5 cm2 and 1.2 cm2; high flow rate of 604, 701 and 530; and skewed velocity profile of 1.3, 1.24 and 1.3, respectively.
Comparison of different parameters in computational flow dynamics (CFD) patients with and without CT-AVA≤1
Discussion
Our study demonstrates that a CT-derived AVA of >1 cm2 is present in up to a quarter of patients with severe haemodynamic AS on echocardiography, regardless of ejection fraction and stroke volume. Higher stroke volume and outflow-tract flow rates on echocardiography are associated with increased inconsistency with CT grading. CFD analysis also supports that high LVOT flow rates are associated with inconsistency and may be responsible for the skewed velocity profile through the AV orifice, thus leading to higher haemodynamic parameters in the presence of larger CT valve area.
As expected, the E-AVA was the most inconsistent parameter when compared with Doppler indices, as well as CT-AVA, and results from the measurement of small LVOT diameter as discussed earlier.15 16 21 Another reason that has been used to explain a smaller E-AVA in relation to directly measured AVA is the concept that the former represents the area of the smaller vena contracta distal to the anatomical AVA.25 While this may be the case in truly severe AS, it may not be so in mild-to-moderate AS. Using Gorlin’s equation, it has been demonstrated that an MG of 40 mm Hg and Vmax of 4 m/s better corresponds to E-AVA of 0.75 cm2 and 0.82 cm2, respectively, thus questioning the 1.0 cm2 cut-off value on TTE, which was based on Gorlin’s equation.11
We did not attempt to estimate corrected E-AVA based on CT-derived LVOT areas as this was not the primary objective of this study. The overestimation of AS severity based on E-AVA cut-off of 1.0 cm2 may explain some asymptomatic patients or those with low-flow labelled as severe AS.
It is well known that velocities and gradients are flow-dependent, but clinically more careful consideration is given to low flow in the context of AS assessment rather than high flow. A few studies have evaluated the role of high flow on AS parameters in the context of exercise, resulting in an increase of Vmax and MG.26 However, increased haemodynamic parameters have been considered to represent severe AS irrespective of the valve area, although caution has been suggested in those with a high physiological cardiac output state.2 It is only in patients with bicuspid and prosthetic AV where eccentric jets have been demonstrated to cause greater pressure loss as the jet collides with the aortic wall resulting in more energy loss due to heat, flow separation and vortex formation leading to increased pressure gradients on both TTE and cardiac catheterisation studies.27 28 There is a lack of studies demonstrating a skewed velocity profile through the native AV orifice as a potential cause of increased measured Doppler velocities. An in-vitro study revealed skewed flow through stenotic bioprosthetic valves and recommended multiple views for velocity estimation.25 A recent 3-D cardiovascular MR flow analysis has also revealed a heterogeneous profile through the vena contracta and demonstrated that the simplified Bernoulli equation can overestimate MG by an average of 54%.29 The Bernoulli equation, which is based on the Navier-Stokes equation, relies on certain assumptions including a uniform velocity profile through the orifice. As we found that a skewed velocity profile is significant when associated with high LVOT flow rate rather than on its own, it is possible that the skewed profile is caused by the high flow. CTCA allows more accurate delineation of valve morphology and opening, and along with the use of CFD techniques, this variation in the velocity across the valve orifice is easier to determine.
The orifice morphology and flow channel of diseased AV are complex and not conducive to uniform flow profiles. Edges of calcified leaflets and variable commissure anatomy may cause local flow disturbance and contribute to a skewed orifice velocity profile, particularly in combination with high LVOT flow rates. The highest velocity on continuous Doppler used to calculate AS severity may not represent a true picture for the whole AV orifice and may, therefore, overestimate the degree of stenosis.
The phenomenon of pressure recovery in the ascending aorta has been shown to cause greater pressure gradients across the AV on TTE when compared with cardiac catheterisation.3 The magnitude of PR is considered small in adults, occurring mainly if the aorta is <3 cm in diameter. Falsely high gradients can also be caused by moderate or more aortic regurgitation or subvalvular obstruction.3 We had excluded these patients in our study.
ECG-gated CTCA through the systolic phase of the cardiac cycle allows assessment of valve morphology and opening, irrespective of the degree of calcification.18 Measurement of CT-AVA requires the midsystolic phase with the maximum valve opening and precise orthogonal alignment in short-axis of the valve plane to calculate the minimum orifice area. Unlike E-AVA or Doppler criteria, CT-AVA is not based on assumptions and is less flow-dependent. Calcification does not appear to hinder planimetry of CT-AVA, as it seems to deposit within the cusp margins.3 The degree of AV calcification, a parameter that is now well accepted as a marker for AS severity,3 14 was significantly lower in patients with inconsistent AS in this study.
In ECG-gated studies that include end-systolic and end-diastolic phases, an accurate estimation of LV function can be made by allowing accurate estimation of stroke volume and flow. Both CT and MRI angiographic studies have shown that this results in improved classification of AS based on flow and function.30
Study limitations
TTE and CT studies were not performed simultaneously which can potentially result in differences in haemodynamic-loading conditions and variation in measured parameters. However, our data reveal a consistent pattern of inconsistency across all three groups. As this is a retrospective analysis of clinically performed studies (TTE and CT), there may be inaccuracies in the parameters obtained; however, the severe AS based on the TTE drove the clinical referral for TAVI and hence, a CT was performed. We did not evaluate the role of cusp shape, which could play a role in forming a skewed velocity profile. Echocardiographic parameters of AS severity have been widely used clinically and validated in follow-up outcome studies, although the value of these parameters for mortality has been questioned in a recent large study.31 Similar outcome studies would be required for CT-AVA in patients with different ventricular function for the technique to be accepted.
Conclusion
Our study demonstrates that almost a quarter of patients with severe AS by TTE Doppler criteria demonstrate a CT-AVA>1 cm2. CTCA is better able to demonstrate the complex morphology of the AV orifice and cusp calcification. The inconsistency between echo and CT appears to be due to high flow rates alone or by latter causing a skewed velocity profile across the valve orifice. The peak velocity obtained on Doppler may not represent an accurate value for the whole orifice leading to a systematic ‘overestimation’ of stenosis severity. In patients with suspected severe AV stenosis on echo, further evaluation of CT-AVA along with valve calcification is recommended to confirm the stenosis severity before any valve intervention is undertaken.
Acknowledgments
Authors are grateful for the statistical assistance provided by Paul Bassett.
References
Footnotes
Contributors TKM developed the hypothesis and design the study. LR, SB, MJ and TKM collected the clinical, echocardiographic and CT data. SM was involved in the study of interobserver variability. QL was responsible for the computational fluid dynamics. TM, SB, AB, SRH, VP, TK, EDN, MD and QL assisted in study drafts and final version.
Funding This research has received no specific grant from any funding agency in the public, commercial or not-for-profit sectors.
Competing interests No, there are no competing interests for any author.
Patient consent for publication Not required.
Ethics approval NHS (National Health Service) research ethics approval was obtained (IRAS Project ID: 2014HS002H).
Provenance and peer review Not commissioned; externally peer reviewed.
Data availability statement Data are available on reasonable request.