Article Text

Abstract
Objective Cardiac biomarkers hold promise for follow-up and management of aortic valve stenosis (AVS). When interpreting serial biomarker measurements of patients with AVS, it can be challenging to distinguish ‘real changes’ from ‘random fluctuation’. Hence, robust estimation of the biological variation of these biomarkers is essential. In the present study we assessed biological variation of B-type natriuretic peptide (BNP), N-terminus pro-brain natriuretic peptide (NT-proBNP), high-sensitivity troponin-T and high-sensitivity troponin-I (hs-TnT and hs-TnI), and ST2 in subjects with stable AVS.
Methods Serial blood sampling was performed in 25 subjects with moderate AVS—confirmed by echocardiography—and all free from acute cardiovascular events in the past 6 months. Blood samples were taken on seven standardised occasions during 1 year. Analytical variation (CVA), within-subject biological variation (CVI), between-subject biological variation (CVG), index of individuality (II) and reference change values were calculated for all cardiac biomarkers.
Results CVI was highest for BNP (62.0%, 95% CI 52.5 to 75.4) and lowest for hs-TnI (9.2%, 95% CI 2.8 to 13.8). CVG exceeded the CVI for all biomarkers except BNP, and ranged from 19.8% (95% CI 13.8 to 33.4) for ST2 to 57.2% (95% CI 40.4 to 97.3) for hs-TnT. NT-proBNP, hs-TnT and ST2 revealed CVA <5%, while BNP and hs-TnI showed a higher CVA (19.7 and 14.9, respectively). All biomarkers except BNP showed marked individuality, with II ranging from 0.21 to 0.67 (BNP 1.34).
Conclusion This study provides the first biological variation estimates of cardiac biomarkers in patients with stable AVS. These estimates allow a more evidence-based interpretation of biomarker changes in the follow-up and management of patients with AVS.
Trial registration number NCT02510482
- aortic valve stenosis
- progression
- cardiac biomarkers
- biological variation
- echocardiography
This is an open access article distributed in accordance with the Creative Commons Attribution Non Commercial (CC BY-NC 4.0) license, which permits others to distribute, remix, adapt, build upon this work non-commercially, and license their derivative works on different terms, provided the original work is properly cited, appropriate credit is given, any changes made indicated, and the use is non-commercial. See: http://creativecommons.org/licenses/by-nc/4.0/.
Statistics from Altmetric.com
Key questions
What is already known about this subject?
Aortic valve stenosis (AVS) is a progressive disease with poor understanding of the exact underlying mechanisms.
Currently, echocardiography is the gold standard for diagnosis and evaluation; however, progression rates are highly variable and unpredictable.
Cardiac biomarkers may have prognostic value in patients with AVS; therefore, measurement of cardiac biomarkers holds potential to be integrated in the follow-up and management of AVS.
What does this study add?
Insight into the naturally occurring fluctuations (biological variation) of biomarkers in stable patients is essential for correct interpretation of serial measurements of biomarkers and discriminate between ‘true changes’ and random fluctuation.
Therefore, we performed serial blood sampling and measured several cardiac biomarkers in subjects with stable AVS and calculated biological variation indices.
These indices approximated those of healthy subjects.
How might this impact on clinical practice?
Our results suggest that absolute changes of biomarkers should be placed in the perspective of patient-specific ranges to identify a patient’s risk, instead of the general population-based thresholds applied in current practice.
Introduction
Circulating biomarkers are commonly used in clinical decision making for diagnosing, risk stratification and management of various cardiovascular diseases.1 2 However, the use of biomarkers in the management of aortic valve stenosis (AVS), the most common type of valvular disease requiring intervention in the Western world, is a topic of debate. The 2017 European Society of Cardiology/European Association for Cardio-Thoracic Surgery (ESC/EACTS) guidelines recommend to incorporate repeated measurements of B-type natriuretic peptide (BNP) in asymptomatic severe AVS. The 2014 American Heart Association/American College of Cardiology (AHA/ACC) guidelines do not recommend biomarkers.3 4
Once present, AVS is a progressive disease with poor understanding of the exact underlying mechanisms. Currently, echocardiography is the gold standard for diagnosis and evaluation.5 However, parameters measured during echocardiography provide limited insight into the pathophysiology and are poor predictors of progression rates.6 Single and combined biomarkers are suggested to be of prognostic value in patients with AVS.7–10 Biomarkers hold potential to provide insight into AVS progression and guide timing of intervention. In particular, serial measurements of biomarkers showing changes over time in parallel with AVS progression are of potential use in tailored AVS management. However, to interpret whether changes over time are ‘real’ and not just a physiological fluctuation, knowledge on the magnitude of physiological variation of a biomarker in stable patients is essential. This concept is known as biological variation.11 Biological variation data, when combined with analytical variation properties of an assay, can be used to calculate reference change values. That is the required threshold for a change between consecutive measurements to be statistically significant, and hence reflect a ‘true change’.12–14
Studies investigating biological variation of cardiac biomarkers have been performed in healthy subjects, but data obtained from specific patient populations are rare,15–20 limiting the generalisability of the findings from healthy subjects to patients. Biological variation of biomarkers in patients with AVS has never been reported.
The aim of the current study was to assess the analytical and biological variation of cardiac biomarkers BNP, N-terminus pro-brain natriuretic peptide (NT-proBNP), high-sensitivity troponin-T (hs-TnT), high-sensitivity troponin-I (hs-TnI) and ST2 in patients with stable AVS.
Methods
Study population
This study was executed according to the critical appraisal checklist criteria for biological variation studies by Bartlett et al.21 The study population consisted of 25 subjects (>18 years) with known moderate AVS who were followed up at the outpatient clinics of the Department of Cardiology in Maastricht University Medical Center+, the Netherlands. Severity of AVS was defined by echocardiographic measurements (mean gradient 20–40 mm Hg, Aortic Valve Area (AVA) 1.0–1.5 cm2 or maximal transvalvular velocity 3–3.9 m/s). Prior to inclusion, subjects were clinically stable and without complaints directly related to AVS. Exclusion criteria were presence of severe AVS, left ventricular ejection fraction (LVEF) <50%, documented atrial fibrillation in the last year, chronic kidney disease (glomerular filtration rate <45 mL/min/1.73 m2), and a history of acute myocardial infarction, hospitalisation for heart failure or a pulmonary embolism within 6 months prior to inclusion. Subjects who met any of the exclusion criteria and those unable to provide written informed consent were not included. At the end of the study period, subjects were evaluated to monitor progression of AVS and indication for surgical intervention. Subjects with symptomatic AVS and those showing an increase in mean gradient >7 mm Hg or maximum velocity >0.3 m/s were reported as progressive.22 23 This study was performed according to the Declaration of Helsinki and was approved by the local Institutional Review Board. All study subjects provided written informed consent. This study was registered at www.clinicaltrials.gov.
Study design
All subjects visited the outpatient clinics of cardiology of our centre on seven occasions during 1 year (baseline and 1 day, 1 week, 1 month, 3 months, 6 months and 12 months). Visits and blood samplings were performed in a standardised manner, and all patients were asked to refrain from intense physical labour and exercise training 2 days before each visit. All patient visits took place between 08:00 and 09:00, during which standard history taking and a standardised questionnaire (including medication use) were performed. Blood sampling was performed through standard venipuncture in seated position.
Laboratory measurements
Blood samples were collected in serum and EDTA tubes. Immediately after collection, standard haematological parameters (haemoglobin, haematocrit, white cell counts, neutrophils) were measured in EDTA samples using the Sysmex XE-5000 analyser (Sysmex, Kobe, Japan). The serum samples were allowed to clot and were centrifuged after 25 min (12 min, 2500g). Directly after aliquoting, samples were stored at −80°C until further analyses (performed in one batch).
NT-proBNP and hs-TnT levels were measured on the cobas 6000 analyser. hs-TnI was measured with the STAT high-sensitivity troponin-I assay (Architect 2000, Abbott Diagnostics). BNP was measured on the Architect analyser (Abbott Diagnostics) and ST2 using the Presage ST2 Assay (Critical Diagnostics). To estimate analytical variation, 60%–100% of BNP, NT-proBNP, hs-TnT, hs-TnI and ST2 measurements were performed in duplicate.
Echocardiography
Standard two-dimensional transthoracic echocardiography was performed by an independent observer prior to inclusion and during regular visits to the outpatient clinics according to the European Association of Echocardiography guidelines.24
Statistical analyses
Cochran’s C test was used to test data for homogeneity in analytical and within-subject biological variances as suggested by Fraser and Harris.25 Subjects were excluded until homogeneity of variances was achieved. Between-subject outliers were identified using the criteria of Reed.11 26 27 Between-subject biological variation (CVG), within-subject biological variation (CVI) and analytical variation (CVA) were calculated using a balanced analysis of variance with a nested random design in two levels.28 The method of Burdick and Graybill29 was used accordingly to calculate 95% CIs of the variance components.28 Additionally, the index of individuality (II) and reference change value (RCV) were calculated. An II of >1.4 indicates that the parameter shows very little individuality, and therefore the use of population-based reference values is considered appropriate because unusual values for almost all subjects will be outside the reference limits. However, an II of <0.6 and the use of RCVs may have added value over population-based reference values. RCV is the required threshold for a change between consecutive measurements to be statistically significant.13 30 The II and RCV were calculated according to the method described by Petersen et al and Fraser and Harris.25 31 32 II was calculated using the following formula: II=√(CVI2 + CVA2)/CVG. The RCV was calculated using the following formula: RCV=Z*√(2*(CVI2 + CVA2)). In this formula, Z represents the number of SD appropriate for the desired level of statistical significance for a bidirectional change. For RCV calculations in this study, a Z-score of 1.96 was used. Additionally, RCVs were calculated and evaluated after log-normal transformation.33 All statistical analyses were performed using SPSS Statistics V.22.
Results
Baseline population characteristics
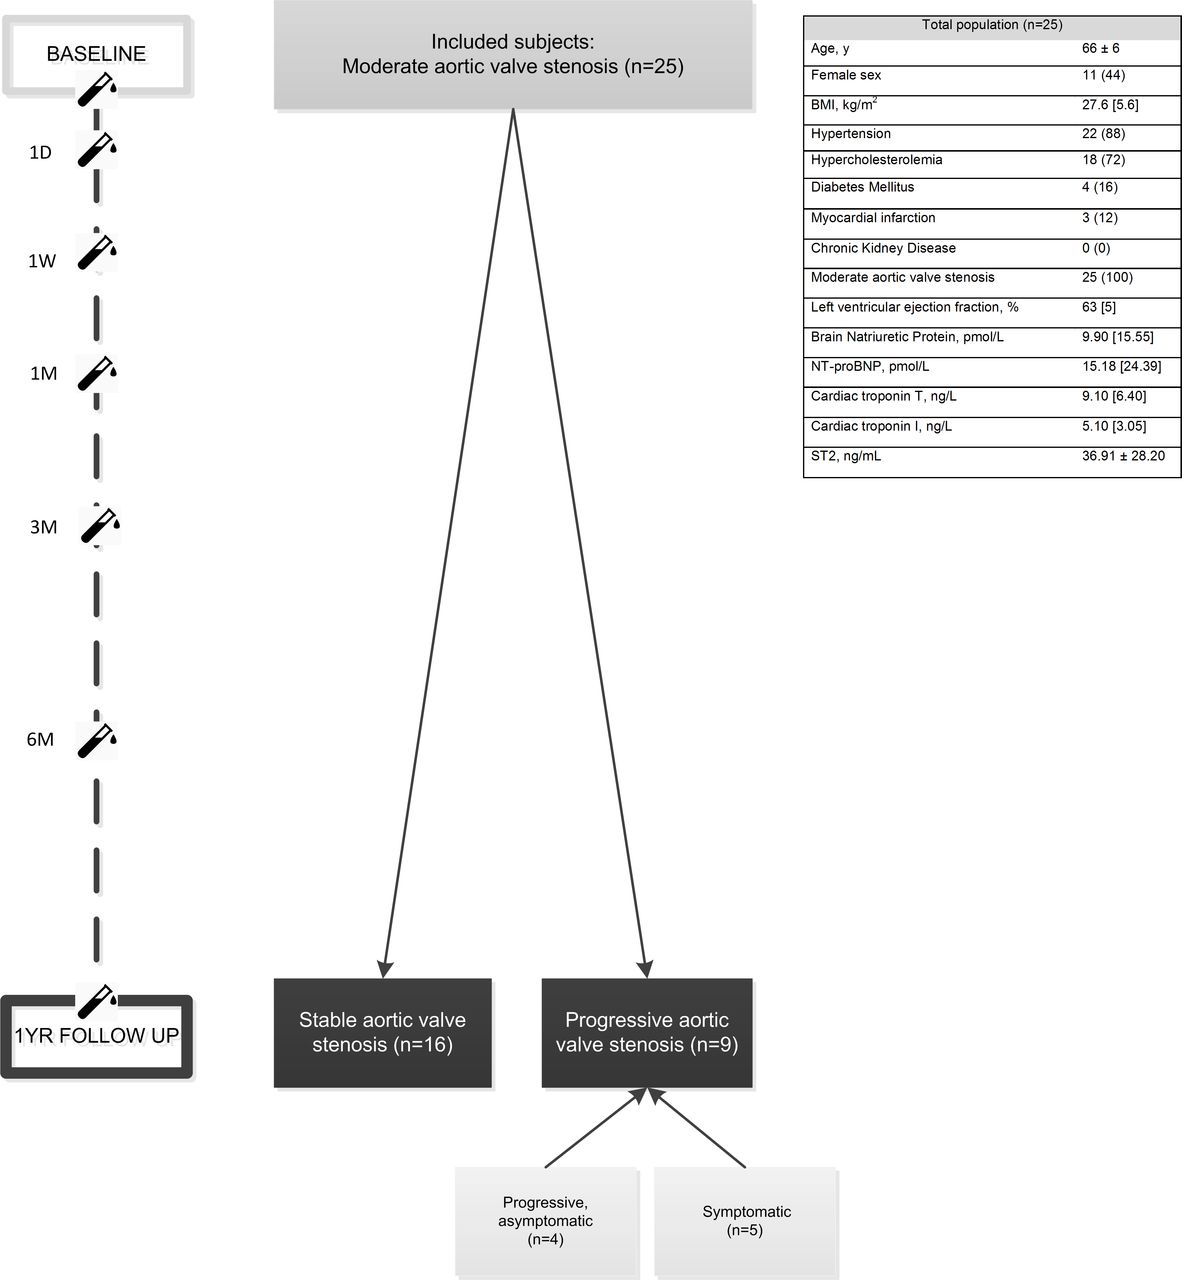
A total of 25 subjects with moderate AVS participated in the current study. The mean age (±SD) was 66±6 years, and 44% (n=11) of the subjects were female. All subjects had moderate AVS on baseline echocardiography (median (IQR) mean gradient 25 (11) mm Hg, maximum velocity 340 (65) cm/s and aortic valve area 1.3 (0.2) cm2), and the median (IQR) LVEF was 63 (5)%. None had complaints attributable to AVS. The baseline concentrations of all biomarkers are shown in figure 1.

Flow chart of the population, including baseline characteristics and follow-up. Continuous variables are expressed as mean±SD or median (IQR) depending on their distribution. Categorical variables are reported as n (%). BMI, body mass index; NT-proBNP, N-terminus pro-brain natriuretic peptide.
Biological variation in stable AVS
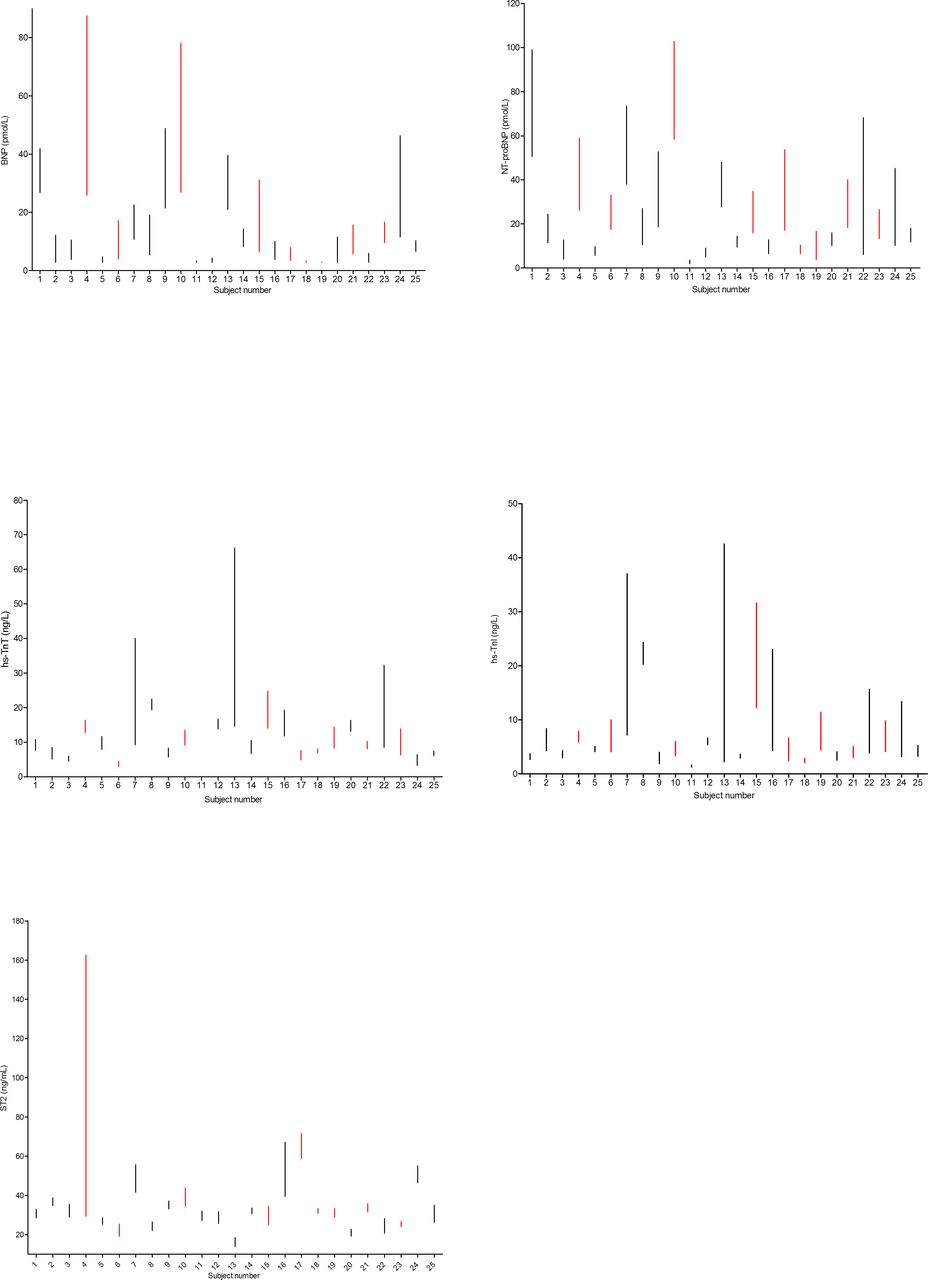
Sample collection was complete for all subjects. Figure 1 shows the baseline characteristics of the total population. Biomarker concentration ranges per subject (BNP, NT-proBNP, hs-TnT, hs-TnI and ST2) are plotted in figure 2.

Ranges ofbiomarker concentrationper subject for BNP, NT-proBNP,hs-TnT,hs-TnI and ST2 overseven measurement points during1year of follow-up. Parameters are shown in absolute ranges (minimum–maximum concentration). Red lines indicate subjects with progressiveaortic valve stenosis.BNP,B-type natriuretic peptide; hs-TnI,high-sensitivity troponin-I; hs-TnT,high-sensitivity troponin-T; NT-proBNP,N-terminus pro-brain natriuretic peptide.
In nine subjects, AVS was progressive (figure 1). Therefore, the primary analysis to determine biological variation was performed in the group of subjects who remained clinically stable during follow-up (n=16). An overview of outliers and excluded subjects per biomarker is provided in online supplementary table 1. Variation components of all cardiac biomarkers are listed in table 1.
Supplemental material
Analytical variation, biological variation, indexes of individuality and reference change values in stable aortic valve stenosis
NT-proBNP, hs-TnT, hs-TnI and ST2 revealed lower within-subject (CVI) than between-subject (CVG) values. Hs-TnI demonstrated the lowest and BNP the highest CVI (9.1%, 95% CI 2.8 to 13.8 vs 62.0%, 95% CI 52.5 to 75.4). Except for BNP, CVG was consistently higher than CVI, and ranged from 19.8% (95% CI 13.8 to 33.4) for ST2 to 57.2% (95% CI 40.4 to 97.3) for hs-TnT. Duplicate measurements allowed calculation of CVA: NT-proBNP, hs-TnT and ST2 were measured with a CVA <5%, whereas BNP and hs-TnI showed higher CVA (19.7% and 14.9%, respectively).
Additionally, the variation between specific set points, known as the index of individuality (II), was calculated. All biomarkers except BNP showed marked individuality, with II ranging from 0.2 to 0.7 (BNP 1.3). High individuality of biomarkers (II <0.6) implies that the use of RCVs for monitoring offers substantial benefit over classical population-based reference intervals.
Biomarkers in stable and progressive AVS
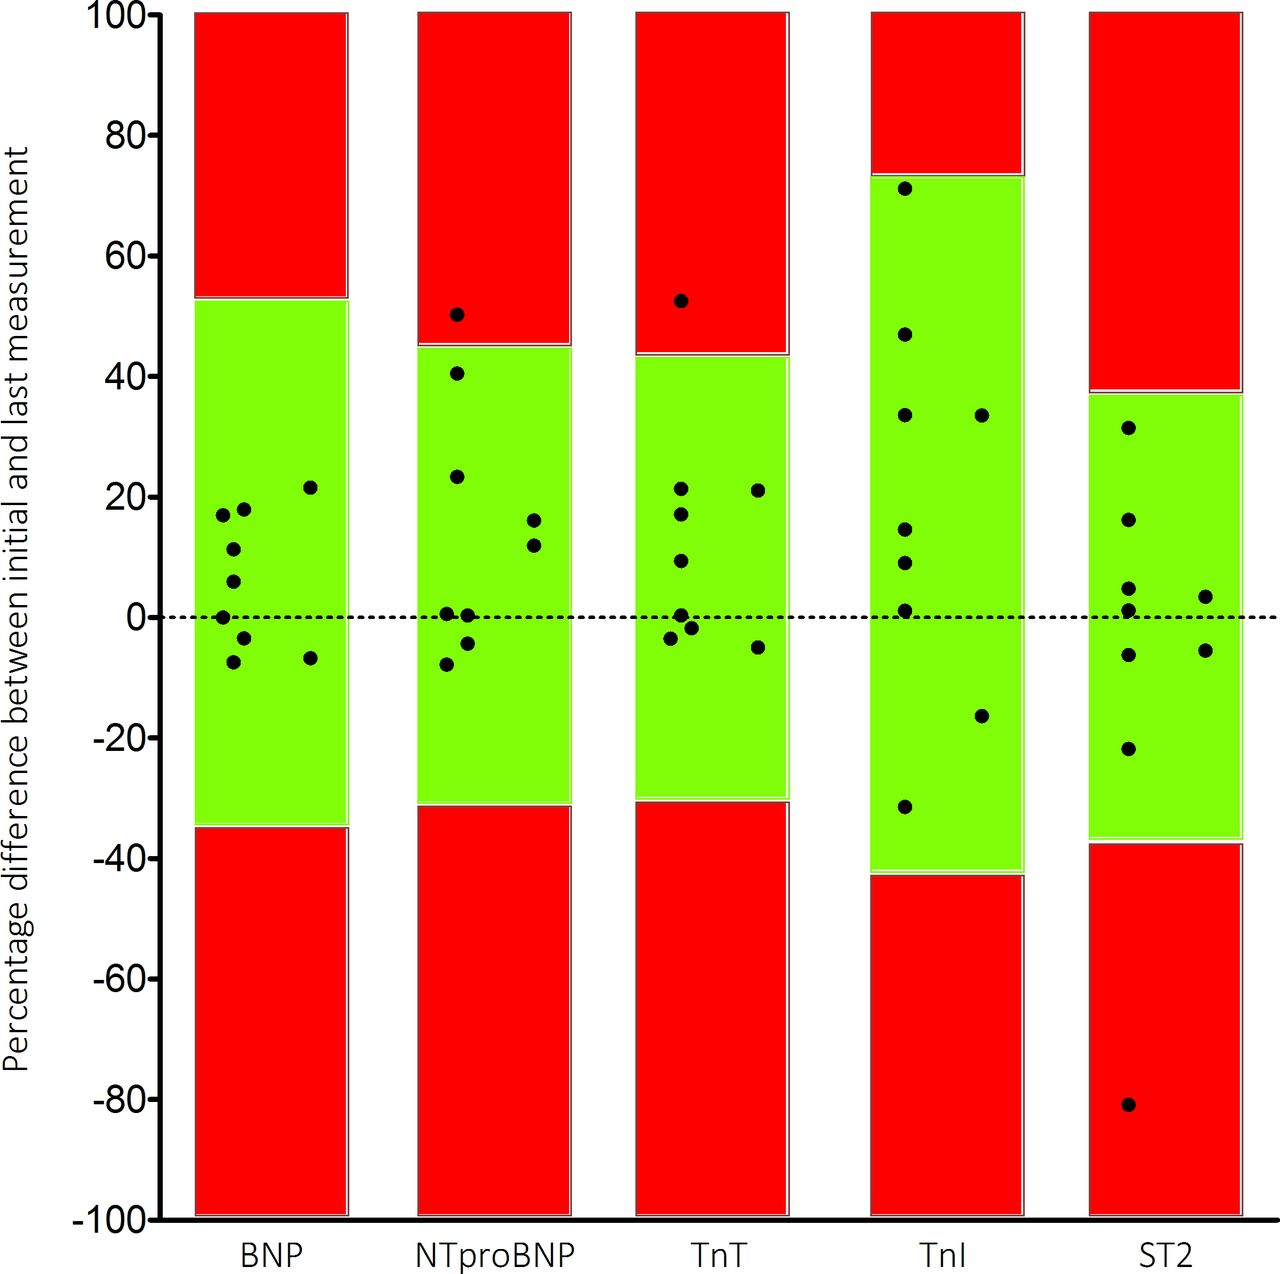
The subpopulation of subjects showing progressive aortic valve disease (n=9) was explored. Five patients progressed to symptomatic AVS after their 6-month visit. Another four remained asymptomatic, but showed progressive disease during echocardiographic examination after 1 year of follow-up. Since biomarker results from these progressive patients cannot be used to determine biological variation, we explored whether the investigated biomarkers have potential value to discriminate stable from progressive AVS. The annual variation (defined as the difference between initial measurement and measurement after 1 year) was calculated for each biomarker in all progressive subjects. These values were compared with the (log-normal) RCVs found in the stable population (figure 3). Hs-TnT and NT-proBNP variation was higher in one of nine subjects with progressive disease, whereas the RCV of ST2 was surpassed in one of nine subjects. None of the progressive subjects showed variation higher than the RCV for BNP and hs-TnI.

Observed variation in 1 year of patients with progressive aortic valve stenosis. Black dots represent the difference between the initial and last measurements (1 year). Green boxes represent (log-normal) reference change values, and dots within these boxes represent random fluctuations. Dots in the red boxes are considered true changes (outside the RCV limits). BNP, B-type natriuretic peptide; hs-TnI, high-sensitivity troponin-I; hs-TnT, high-sensitivity troponin-T; NT-proBNP, N-terminus pro-brain natriuretic peptide; RCV, reference change value.
Discussion
The management and follow-up of patients with AVS would benefit from cardiac biomarker changes that reflect or even precede clinical progression of AVS.7 8 34–37 The interpretation whether an observed biomarker change over time is clinically relevant is challenging. To interpret serial measurements, knowledge about variation components of biomarkers is essential.
This study is the first to examine biological variation of several cardiac biomarkers (BNP, NT-proBNP, hs-TnT, hs-TnI and ST2) in subjects with stable moderate AVS. We report two major findings: First, we found substantial biological variation within and between subjects with AVS (CVI=9%–62% and CVG=20%–58%), corresponding with previous studies that were conducted in healthy subjects. Within-subject variability was relatively small for ST2 and hs-TnT and hs-TnI, whereas within-subject variation was high for BNP and NT-proBNP. These results show that observed changes in consecutively measured BNP and NT-proBNP samples must be relatively large to meet the threshold for a ‘true’ change, while smaller changes between serial measurements of hs-TnT and ST2 are indicative of a significant change. Studies examining biological variation have been performed in healthy populations, but a growing interest in variation components of biomarkers in populations with (cardiovascular) disease resulted in newer studies addressing biological variation in heart failure and chronic kidney disease.15 17–20 38 We found that indices of biological variation in stable AVS approximated indices found in studies investigating biological variation in healthy subjects and chronic and stable heart failure.17 20 38
Second, between-subject variation was higher than within-subject variation in all biomarkers but BNP in our population. Both affect the II, and therefore we found low indexes of individuality in all biomarkers (except BNP) and thus marked individuality in our population. Therefore, the use of population-based reference values is of limited utility.13 14 39 Instead, the use of RCV is of value in these biomarkers.
From a clinical perspective, a low II underlines the importance of the use of RCV instead of general population-based reference intervals to interpret serial measurements in an individual. However, the individual variation is undervalued in daily practice, as we tend to interpret biomarkers above or below general thresholds to identify a patient with low or high risk. The use of RCVs with serial biomarker measurements bears potential to integrate in the development of tailored treatment strategies in personalised medicine.
Study limitations
Potential limitations of the current study merit attention. First, we included 25 patients with stable moderate AVS at baseline for analysis of biological variation. After 1 year of follow-up, nine patients showed progressive disease. Sixteen patients with stable AVS were left for primary analysis, providing us with sufficient power to make reliable estimations for variation components for primary analyses.28 Second, the size of our population did not allow stratification in sex or age groups. Due to the size of the current population, we could only explore potential serial differences between subjects with stable and progressive AVS. Further exploration of the role of these biomarkers in personalised clinical decision making would be interesting.
Conclusion
This study provides the first biological variation estimates of BNP, NT-proBNP, hs-TnT, hs-TnI and ST2 in patients with stable AVS. These estimates allow a more evidence-based interpretation of biomarker changes in the follow-up and management of patients with AVS.
Acknowledgments
We thank Abbott Diagnostics for providing kits to measure BNP and troponin-I.
References
Footnotes
Contributors All authors contributed to the planning, conduct and reporting of the work described. FECMP and SJRM are responsible for the overall content of this manuscript.
Funding This study was supported by a research grant from Stichting De Weijerhorst (Maastricht, the Netherlands) to Professor van Dieijen-Visser. The sponsor had no role in the design and conduct of the study, in the collection, analysis and interpretation of the data, or in the preparation, review or approval of the manuscript and the decision to submit the manuscript for publication.
Competing interests None declared.
Patient consent for publication Not required.
Ethics approval This study was performed according to the Declaration of Helsinki and was approved by the local institutional review board. All study subjects provided written informed consent.
Provenance and peer review Not commissioned; externally peer reviewed.
Data availability statement All data relevant to the study are included in the article or uploaded as supplementary information.