Article Text

Abstract
Aims To determine the agreement between sensor-tipped microcatheter (MC) and pressure wire (PW)-derived fractional flow reserve (FFR).
Methods and results Studies comparing FFR obtained from MC (FFRMC, Navvus Microcatheter System, ACIST Medical Systems, Eden Prairie, Minnesota, USA) versus standard PW (FFRPW) were identified, and a meta-analysis of numerical and categorical agreement was performed. The relative levels of drift and device failure of MC and PW systems from each study were assessed. Six studies with 440 lesions (413 patients) were included. The mean overall bias between FFRMC and FFRPW was −0.029 (FFRMC lower). Bias and variance were greater for lesions with lower FFRPW (p<0.001). Using a cut-off of 0.80, 18 % of lesions were reclassified by FFRMC versus FFRPW (with 15 % being false positives). The difference in reported drift between FFRPW and FFRMC was small. Device failure was more common with MC than PW (7.1% vs 2%).
Conclusion FFRMC systematically overestimates lesion severity, with increased bias in more severe lesions. Using FFRMC changes revascularisation guidance in approximately one out of every five cases. PW drift was similar between systems. Device failure was higher with MC.
- coronary physiology
- fractional flow reserve
- coronary angiography
- coronary stenting
This is an open access article distributed in accordance with the Creative Commons Attribution Non Commercial (CC BY-NC 4.0) license, which permits others to distribute, remix, adapt, build upon this work non-commercially, and license their derivative works on different terms, provided the original work is properly cited, appropriate credit is given, any changes made indicated, and the use is non-commercial. See: http://creativecommons.org/licenses/by-nc/4.0/.
Statistics from Altmetric.com
Key messages
What is already known about this subject?
A number of studies have been published comparing sensor-tipped microcatheters to pressure wires, but the findings of these studies have not been entirely consistent.
What does this study add?
This is the first study to synthesise the totality of the lesion-level data from these studies and to provide a meta-analysis of agreement between pressure wire fractional flow reserve (FFR) and microcatheter FFR.
How might this impact on clinical practice?
Clinicians who choose to use this novel device may consider interpreting the measurements differently. They can use the interactive video in the appendix to find out the range of pressure wire FFR values that correspond to a given microcatheter FFR value.
Introduction
Fractional flow reserve (FFR) measured by a sensor-equipped microcatheter (MC, Navvus; ACIST Medical Systems, Eden Prairie, Minnesota, USA) has recently been proposed for functional lesion assessment in the catheterisation laboratory.1 MC-derived FFR systems (FFRMC) offer potential advantages over standard pressure guidewire (PW) systems (FFRPW). First, because of their relatively small lumen profile (maximum diameter 0.036 inches at sensor level and 0.025 at optic fibre level) it has been suggested that MC do not interfere significantly with stenosis haemodynamics for lesions likely to need FFR assessment.1 Accordingly, FFR values across the same coronary stenosis measured by MC and PW should be numerically equal. Also, because MC are delivered over standard workhorse coronary guidewires,2 their use could, in theory, facilitate lesion crossing in complex anatomies. Finally, MC use fibre-optic sensors, which could reduce the incidence of signal drift, a recognised problem with the piezo-electric sensor technology used in most PW. Observational studies have been published comparing the two methods with regards to FFR agreement.1 3–7 While most highlight a systematic bias in the results, more than one study reports a good agreement between the methodologies highlighting the need for further analysis. Therefore, we performed a lesion-level meta-analysis of the totality of the data from all studies which compared FFRMC to FFRPW to provide the best possible assessment of the level of agreement between the two devices. We further quantified numerical agreement and changes in lesion categorisation and compared the magnitude of sensor drift and reported device failure.
Methods
Search strategy
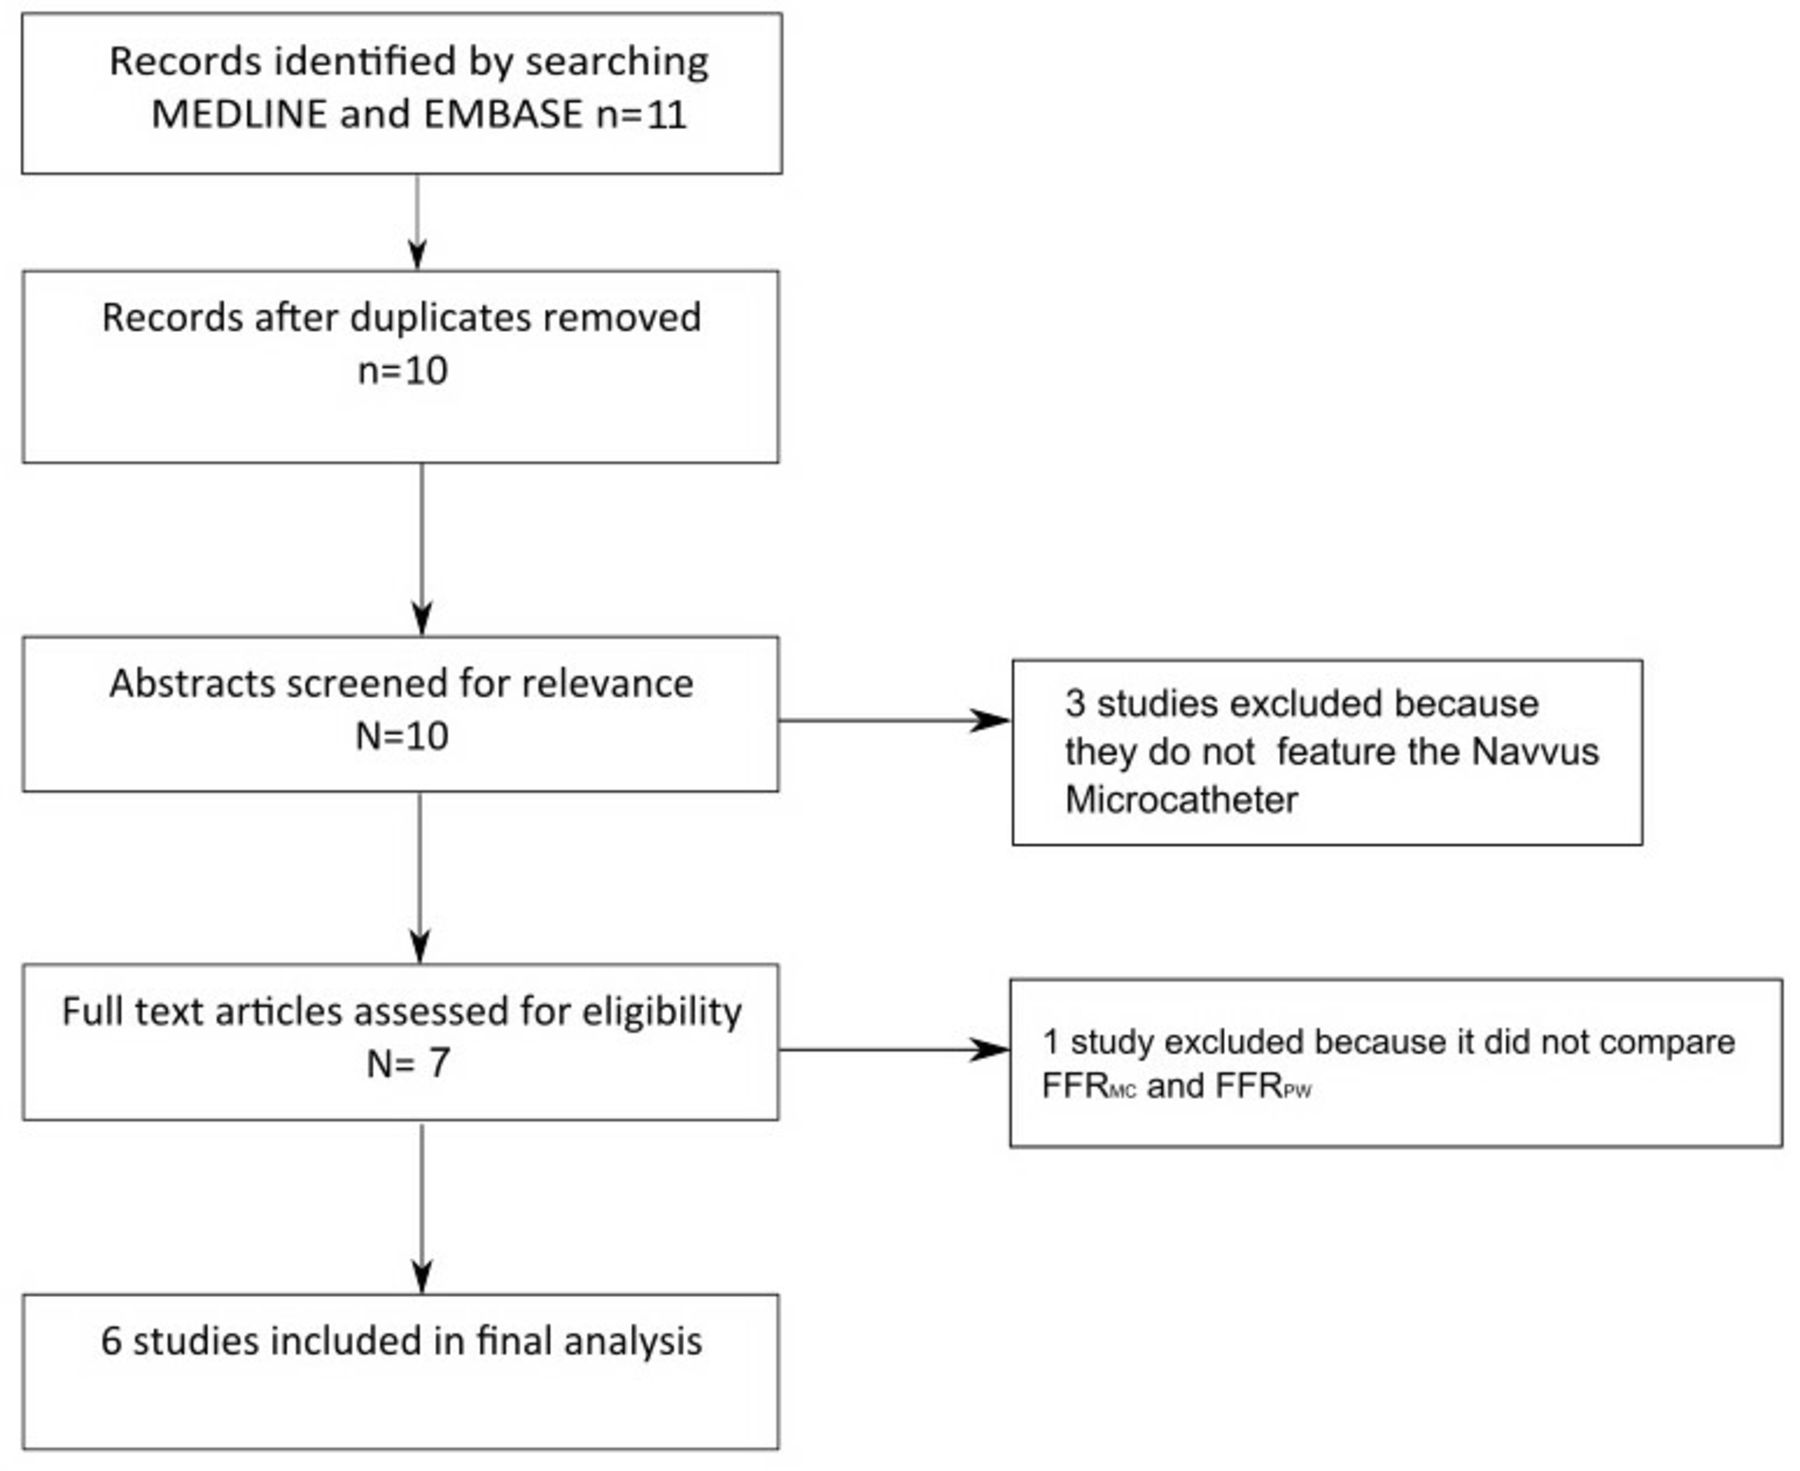
We performed a systematic review in accordance with guidelines from the Preferred Reporting Items for Systematic Reviews and Meta-Analyses.8 We searched Medline and Embase using the broad terms (“Microcatheter” AND “FFR”), (“Navvus” AND “FFR”), (“Navvus” AND “Coronary”) from May 2000 week 1 to May 2018 week 1 and we hand searched the reference lists for other studies. Two of the authors (HS and AV) reviewed all the retrieved studies including references. Studies were excluded if they did not investigate the use of the Navvus Microcatheter and compare FFRMC and FFRPW and show this lesion-level data in scatterplot. Results were limited to publications in peer reviewed journals.
Quality assessment of diagnostic accuracy studies
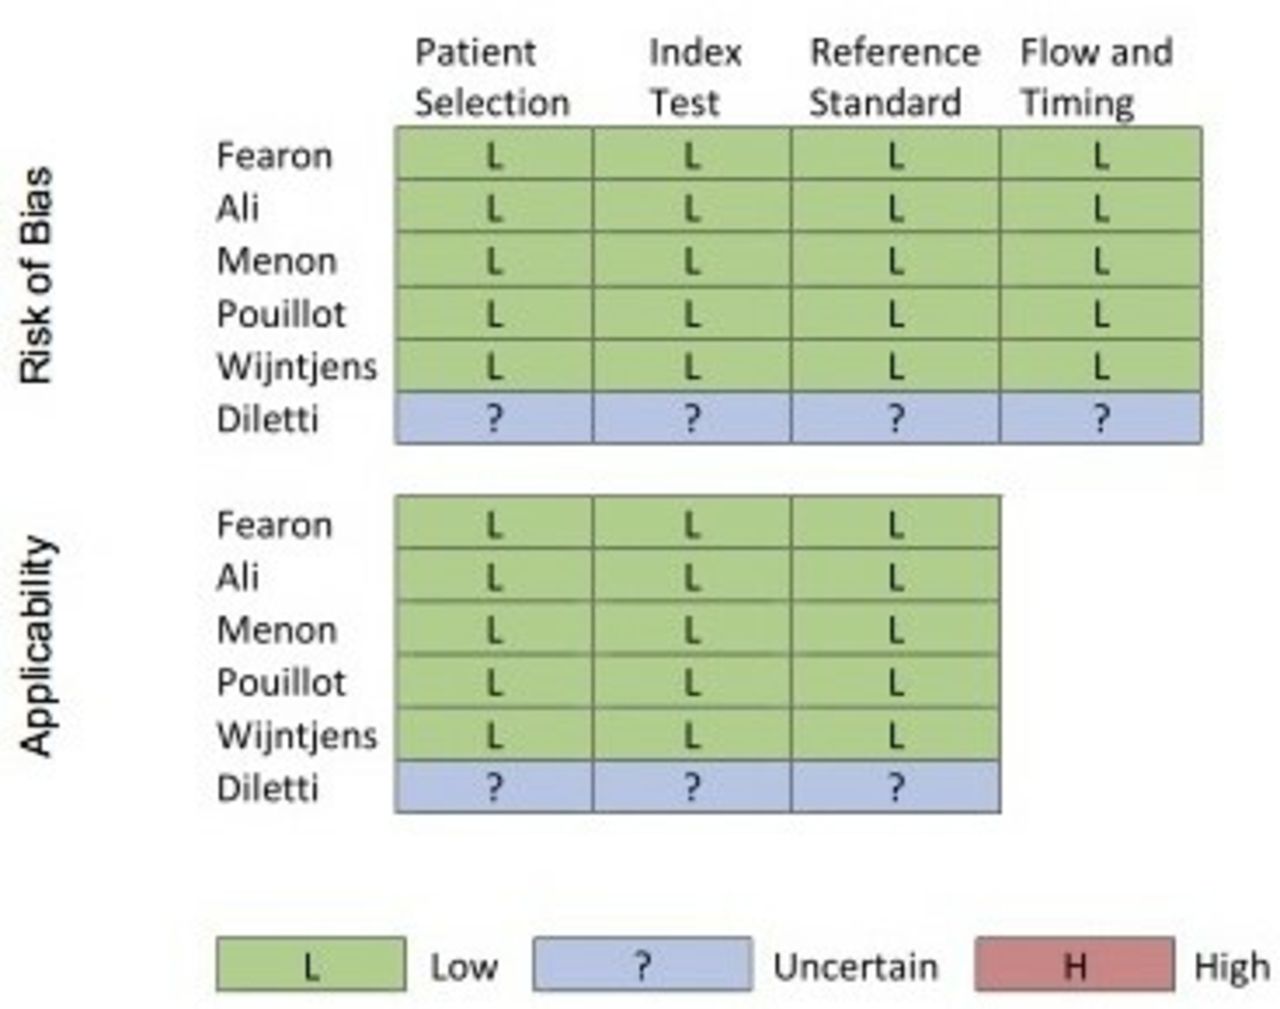
Included studies were assessed using the Quality Assessment of Diagnostic Studies tool9 which is designed specifically to assess diagnostic accuracy of studies. Risk of bias and applicability of findings are evaluated across four domains: patient selection, index test, reference standard and flow and timing. Risk of bias or concerns regarding applicability are rated as low, high or unclear. This assessment was performed and cross-checked by two authors (HS and AV) and is displayed in figure 1. Generally, we found a low risk of bias although one study1 did not report detailed methods.

Analysis of risk of bias showing generally low risk of bias in studies where detailed methods were reported.
Data abstraction
From each study, pairs of FFR values (FFRMC and FFRPW) were digitised from scatterplots using bitmap-to-digital software (Matlab, V.6.0; MathWorks). This methodology has been previously described.10 Consistency of the method was confirmed by comparing means and SD with those reported in the studies. This method allowed for a more detailed data analysis and display than the simple extraction of mean and standard errors, as most often used in standard meta-analytical approaches. Data on drift and device failure were extracted from each study.
Statistical analysis
For the baseline and summary data, continuous variables were presented as mean and SD. Categorical variables are presented as percentages. A t-test was used to compare the difference in FFRMC and FFRPW values. To compare and display FFRMC and FFRPW values, a Bland-Altman plot of their difference against the mean was produced.11 An overall mean bias and 95% limits of agreement were calculated. When the Bland-Altman plot demonstrated that the variance and mean bias was not constant throughout the range of values, the regression method of Bland and Altman12 was used. Briefly, the differences were regressed against the average to calculate the bias. The resultant limits of agreement were calculated as ±1.96 multiplied by the result of a regression of the absolute values of the residuals (from the bias regression) against the mean FFR with the coefficients multiplied by √(π/2). Exact binomial tests were used to compare the proportion of false-positive and false-negative rates. To illustrate the range of FFRPW values, a physician might expect from an FFRMC from the data in the studies, a regression line and 95% CI for the data were derived using a linear regression with methods similar to Bland-Altman. A fixed-effect meta-analysis was used to compare the differences in drift from summary data provided by the papers. Where the SD of the mean drift wafs absent, it was imputed from mean of other studies. The statistical analysis was performed using the statistical environment ‘R’,13 with the graphical package ‘ggplot2’ and the meta-analytical package ‘metafor’.
Results
Six studies, including stenosis-level data from 440 lesions (413 patients), were included in the final analysis (figure 2).1 3–7 All studies compared FFRMC to FFRPW and provided scatter plots that enabled extraction of raw data. The sample size, means and SD of extracted data points were numerically identical to those reported in each study. The mean age of the patients was 66 years and 80% were male. Patient characteristics are summarised in table 1. In four studies, FFRMC was defined as the FFR measured through the MC sensor. In one study, FFRMC was defined as the FFR measured through the PW with the MC across the lesion. In one study, the method was not stated. A larger number of lesions (519) were included in the measurement failure analysis because multiple studies reported device failure data for lesions that were excluded from FFR comparison.

Search strategy flow chart. FFRMC, microcatheter fractional flow reserve; FFRPW, pressure wire fractional flow reserve.
Demographic and clinical characteristics of included patients
Numerical agreement between FFRMC and FFRPW values
Median and IQR for FFRMC and FFRPW were 0.81 (0.74–0.88) and 0.84 (0.78–0.89), respectively (figure 3). FFRMC values were significantly lower than FFRPW (−0.029 95% CI −0.034 to −0.025, p<0.0001).

Histograms of pressure wire FFR values for FFRMC and FFRPW. These reveal a typical unimodal distribution with predominantly intermediate FFR values. The black lines indicate median values. FFRMC, microcatheter fractional flow reserve; FFRPW, pressure wire fractional flow reserve.
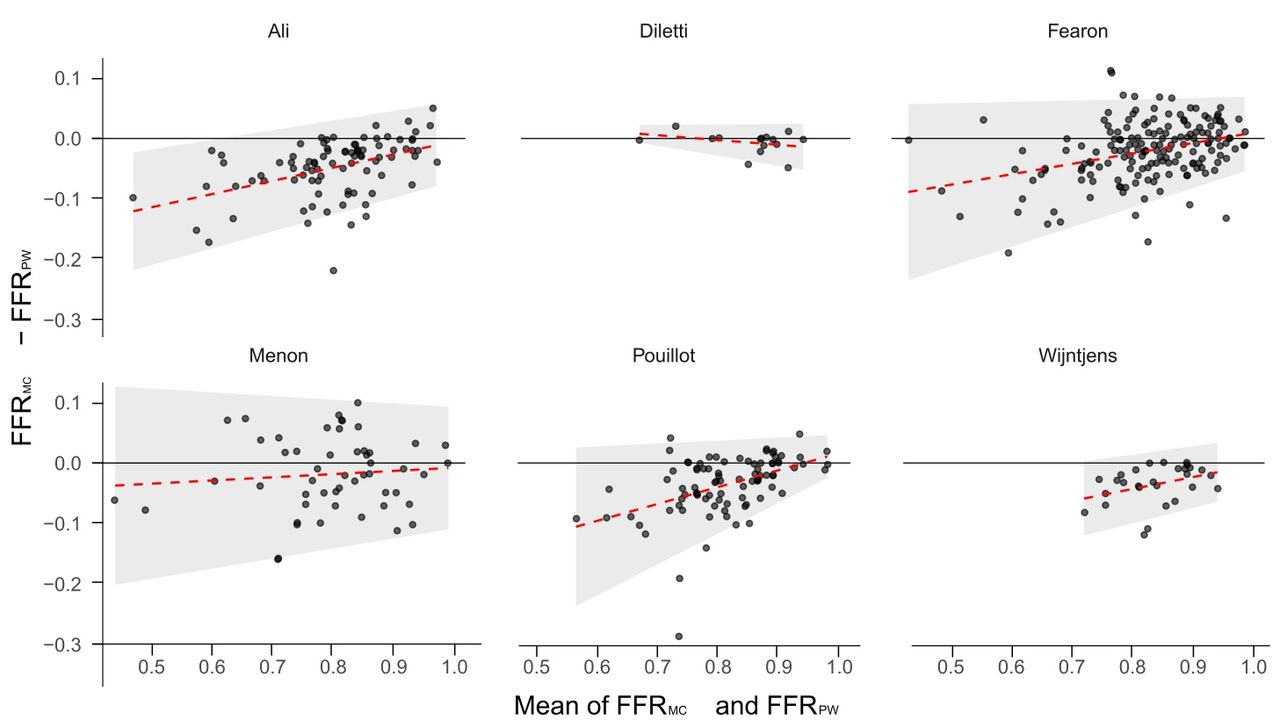
The mean bias and Bland-Altman 95% limits of agreement across all lesions were −0.029 (95% limits of agreement −0.128 to +0.070) (figures 4 and 5). The mean bias and limits of agreement were dependent on the severity of the lesion (p<0.0001 and p<0.0001, respectively). Lesions with lower FFR demonstrated greater discrepancy between methods, with FFRMC yielding increasingly lower values (figure 6 and online supplementary appendix 1). For instance, while a mean FFR of 0.90 was associated with FFRMC values 0.014 units lower than FFRPW, a mean FFR of 0.70 was associated with a 0.050 difference. Consistently, FFRMC overestimated lesion severity across the spectrum of disease severity. Furthermore, with lower FFR values, the variability of the discrepancy was also higher. At a mean FFR of 0.90, the SD of the difference between methods was ±0.036, while at a mean FFR of 0.70, the SD of the difference was ±0.053. The results from the individual trials were comparable (figure 5). We provide an online interactive tool from which readers can visualise the possible range of FFRPW values resulting from each possible FFRMC result.
Supplementary video

Bland-Altman plots of microcatheter and pressure wire FFR for the individual studies. The overall pattern of increasing bias and variability at lower FFR values is reproduced in all but one small study. FFRMC, microcatheter fractional flow reserve; FFRPW, pressure wire fractional flow reserve.

Bland-Altman plot of agreement between microcatheter and pressure wire FFR. The shaded area shows the limits of agreement between the variables. The red dashed line shows the bias calculated by regression. As can be seen the level of bias and variability increase with decreasing mean FFR value. FFRMC, microcatheter fractional flow reserve; FFRPW, pressure wire fractional flow reserve.

Scatter plot of microcatheter vs pressure wire FFR values for all lesions. The quadrants show regions of agreement and disagreement, according to the established clinical FFR cut-off of ≤0.80. The dashed black line shows a regression of the bias. If a physician records a given microcatheter FFR value, they can be 95% confident that the corresponding pressure wire FFR value would lie within the black dashed lines. Note the predominant distribution of dots in the lower right quadrant, which represent lesions reclassified from negative to positive by the microcatheter (false positives). We provide an online appendix where readers can visualise the possible pressure wire FFR results for any given microcatheter FFR. FFR, fractional flow reserve.
Lesion reclassification
Using the clinically established cut-off of FFR ≤0.80, across the 440 lesions assessed, FFRMC classified more lesions as functionally significant (47%, 207/440 vs 35%, 152/440, p<0.01). Across all stenoses, 32% (139/440) had FFR ≤0.80 by both FFRMC and FFRPW (concordantly positive) and 50% (220/440) had FFR >0.80 by both FFRMC and FFRPW (concordantly negative). Among cases of diagnostic disagreement between methods (81/440, 18%), FFRMC was more likely to yield ‘false positive’ (15%, 68/440) than ‘false negative’ (3% 13/440, p<0.0001, figure 6) results, using FFRPW as the reference method. Among the 340 lesions in the intermediate range (FFRPW from 0.60 to 0.90), diagnostic disagreement was higher (23%, 77/340), particularly ‘false positives’ (19%, 64/340, figure 7). Figure 6 is a scatter plot of the combined data from all studies showing regions of lesion reclassification across a diagnostic FFR threshold of 0.80.

Reclassification of stenoses by microcatheter FFR, using pressure wire FFR as a reference comparison and a significance cut-off of ≤0.80. Error bars show SD of percentage of stenoses that were reclassified. in one trial (1) there was no lesion reclassification (here displayed by bars of zero height). FFR, fractional flow reserve.
Signal drift
In all five studies where the method of drift measurement was recorded, drift was measured separately for the PW and MC. Of the four studies that presented a point estimate of signal drift,4–7 only one presented individual patient data.4 In three of these studies,5–7 no clinically significant difference in the mean level of drift between FFRMC and FFRPW was reported table 2. One study4 found a significantly higher mean drift with FFRPW than FFRMC. In this study, the mean drift was strongly driven by three unusually large PW drift values of 0.65, 0.40 and 0.34 (FFR units).
Signal drift reported by the studies.
Measurement failure
We defined measurement failure as inability to cross the lesion with the device and record FFR. Device failure reporting was not consistent between studies. One study did not report rates of device failure. From the remaining five studies, the overall mean rate of reported failure was higher for MC than PW (7.1% and 2%, respectively). The results are shown in table 3.
Rate of device failure reported in each study.
Discussion and limitations
We performed a lesion-level meta-analysis of 6 studies including 440 coronary stenoses, in which FFR was measured with a MC system (Navvus; ACIST Medical Systems) and compared with PW. We found that (1) MC and PW yield numerically different FFR values for the same stenosis, with evidence of a systematic bias towards lower FFR values with the use of MC; (2) the magnitude of such bias increased with functional lesion severity; (3) as a result of such numerical differences, there was a 18% rate of disagreement in lesion classification by FFRMC and FFRPW; (4) the incidence of signal drift was similar for PW and MC and (5) device failure was more common with MC.
MC FFR as a numerical replacement for PW FFR
Our analysis found that on average, MC overestimate lesion severity by 0.029 FFR units. Therefore, the methodologies cannot be seen as numerically equivalent. The notion of simply adjusting individual FFRMC values by removing 0.029 units would not provide a reliable solution in individual cases as the scatter of variation is wide (mean overall difference of −0.029 but 95% of data ranging from −0.128 to +0.070). Also, bias increased and LOA were wider with lower FFR values, for instance reaching −0.050 (LOA −0.153, 0.053) in stenoses with mean FFR of 0.70 (figure 4).
FFRMC often changes lesion classification
This study shows that the frequency of reclassification of lesions by FFRMC when compared with FFRPW was 18% (figure 7). For physiologically intermediate lesions, when FFRPW falls in between 0.60 and 0.90, the rate of reclassification increased to 23%. In practice, this means that in one out of every five lesions interrogated by FFRMC, physicians would face opposite guidance on revascularisation.14 15 This high rate of disagreement in treatment guidance means that the extensive validation supporting FFR use with PW may not be directly extrapolated to MC.16 17 Particularly, if all lesions with FFRMC ≤0.80 were to be offered revascularisation, this would result in an increased rate of stenting when compared with FFRPW (15% of total lesions). This could potentially increase procedure-related morbidity, as well as costs,18 without necessarily improving patients’ symptoms or reducing ischaemia-related events.
Interaction with lesion severity
Our findings indicate that, for stenosis with lower FFR values, the bias in FFRMC readings compared with FFRPW is greater. One possible explanation for this is that the proportional effect of the size of the MC is greater for narrower lesions. This is in keeping with previous studies,3 5 which observed that the increased crossing profile of the MC might lead to a greater influence on numerical values when the ratio of its profile area to the mean lumen area was greater. The importance of device bulk on FFR values had been established previously in the case of fluid-filled catheters and ‘buddy’ wires.19 20Figure 8 schematically demonstrate how MC profile interacts with coronary stenosis geometry and artificially yields lower FFR values. The MC occupies a larger proportional area at the level of the lesion. Although the maximum diameter of the device is 0.028 inches, at the level of the lesion, its cross-sectional area is greater than that of the PW. In this scenario, the MC itself impedes antegrade flow resulting in a lower FFR value. This might explain the comparatively greater bias for lower FFR values measured with MC as compared with PW in more severe stenoses. The MC has been shown in one study to increase stenosis resistance, which supports the concept that it interferes with lesion haemodynamics.5

The impact of device cross-sectional area on vessel haemodynamics. Scalar image illustrating the cross sections of the device and the wire on which it is mounted at three different levels: the optical cable level within the lesion: the optical sensor level beyond the lesion and the workhorse wire alone beyond the lesion. Diameter stenosis at optical fibre level is 57%. Area stenosis is 81%. Although the maximum diameter of the device is 0.028 inches, at the level of the lesion, its cross-sectional area is more than twice that of the guidewire (0.25 mm2 vs 0.10 mm2). In this scenario, the microcatheter itself impedes antegrade flow with a resultant lowering of the FFR value.
No reduction in signal drift
This study shows that there is no clinically significant difference in levels of drift between MC and PW. Both studies without significant outliers reported a difference of only 0.01 FFR units (table 3). Sensor drift is an important source of error during physiological assessment and it is generally recommended that measurements should be repeated when drift is greater than ±0.02.2 21 Because the Navvus catheter contains an optical sensor rather than the piezo-resistive sensor used in standard PW, it emerged with great expectations for signal drift reduction.4 While across the four studies which provided mean drift values, drift was lower with FFRMC than FFRPW the difference was driven by a single study,4 that reported a mean drift of 6 mm Hg with FFRPW, a value almost twice as large as seen with other studies.
Device failure
The theoretical benefit of the MC offering increased ease of use (because it can be passed over standard intracoronary guidewires) is not supported by our study. In fact, the studies included in our analysis showed the opposite: higher levels of device failure with the MC (overall 7.1% vs 2% for pressure guidewires). It is likely that, in practice, anatomies with increased tortuosity or calcification which are often difficult to cross with PW would also offer the same resistance for a bulkier over-the-wire MC system.
Implications for clinicians
Technological developments such as the Navvus microcatheter system can lead to increased use of coronary physiology and improve on the known limitations of angiography. Therefore, if clinicians prefer to use coronary workhorse wires routinely and measure FFR with microcatheters instead of using anatomical guidance, they should remain encouraged, providing that FFRMC values are interpreted with caution.
Our findings highlight important practical differences between MC and PW FFR systems. First, because of the −0.029 numerical differences between methods and a relatively high rate of lesion reclassification, guideline recommendations which apply to FFRPW should not be extrapolated universally to FFRMC when FFR values are of intermediate severity. For instance, a physician who obtains a FFRMC of 0.70 might expect, in 95% of cases, to obtain a FFRPW of between 0.66 and 0.85. Similarly, a FFRMC of 0.75 would be consistent with FFRPW values that ranged from 0.71 to 0.88 and a FFRMC of 0.80 would be consistent with FFRPW values that ranged from 0.75 to 0.91 (figure 6 and online supplementary appendix 1).
Second, physicians and healthcare systems should be aware that an increased rate of stent implantation could potentially result from the routine use of FFRMC and a rigid 0.80 cut-off interpretation. This could lead to increased costs and the known consequences of unnecessary stent implantation.18
Study limitations
All of the studies included were open label observational studies, which increases the risk of bias. These studies were not performed with uniform comparator wire technology and therefore the MC was being assessed against a heterogeneous group of alternative technologies. One study used the Philips Volcano Combowire which is not used in routine clinical practice,5 but has the same profile (0.014 inches).
Our analysis was not performed with the original data from each study. We, however, used a reproducible and well-validated methodology10 to extract each data point from each study, which still permitted a lesion-level analysis. This method provides a nearly identical approximation of the individual data points and resulted in an overall equal mean and SD reported by each study.
Conclusions
Compared with standard pressure guidewires, currently available MC technology (Navvus Microcatheter System) introduces a systematic bias to FFR, leading to lower values and a significant rate of lesion reclassification. Microcatheter FFR is not associated with a meaningful reduction in signal drift and demonstrate a higher rate of device failure. Pressure guidewires should, therefore, remain the reference standard for physiological lesion assessment.
References
Footnotes
Contributors HS, MSS, RP: design of the work. HS, MSS, AV, RP: data acquisition, interpretation and analysis. HS, MSS, AV, CK, CC, YA, JH, SS, RAL, SN, DC, JD, JM, DF, RP: critical review. All authors reviewed and approved the final manuscript.
Funding The authors are grateful for the infrastructural support from the National Institute of Health Research (NIHR) Biomedical Research Centre based at Imperial College Healthcare NHS Trust and Imperial College London. Drs Shun-Shin, Davies and Francis are supported by grants from The British Heart Foundation (FS/14/27/30752, FS 04, 079, FS 05/006). Dr Cook is supported by a grant from The Medical Research Council (MR/M018369/1). Dr Petraco is supported by a National Institute for Health Research clinical lectureship grant (CL-2015-21-001).
Competing interests Drs Cook, Al-Lamee and Nijjer have conducted teaching sessions supported by Volcano Corporation. Dr Petraco is a consultant for Philips Volcano. Dr Davies is a consultant for and has received research funding from Philips Volcano. Dr Sen has attended and conducted teaching sessions supported by Volcano Corporation, St. Jude Medical, Medtronic, Pfizer and AstraZeneca. Dr Chamie has acted as a consultant to Abott Vascular inc. All other authors have reported that they have no relationships relevant to the contents of this paper to disclose.
Patient consent for publication Not required.
Provenance and peer review Not commissioned; externally peer reviewed.
Data sharing statement No additional data are available.