Article Text

Abstract
Objective Mechanical evaluation of dyssynchrony by echocardiography has not replaced ECG in routine cardiac resynchronisation therapy (CRT) evaluation because of its complexity and lack of reproducibility. The objective of this study was to evaluate the potential correlations between electromechanical parameters (atrioventricular, interventricular and intraventricular from the dyssynchrony model presented in 2000), their ability to describe dyssynchrony and their potential use in resynchrony.
Methods 455 sets of the 18 parameters of the model obtained in 91 patients submitted to various pacing configurations were evaluated two by two using a Pearson correlation test and then by groups according to their ability to describe dyssynchrony, using the Column selection method of machine learning.
Results The best parameter is duration of septal contraction, which alone describes 25% of dyssynchrony. The best groups of 3, 4 and ≥8 variables describe 59%, 73% and almost 100% of dyssynchrony, respectively. Left pre-ejection interval is highly and significantly correlated to a maximum of other variables, and its decrease is associated with the favourable evolution of all other correlated parameters. Increase in filling duration and decrease in duration of septum to lateral wall contraction difference are not associated with the favourable evolution of other parameters.
Conclusions No single electromechanical parameter alone can fully describe dyssynchrony. The 18-parameter model can be simplified, but still requires at least 4–8 parameters. Decrease in left pre-ejection interval favourably drives resynchrony in a maximum of other parameters. Increase in filling duration and decrease in septum–lateral wall difference do not appear to be good CRT targets.
- cardiac resynchronization therapy
- electromechanical parameters
- resynchrony
- left pre-ejection interval
This is an open access article distributed in accordance with the Creative Commons Attribution Non Commercial (CC BY-NC 4.0) license, which permits others to distribute, remix, adapt, build upon this work non-commercially, and license their derivative works on different terms, provided the original work is properly cited, appropriate credit is given, any changes made indicated, and the use is non-commercial. See: http://creativecommons.org/licenses/by-nc/4.0
Statistics from Altmetric.com
Key questions
What is already known about this subject?
In 2000, after a conference on resynchronisation to which, as a pioneer of the technique, I had been invited to speculate about mechanisms of action, the editor-in-chief of Heart invited me to write an editorial on the subject. It was from this invitation that the atrioventricular, interventricular and intraventricular model of dyssynchrony was born. With repeated use, certain parameters of this model have become very popular but the model itself has never been validated.
What does this study add?
For the first time, this study presents an analysis of the correlations that exist between the 18 different parameters of the dyssynchrony model and shows that just as QRS width is unable to describe dyssynchrony in its entirety, no single echocardiographic parameter is able to either. The analysis also shows that the model can be reduced from 18 to 10 parameters without loss of effectiveness and that three or four carefully chosen parameters are enough to describe dyssynchrony in routine clinical practice.
More importantly, however, one parameter stood out from the rest in its ability to describe resynchrony, left pre-ejection interval (LPEI). More popular parameters from the dyssynchrony model, such as filling time, septal-left lateral wall delay and interventricular delay, may not be of much use for describing resynchrony in practice.
How might this impact clinical practice?
If the role of LPEI in resynchrony can be clinically confirmed, this easy-to-measure parameter will allow us to discriminate between genuine non-response to cardiac resynchronisation therapy (CRT) and suboptimal delivery of CRT.
Introduction
Since the early days of multisite stimulation for heart failure, it was suspected that one of the mechanisms for improving cardiac function resided in correcting pre-existing dyssynchrony.1 The worldwide popularity of this concept immediately led to it being named cardiac resynchronisation therapy (CRT), whose effective delivery was demonstrated by QRS narrowing on surface ECG. Unfortunately, as frequently observed and as pointed out in a recent review,2 ‘QRS narrowing lacks the ability to predict accurately effective delivery of CRT and positive response’.
Many echocardiographic studies have unsuccessfully tried to determine mechanical parameters able to predict favourable outcome.3 4 Results from the Predictors of Response to CRT (PROSPECT) trial3 were disappointing because everyone had great expectations for Doppler tissue imaging, but intraobserver and interobserver variability of the data were large. After PROSPECT, the general opinion was that no single measure of dyssynchrony could be recommended for patient selection,5 and echocardiography-guided CRT (EchoCRT) confirmed the absence of value of classical dyssynchrony parameters in a narrow QRS population.4 The medical community, however, failed to emphasise the positive predictive value of simple reproducible Doppler electromechanical parameters, such as left pre-ejection interval (LPEI), interventricular delay (IVD) and the ratio of duration of left ventricle diastolic filling to heart rate (DFT%), which all met predetermined cut-off criteria of the study. These parameters are defined as electromechanical because they refer to ECG timings. They are extracted from a global model of cardiac dyssynchrony proposed when CRT was new,6 have been frequently used but never evaluated per se. The model, in fact, appeared to be too complex for use in daily practice. However, as several parameters of the model are derived from others (such as, eg, IVD=LPEI−right pre-ejection interval (RPEI)), the question of its simplification came up.
The objective of the present study was to evaluate the potential correlations between the different parameters of the model, then to rank them according to their ability to describe dyssynchrony, and finally to evaluate their potential to describe resynchrony.
Methods
Reminder of the original model for the evaluation of AV, interV and intraV dyssynchrony
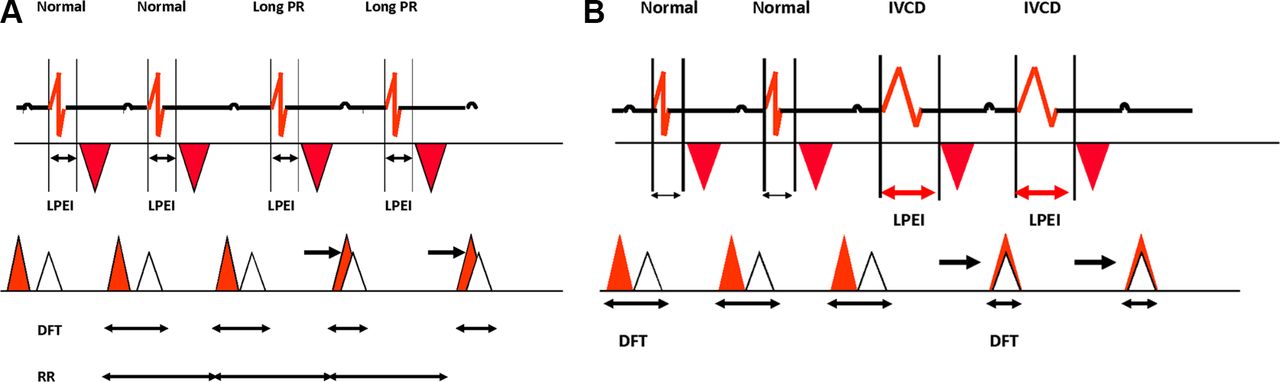
The model was first proposed in 20006 to simplify understanding of the three-dimensional complexity of dyssynchronised cardiac function. It evaluates dyssynchrony at three successive levels: the atrioventricular (AV), interventricular (interV) and intraventricular (intraV) levels. All measurements are expressed in ms. AV dyssynchrony occurs when diastolic ventricular filling time (DFT), measured by pulsed Doppler between the onset of the E wave and end of the A wave and normalised as a percentage of the cardiac cycle (DFT%), is reduced. It applies only in sinus rhythm and results either from an abnormal delay between the end of atrial systole and onset of ventricular systole in case of long PR interval or from prolonged abnormal intraventricular conduction (figure 1A,B). It results from delayed early passive ventricular filling flow (E wave) sometimes superimposed on or fused with active atrial systole flow (A wave). The normal value at rest should always exceed 50% of the cardiac cycle so the ratio of DFT to systole duration (SD) DFT/SD should exceed 1. Dual chamber pacing with AV delay optimisation is able to improve AV dyssynchrony7 due to long PR intervals, but generally aggravates intraV dyssynchrony.1

(A) AV dyssynchrony due to long PR. Aortic ejection and left diastolic filling flows timings represented according to the ECG tracing. Observe the fusion between the protodiastolic E wave with the atrial contribution A leading to filling duration decrease. (B) AV dyssynchrony due to intraV dyssynchrony. Same reduction in filling phase duration phenomenon as observed above but due to delayed timing of aortic ejection flow because of prolongation of LPEI. AV, atrioventricular; DFT, diastolic filling time; intraV, intraventricular; LPEI, left pre-ejection interval.
InterV dyssynchrony is defined empirically when IVD=LPEI–RPEI exceeds 40 ms. LPEI and RPEI are measured by pulse wave Doppler from the onset of the QRS complex and, respectively, the onset of aortic and pulmonary ejection flows. IVD may increase with isolated prolonged LPEI >100 ms and sometimes with both prolonged LPEI and RPEI (normally <100 ms). In cases of comparable prolongation of LPEI and RPEI, IVD remains normal despite significant intraV dyssynchrony.
IntraV dyssynchrony is assessed by measurement of prolongation of LPEI and locally by measuring the duration of persisting contraction of either the septum or the left lateral wall (LLW) after closure of the aortic valve. In the present work, duration of this diastolic contraction (DC) was measured and recorded using a four-chamber apical view in colour M-mode at the septal level (DCSept) and the LLW level (DCLLW). When DC exceeds the timing of the onset of the next E wave (QRS-E), an overlap duration (in ms) is then measured between the onset of the E wave and the end of the contracting segment (Overlap Sept and/or Overlap LLW). DC and overlap focus on the existence of at least one segment that is not temporally synchronised in the systole–diastole cycle. The absolute value of the difference between the septal (Sept) and the lateral wall (LLW) contractions, Sept-LLW was then calculated. Sept-LLW is generally believed by caregivers to be a major intraV dyssynchrony parameter and cut-off values, varying from 65 to 90 ms, for selecting candidates for CRT have been suggested in the past.8 However, similar prolongation of DCSept and DCLLW gives a normal Sept-LLW value despite major IntraV dyssynchrony.
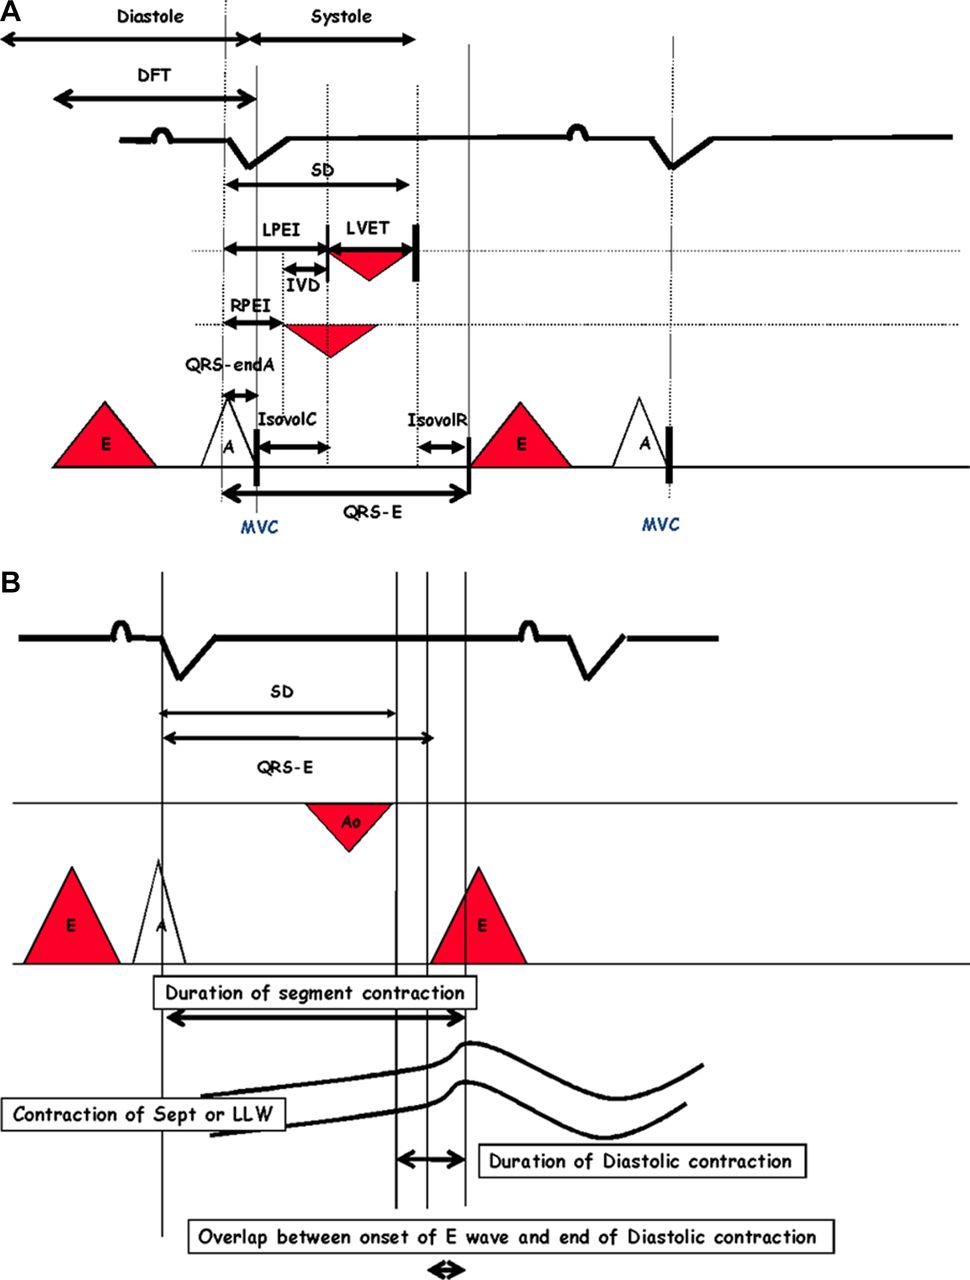
All other variables of the model are standard, directly measured or calculated, echodoppler electromechanical parameters. LV ejection time (LVET) is measured from the opening and closure of aortic valve and the ratio LPEI/LVET is calculated. Total systole duration (SD) is the sum of LPEI and LVET. Isovolumic contraction (IsovolCT) and relaxation (IsovolRT) times are measured. Mitral valve regurgitation (MVR) is expressed in colour Doppler in a four-chamber apical view as the ratio of the area of the flow to left atrial (LA) area (MVR/LA). In total, 18 quantitative or qualitative parameters were studied, and these are listed in table 1; figure 2 depicts the relationships between the different variables during the cardiac cycle.
Ideal direction of variation for each dyssynchrony parameter

(A) AV and interV synchrony: description of the variables of the model. (B) IntraV dyssynchrony parameters. AV, atrioventricular; DFT, diastolic filling time; interV, interventricular; intraV, intraventricular; IVD, interventricular delay; IsovolCT, isovolumic contraction time; IsovolRT, isovolumic relaxation time; LLW, left lateral wall; LPEI, left pre-ejection interval; LVET, left ventricular ejection time; MVC, mitral valve closure; RPEI, right pre-ejection interval; SD, systole duration; Sept, septal.
Materials
Evaluation of the potential value of these different parameters was performed using data from the Evaluation of a METhod based on cardiac intervals measurEment to Optimize right ventricular lead(s) implantation in candidates for ventricular Resynchronisation (METEOR) study.9 This pilot evaluation included 91 CRT candidates who underwent a complete echocardiographic evaluation of dyssynchrony–resynchrony during implant in a four-chamber apical view (Vivid 7, General Electric Medical Systems, Horten, Norway) equipped with a 3.5-MHz phased-array transducer. All data were digitally stored for postprocessing offline (EchoPAC, V.7.0, GE Ultrasound, Horten, Norway). Different non-randomised pacing configurations were tested at a constant heart rate, including baseline, standard right ventricular (RV) pacing, left ventricular (LV) pacing, standard biventricular (BIV) configuration, BIV pacing after optimisation of RV lead placement and sometimes triple site stimulation with two RV leads and one LV lead. The process was based on LPEI shortening of at least 10 ms, an objective reached in 80% of patients at which time the procedure was stopped. Results showed a good feasibility of intraoperative echocardiographic guidance of lead(s) placement and number and acutely improved LV synchrony compared with standard BIV stimulation. Each patient then had several pacing configurations tested, that is, different configurations of dyssynchrony–resynchrony. Four hundred and fifty-five different sets of 18 parameters were obtained. The objective of the present analysis was to evaluate the potential correlations that may exist between the different parameters. The METEOR study,9 whose data are the basis of this analysis, complied with the Declaration of Helsinki. Informed consent was obtained from all subjects.
Statistics
Parameter correlations
All parameters were evaluated two by two with a Pearson correlation test and its associated p value. The Pearson test was conducted using the Python SciPy stat module V.0.14.0.10 A p value <0.001 was considered significant.
When a correlation was significant, the sign (+ or −) indicated whether parameters changed in the same or opposite direction. The ideal direction of variation for each parameter is shown in table 1.
The most influential variable was defined as the one that had the biggest number of favourable correlations with other parameters and thus the capacity to drive resynchrony.
Variance-based selection of the variables
As certain variables are calculated from others or strongly suspected to be correlated (eg, DFT% and SD), it was hypothesised that the observation of a few well-chosen variables, carefully picked from different highly correlated subsets of variables should reflect most of the information of the data set. Due to the complexity of the dyssynchrony phenomenon, it was also anticipated that no single variable would alone describe the model. In order to find the best variables to represent the maximum number of others, we used the Column Subset Selection method of machine learning.11
For every number K between 1 and 17, we determined the set of K variables that allowed the estimation of the remaining variables with maximum confidence. The variables were assumed to be Gaussian, which enabled us to implement the procedure defined,11 12 with slight variations, as we considered all possible initializations.
We then repeated the following process for each of the 18 variables. Starting from a set containing a single variable, we computed the conditional variance of the 17 remaining ones. We then looked for the variable among these remaining ones that led to the biggest decrease in the conditional variance of the non-selected ones and included it in our set. We repeated the process until there were no variables left.
This simple procedure allowed us to choose the best groups of variables for every size of subset between 1 and 17. For instance, if the objective was to choose the three best variables to explain all the others, using this procedure gives 18 groups of three variables to choose from (each of these groups corresponds to a different starting variable in the above procedure).
Results
Determination of the variable ‘most correlated’ to the others
Results of the Pearson correlation are shown in table 2. ‘X’ in the table corresponds to non-significant correlations according to p value.
Pearson correlation coefficients
LPEI has the highest number of significant correlations and improves in combination with 13 other variables. When LPEI decreases (improves), all other correlated parameters decrease (improve) except for LVET and DFT%, which increase (improve). LPEI is not correlated to DC and Overlap of LLW but is correlated with Sept and LLW contractions, DCSept, Overlap Sept, IVD, IsovolCT, RPEI, LPEI/LVET and mitral valve regurgitation.
LPEI/LVET comes in second place and was correlated with 12 other parameters and improved in combination with them.
Sept-LLW difference is only correlated with five parameters derived from durations of septum and LLW contractions and also total systole duration (SD), with no correlations with other parameters. Furthermore, when Sept-LLW difference decreases, total duration of LLW contraction, DC and Overlap of LLW increase (deteriorate).
Filling duration (DFT%) is only correlated with four variables: LPEI, IsovolCT, LVET and LPEI/LVET. No correlations were found with septum and LLW contractions.
IVD is only positively correlated to LPEI, IsovolCT and LPEI/LVET and negatively to RPEI, confirming the two ways to decrease IVD; one by decreasing LPEI, the other by increasing RPEI.
Variance-based selection of the variables
No variable alone (K=1) was completely able to capture dyssynchrony. According to captured variance, variables are ranked in decreasing order. Sept captures 25%, DCSept 23%, Overlap Sept 23%, Sept-LLW 23%, SD 19%, QRS-E 19%, LPEI 17%, LLW 16%, LVET 15%, Overlap LLW 15%, DCLLW 15%, LPEI/LVET 15%, IVD 11%, RPEI 10%, IsovolCT 10%, DFT% 9%, IsovolRT 8% and MVR/LA 7%. The ‘best’ was therefore Sept, with a disappointing result of 25% of the variance of the data set. LPEI alone only captured 17%, and the worst was mitral regurgitation with 7%.
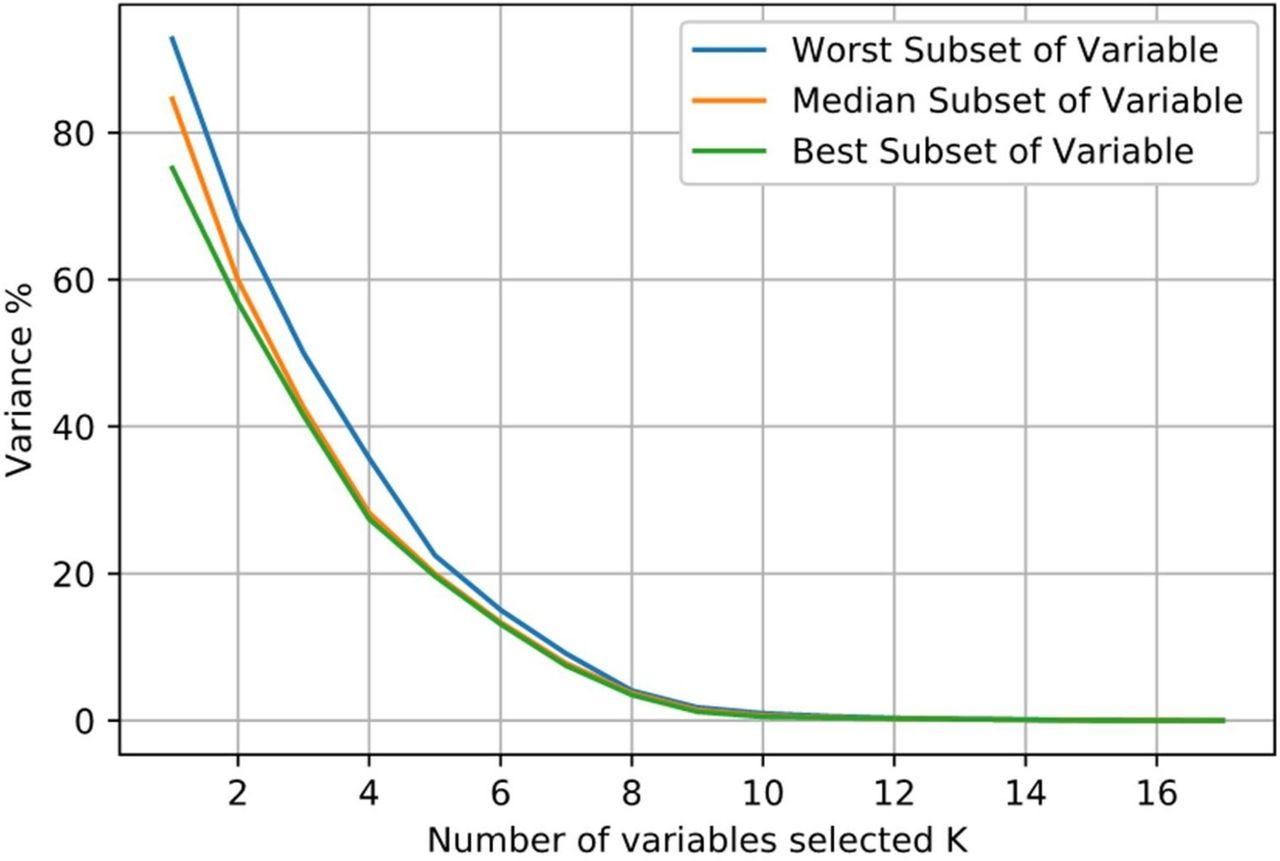
Figure 3 represents the variance associated with the best, median and worst subsets of the 18 different groups. From 1 to 18 variables, the three curves started from different values of captured variance then progressively converged when K reached 8. For K=3, the best set captured 59% of the variance. For K>8, all subgroups captured almost 95% of the variance. For K=10, 100% of variance was captured.

Variance not captured by the K selected variables in the best, median and worst cases. The x axis represents the number of selected variables (K), the y axis shows the percentage of variance not captured by these K variables. For each number of selected variables, the algorithm computed 18 groups of variables, corresponding to the 18 initially selected variables. For each K, the best set is represented in green, the median in orange and the worst in blue. As an example, for K=2, the blue line shows that the best set captures more or less 40% of the variance of the dataset.
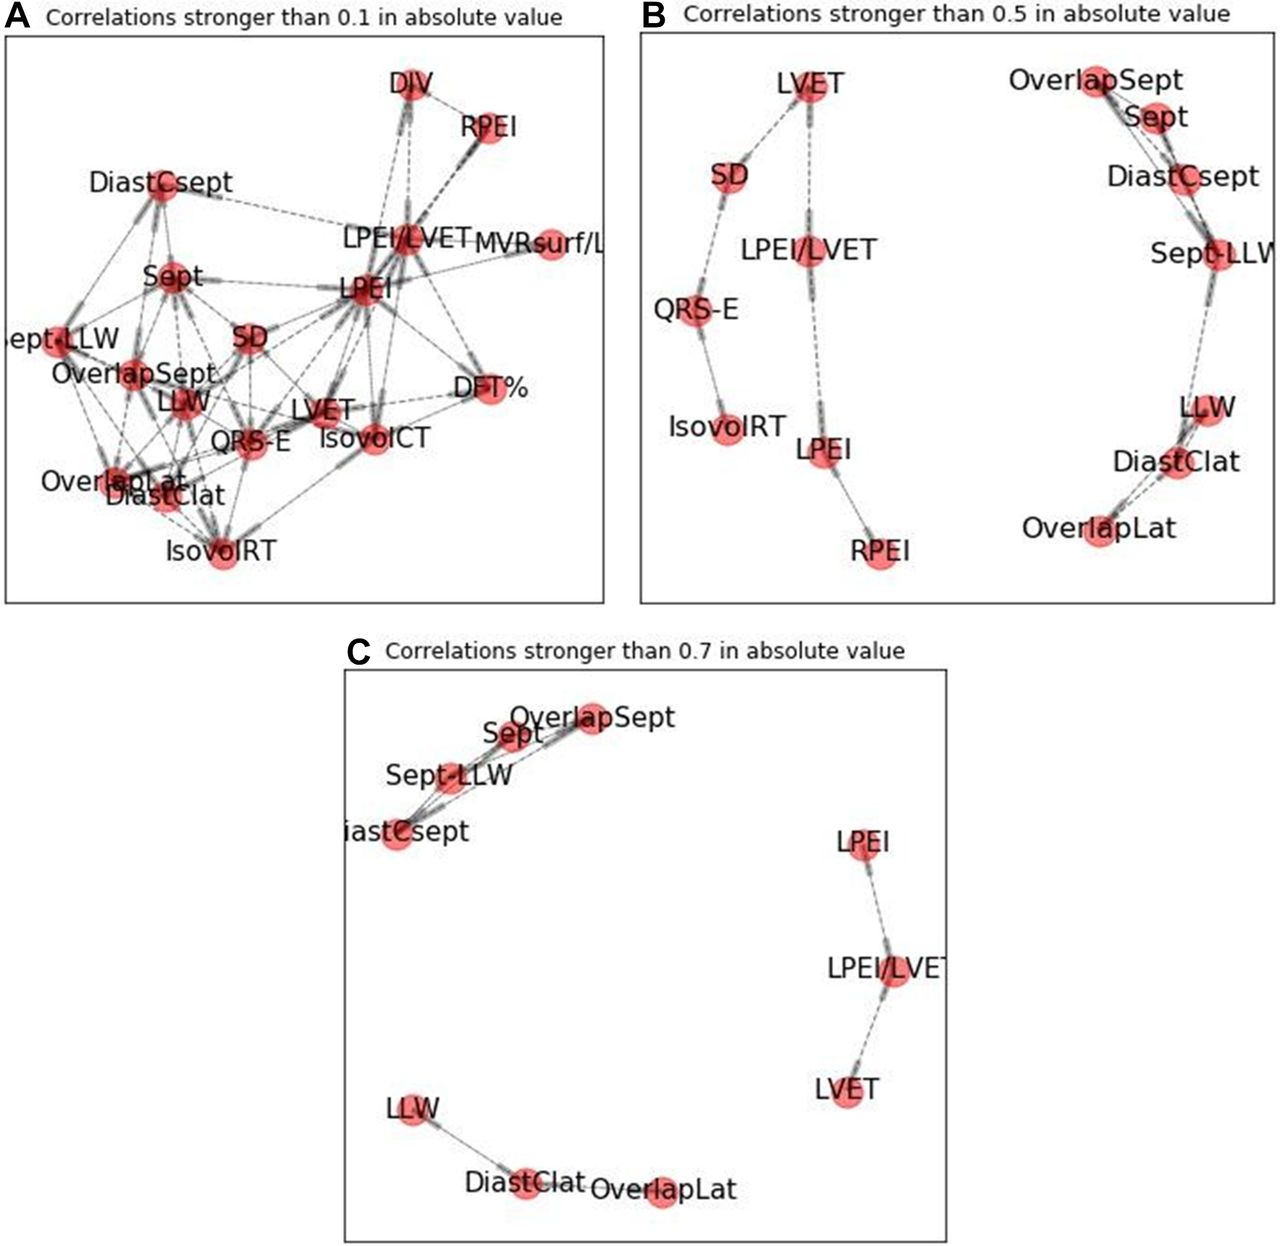
Table 3 shows different subgroups of variables for K=3, 4, 6. For low values of K, the choice of selected variables is more important than for higher values of K. This pattern occurs because selected variables tend to come from different subgroups of highly correlated variables as shown in figure 4.
Obtaining similar performance from totally different sets of variables because captured variance is similar
Different levels of correlation between electromechanical parameters. Each set of electromechanical parameters represents the correlations between these parameters at different levels of correlation (0,1; 0,5; 0,7). Increasing correlation defines different subgroups of variables. The last panel (C) shows three subgroups of highly correlated variables, in which one variable can describe the others in the subgroup. DFT, diastolic filling time; IsovolCT, isovolumic contraction time; IsovolRT, isovolumic relaxation time; LLW, left lateral wall; LPEI, left pre-ejection interval; LVET, left ventricular ejection time; MVR, mitral valve regurgitation; RPEI, right pre-ejection interval; SD, systole duration; Sept, septal.
Discussion
Statistics
The objectives of the analysis were to rank each of the 18 parameters in the METEOR study in terms of potential interaction with the others, to calculate the minimum number of parameters necessary to describe a dyssynchrony model and, if possible, to determine which variable(s) favourably drive resynchrony in the maximum number of others.
The high level of noise in the data set made any rank-based analysis, such as Spearman and Kendall-tau correlations, too complex. We therefore chose to use Pearson’s correlation with a p value threshold of 0.001. To determine the minimum number of variables, we used the method of best subset of columns. As the number of variables is small, a full on greedy approach was possible to solve the column subset selection problem and find the optimal solution for each number of variables considered for selection. Other methods approximating the optimal solution were not needed as the number of variables was <1000. Despite it not being required, we adopted the Gaussian hypothesis for the studied variables because it enabled us to minimise the conditional variance of the remaining variables. As the CIs given by the Gaussian framework held true in 95% of cases, we believed it appropriate for the study.
For determining variables that favourably influenced the maximum number of others, the Pearson correlation coefficients appeared to be the simplest. With this methodology, LPEI is the best variable in terms of number of favourably correlated variables with a threshold of 0.001.
Clinical consequences
Dyssynchrony evaluation
A lot of different mechanical criteria of dyssynchrony have been proposed since the beginning of CRT and been shown to be useless, including two-dimensional strain.3 4 The present model, whose parameters have been used in various studies13 but which has never been studied per se, was proposed in 2000. The present work for the first time explores the different correlations that exist between this model’s parameters and confirms that they are all correlated with at least one other parameter. PROSPECT authors felt this to be the case.3 Observation of low (but highly significant) correlations confirms that no single electromechanical parameter can ‘fully describe’ dyssynchrony. Surprisingly, the ‘best’ variable is septal contraction duration (Sept) and not lateral wall duration, which is usually thought to be more representative of dyssynchrony and is the usual target for resynchrony in daily practice.
According to the results, a subset of eight variables out of 18 is necessary to fully describe dyssynchrony (figure 3), although three variables selected from separate groups (figure 4) might be enough to describe almost 60% of the whole model, which seems to be the minimum acceptable. The three most popular parameters (DFT%, LPEI and IVD) studied in the PROSPECT trial,3 unfortunately describe only 35% of the variance of dyssynchrony. The best set when using 3 out of the 18 parameters of the model are: Sept, Sept-LLW and QRS-E, which give a result of 59%.
In the DESychronisation as an Indication for REsynchronisation study (DESIRE),14 the model was used to discriminate mechanically dyssynchronised narrow QRS patients (120 ms) presenting at least, reduced DFT%, prolonged LPEI, IVD and/or DCLLW from patients without any of these criteria. A trend towards a more favourable long-term outcome after implant was observed in the ‘dyssynchronised’ group. According to the present analysis, these four variables only describes 49% of the variance and a better choice of four would probably have been: Sept, Sept-LLW, QRS-E, LPEI/LVET, which describe 73% of dyssynchrony variance, although Sept and Sept-LLW are not the easiest parameters to measure.
The present study therefore confirms the complexity of dyssynchrony, which needs at least eight variables for full description. This will not encourage electrophysiologists to abandon ECG criteria, despite their low value for dyssynchrony and resynchrony evaluation.
Resynchrony
Nevertheless, it is one thing to describe dyssynchrony, and another more important thing to predict resynchrony. In this regard, the ‘best’ parameter seems to be LPEI. Compared with other parameters, LPEI correlates with a maximum of other variables, and its decrease (favourable) is associated with favourable evolution (increase or decrease) of the correlated variables. The present analysis is not able to determine any cut-off value, but suggests that obtaining any significant decrease in LPEI after implant gives the theoretical chance of improving a maximum of other variables. This probably explains why, in the METEOR study, whose data are the basis of the present analysis, pursuing the objective of reducing LPEI by at least 10 ms during implantation led to a statistically significant increase in diastolic filling duration and IVD reduction without any AV or VV interval optimisation. Prospective evaluation of LPEI reduction value in the postoperative course, in association or not with other criteria such as QRS width, is necessary before using this parameter as a reliable criterion for effective CRT delivery.
Conversely, correlations suggest that modifying Sept-LLW difference (calculated from their duration of contractions) has no impact on filling duration, LPEI, LVET, IsovolCT or IVD. This parameter, which is the most popular dyssynchrony marker, only has a very low positive correlation with systole duration and unfortunately a statistically negative correlation with LLW contraction duration, despite its clinical efficacy as suggested by Cardiac Resynchronisation in Heart Failure.15 This means that acutely reducing Sept-LLW risks increasing (deteriorating) LLW contraction. It also has no impact on LPEI/LVET, an old ratio used by haemodynamicians in an era before echo. This ratio is correlated with cardiac output and EF.16 Targeting a decrease in Sept-LLW, as has been suggested so many times in the past, really seems questionable as an objective for optimal delivery of CRT. This point may contribute explain the sustained 30% rate of non-response with CRT since its introduction.
Another traditional objective in CRT is targeting the last activated segment. The Targeted Left Ventricular Lead Placement to Guide Cardiac Resynchronization Therapy (TARGET) study17 confirmed that the LLW was latest in only 30% of patients and showed an improved response rate in patients implanted under echo speckle-tracking guidance of LV lead placement compared with traditional implant. At 6 months, the response rate was 70% compared with 55% in non-optimised patients with a low statistical significance (p=0.031). Despite this difference, the response rate of this optimised procedure remains comparable to traditional results. This might be explained by the present analysis, showing a low ability of either the septum or the LLW alone to describe dyssynchrony and also a lower value than LPEI for expecting effective resynchrony.
Finally, according to the present analysis, use of the duration of filling phase (DFT%) as a driver for optimising CRT delivery leads to disappointment. DFT% was found to have no correlations with the majority of systolic parameters. This point may contribute to explain the absence of clear clinical benefit in recently published trials from AV delay optimisation to increase filling duration compared with the absence of optimisation.18–20
Conclusion
The results of the present analysis show that no single electromechanical parameter can describe dyssynchrony. A minimum of eight parameters is required to completely describe dyssynchrony, although three or four carefully selected parameters from different groups may be enough in routine practice, maybe selected by artificial intelligence. Among the classic parameters used for dyssynchrony–resynchrony evaluation (Sept-LLW, DFT%, LPEI and IVD), only LPEI—despite a low individual value for describing dyssynchrony—seems valuable for assessing resynchrony, as it is correlated with a maximum number of other variables and is the only parameter whose favourable evolution is associated with the favourable evolution of the others. This point deserves prospective evaluation for validation.
Acknowledgments
The authors wish to thank Anne Rousseau-Plasse, PhD, and John Plant, BPharm, for their editorial support.
References
Footnotes
Contributors SC is responsible for the overall content. SC, MT and JR contributed to the reporting and analysis of the work described. SC and PR contributed to the planning and conduct of the work.
Competing interests SC is presently the Chief Medical Officer of MicroPort CRM.
Patient consent for publication Not required.
Ethics approval Ethics Committee of Clinique Bizet, Groupe Hospitalier Paris Saint-Joseph.
Provenance and peer review Not commissioned; externally peer reviewed.
Data sharing statement No additional data are available.