Article Text

Abstract
Aims Cardiac resynchronisation therapy (CRT) is effective treatment for selected patients with heart failure (HF) but has ~30% non-response rate. We evaluated whether specific biomarkers can predict outcome.
Methods A prospective single-centre pilot study of consecutive unselected patients undergoing CRT for HF between November 2013 and December 2015 evaluating cardiac extracellular matrix biomarkers and micro-ribonucleic acid (miRNA) expression before and after CRT assessing ability to predict functional response and survival. Each underwent three assessments (pre-implant, 6 weeks and 6 months postimplant) including: New York Heart Association (NYHA) class, echocardiography, electrocardiography, 6 min walk test (6MWT), Minnesota Living with Heart Failure Questionnaire (MLHFQ) and N-terminal pro-brain natriuretic peptide (NT-pro-BNP). Plasma markers of cardiac fibrosis assessed were: N-terminal pro-peptides of collagen I and III, collagen I C-terminal telopeptides (CTx) and matrix metalloproteinases (MMP-2 and MMP-9) as well as a panel of miRNAs (miRNA-21, miRNA-30d, miRNA-122, miRNA-133a, miRNA-210 and miRNA-486).
Results A total of 52 patients were recruited; mean age (±SD) was 72.4±9.4 years; male=43 (82.7%), ischaemic aetiology=30 (57.7%), mean QRS duration=166.4±23.5 ms, left bundle branch block (LBBB) morphology = 39 (75.0%), mean NYHA=2.7±0.6, 6MWT=238.8±130.6 m, MLHFQ=46.4±21.3 and left ventricular ejection fraction (LVEF)=24.3%±8.0%. Mean follow-up=1.7±0.3 and 5.8±0.7 months. There were 27 (55.1%) functional responders (3 no definable 6-month response; 2 missed assessments and 1 long-term lead displacement). No marker predicted response, however, CTx and LBBB trended most towards predicting functional response.
Conclusion No specific biomarkers reached significance for predicting functional response to CRT. CTx showed a trend towards predicting response and warrants further study.
Trial registration number NCT02541773.
- heart failure
- cardiac resynchronization therapy
- non-response
- vascular biomarkers
- micro-RNAs
This is an open access article distributed in accordance with the Creative Commons Attribution Non Commercial (CC BY-NC 4.0) license, which permits others to distribute, remix, adapt, build upon this work non-commercially, and license their derivative works on different terms, provided the original work is properly cited, appropriate credit is given, any changes made indicated, and the use is non-commercial. See: http://creativecommons.org/licenses/by-nc/4.0/
Statistics from Altmetric.com
Key questions
What is already known?
Cardiac resynchronisation therapy (CRT) continues to have a 30% non-response rate.
Maladaptive processes of neurohumoral activation and cardiac extracellular matrix remodelling are central to development and progression of heart failure (HF).
What does this study add?
First prospective pilot study to evaluate cardiac fibrosis biomarkers and specific dysregulated micro-RNA in patients with HF undergoing CRT.
Selected baseline biomarkers and clinical variables did not demonstrate any ability to predict functional response, although C-terminal telopeptides (and left bundle branch block) trended towards significance.
Levels of N-terminal pro-peptides of collagen I and miR-122 following CRT were shown to vary significantly between responders and non-responders.
Expression over time in both groups was shown to alter for matrixmetalloproteinase (MMP)-2, MMP-9 and high-sensitivity Troponin-T.
How might this impact clinic practice?
Knowledge of circulating vascular biomarker in patients with HF undergoing CRT may help in better understanding the underlying mechanisms of CRT.
Use of vascular biomarkers to predict CRT response could have an impact on the significant non-response rate seen in CRT patients. This has clinical and financial implications for healthcare systems worldwide.
Introduction
Heart failure with reduced ejection fraction (HFrEF) is characterised by adverse cardiac remodelling with progressive reduction in left ventricular (LV) ejection fraction and poor cardiovascular outcomes.1 Cardiac resynchronisation therapy (CRT) has revolutionised management by reducing mortality and morbidity1 with reverse cardiac remodelling induced by CRT. Unfortunately, CRT non-response occurs in 20%–40% of patients despite meeting implant criteria.1 Maladaptive processes of neurohumoral activation, cardiac extracellular matrix (ECM) remodelling, proinflammatory changes and myocardial wall stress are central to development and progression of HFrEF.2 Altered ECM turnover in HFrEF is directly associated with adverse cardiac remodelling3 and biomarkers of collagen synthesis (N-terminal pro-peptides of collagen I (PINP), carboxy-terminal pro peptide of procollagen type 1 (PICP) and N-terminal pro-peptides of collagen III (PIIINP)) and degradation (cross linked carboxy-telopeptide of type 1 collagen (ICTP) or carboxy-terminal telopeptide of collagen 1 (CITP)) have been shown to be associated with poor heart failure (HF) outcomes. As key regulators of ECM turnover, matrix metalloproteinases (MMP-2 and MMP-9) have been implicated as biomarkers of HF diagnosis and prognosis.4 Growth Differentiation Factor-15 (GDF-15) is a member of the transforming growth factor-β cytokine superfamily involved in regulation of cell survival, proliferation and differentiation that is associated with poor HF outcomes and has been suggested as a predictor of CRT response.5
Micro-ribonucleic acids (miRNAs) are short (20–22 nucleotides) endogenous non-coding ribonucleic acids and are key regulators of gene expression, including within the cardiovascular system;6 miRNAs are readily measured in blood and several circulating miRNAs have been shown to be dysregulated in cardiovascular disease, suggesting potential use as biomarkers.6 7Specifically, miR-21,8 miR-30d,9 miR-1228, miR-133a,6 and miR-2106 are dysregulated in adverse cardiac remodelling and HFrEF.
Markers of collagen turnover have previously been studied to establish their value as predictors of CRT response, but outcomes have thus far been inconsistent;4 miRNAs are novel biomarkers with variation reported in HFrEF,6 but limited information is available on their ability to predict CRT response.7 9 Our aim was to characterise biomarkers of ECM remodelling and established dysregulated miRNAs before and after CRT to assess whether they predict CRT response and survival.
Methods
The COVERT-HF study was a prospective study of unselected patients with HFrEF undergoing CRT at a single tertiary centre between November 2013 and June 2015. The trial was registered at clinicaltrials.gov (reference NCT02541773). Participants were eligible if they met National Institute of Clinical Excellence (NICE)10 criteria for CRT. Patients with atrial fibrillation or those requiring CRT-upgrade were included to reflect real-world practice.10 Patients were excluded if they had a recent acute coronary syndrome or acute HF decompensation (<6 weeks), end-stage renal disease (on renal replacement therapy), significant cognitive impairment or terminal illness (expected survival<1 year). Postimplantation exclusions were applied in case of procedure failure or complications resulting in unsuccessful CRT pacing (eg, lead displacement/phrenic nerve pacing). Each participant underwent a preimplantation visit and two follow-ups at 6 weeks and 6 months postimplant. Participants had NewYork Heart Association (NYHA) class assessment, 6 min walk test (6MWT), Minnesota Living with Heart-Failure Questionnaire (MLHFQ), transthoracic echocardiography, resting 12-lead electrocardiography (ECG) and blood sampling at all attendances. All provided written informed consent. The study was conducted in accordance with the Declaration of Helsinki.
Study outcomes
The primary outcome measure was functional response status. Functional responders were defined as those who survived, did not undergo heart transplantation and achieved two of three response criteria (↓>1 NYHA, ↑>10% 6MWT distance, ↓MLHFQ score>5) at 6 months follow-up. Secondary outcomes were: echocardiographic response (defined as >15% reduction in LV end-systolic volume at 6 months) and major adverse cardiovascular events (MACE) defined as a composite of all-cause mortality and first HF hospitalisation.
Device implantation
All elective implantations were performed as day-cases as previously reported.11
Transthoracic echocardiography
All underwent transthoracic echocardiography (Vivid 7, GE Healthcare, Horten, Norway) for LV volumetric assessment performed on the same machine by the same nationally accredited operator for each study visit. All measurements were analysed offline (EchoPac, GE Healthcare, Horten, Norway). LV ejection fraction was estimated using the biplane modified Simpsons method.12 A blinded inter-rater study was conducted on a randomly selected 20% of study participants. The inter-rater study for available comparative measures demonstrated strong correlation between rater measurements (r2=0.90, p<0.01). Paired measurements were not significantly different between both raters when compared with paired t-test (p=0.90). Bland-Altman limits of agreement were calculated to be 20.7%.
Blood sampling and laboratory analysis
Peripheral venous sampling of blood was performed following 2 hours of fasting and 1 hour of rest, using EDTA as anticoagulant. Serum and plasma were prepared by single centrifugation at 3500 RPM for 10 min, followed by storage at −80°C until analysis. Preimplant peripheral samples were taken the morning of implant. Coronary sinus sampling was performed in half the cohort (n=26) during CRT implantation on cannulation of the coronary sinus. Clinical laboratory measurements were performed according to standard hospital procedure. Electrochemiluminescence Immunoassay analysis (Cobas, Roche Diagnostics, Basel, Switzerland) for N-terminal pro-brain natriuretic peptide (NT-pro-BNP) and high-sensitivity Troponin-T (hs-TnT) were performed. Plasma levels PINP and C-terminal telopeptides (CTx) were determined using an ECLIA Cobas 8000 modular analyser (Roche Diagnostics, Basel, Switzerland). The immunoassays interassay and intra-assay precision for PINP was <3.0%, and for CTx was <2.5%. The assays manufacturer calculated measures and were locally validated according to the validated international Clinical and Laboratory Standards Institute EP05-A3 protocol. Sandwich ELISAs were used to determine plasma levels of GDF-15, MMP-2 and MMP-9 (R&D Systems, Minneapolis, Minnesota, USA) and PIIINP (Cusabio, Wuhan, Hubei, China) according to manufacturers’ protocol. The interassay and intra-assay coefficient of variability was calculated for each assay: GDF-15 (7.7% and <4.8%); MMP-2 (4.5% and <5.6%); MMP-9 (10.3% and <12.9%); PIIINP (5.1% and <7.2%).
MiRNA profiling was specifically undertaken for miR-218, miR-30d,9 miR-1228, miR-133a,6 and miR-2106 due to their previously reported dysregulation in HFrEF. MiR-486 was also profiled and used as a marker for sample quality for haemolysis as it is highly enriched in erythrocytes.13 Profiling was performed using previously described methods.14 Total RNA, including small RNA, was extracted from 100 µl of plasma using the miRNeasy Mini kit (Qiagen, Hilden, Germany). An exogenous miRNA (cel-miR-39-3 p) was spiked in to the plasma at the start of the extraction procedure to serve as a normalisation control. MiRNAs were reverse-transcribed using the TaqMan MicroRNA Reverse Transcription Kit and RT Megaplex Primer pools (Human Pools A V.2.1 and B V.2.0, Applied Biosystems, Darmstadt, Germany) and further amplified using TaqMan PreAmp Master Mix and Megaplex PreAmp Primers (Primers A V.2.1 and B V.2.0, Life Technologies, Massachusetts, USA). TaqMan miRNA assays (Applied Biosystems) and TaqMan Universal PCR Master Mix, AmpErase UNG were used for quantitative real-time PCR (qPCR) of specified miRNAs on a ViiA7 Real-Time PCR System (Life Technologies) at 50°C for 2 min, 95°C for 10 min, followed by 40 cycles of 95°C for 15 s and 60°C for 1 min. Relative quantification was performed using the 2-ΔΔCt method.15 Haemolytic samples were excluded from the analysis. Every patient had three sets of samples taken at each time point (unless they died at follow-up) and all samples were available for analysis.
Statistical analysis
Statistical analysis was performed using Statistical Package for Social Sciences (SPSS), V.22.0 (IBM, Chicago, Illinois, USA). Categorical variables were reported as frequency and percentages. Comparison analyses for categorical data were performed using the χ² or Fisher’s exact tests, dependent on appropriateness. Continuous data underwent histogram plots for assessment of normality. Normally distributed data were reported as mean±SD and comparative analysis performed using independent t-tests. Non-normally distributed data were reported as median (full range) and compared using Mann-Whitney U test. Paired continuous data were analysed using paired t-test or Wilcoxon Signal Rank test, as appropriate. Non-normally distributed ECM biomarkers, NT-pro-BNP, GDF-15 and hs-TnT data were presented unadjusted; however, they were transformed logarithmically for analysis. Fold change was calculated using the mean (responder/non-responders) cohort value when comparing two independent datasets. The fold change for paired data sets was also calculated using matched means (coronary sinus/peripheral). Variation in continuous variables over three time periods was analysed using either one-way analysis of variance (ANOVA) or Friedman test, respectively. Mixed between-within subjects ANOVA was used to compare variation in continuous data in functional responders and non-responders over 6 months. Bivariate correlation analysis with either Pearson (parametric) or Spearman rank (non-parametric) estimators was performed between two continuous variables to explore relationships. Univariate logistic regression analysis was performed for functional response for predefined vascular biomarkers and established clinical variables. Those with p<0.2 were pooled as covariants for multiple logistic regression. A high alpha was set on the basis of the clinical response definition. A stepwise entry method was applied with forward selection and backward elimination. The accuracy of the model was verified with a Hosmer-Lemeshow goodness-of-fit test. P<0.05 was considered statistically significant. Given the limited data in this field, we were unable to perform a power calculation at the start of our study. We, therefore, performed this single-centre pilot study to be able to more accurately predict power for the most prominent biomarkers found enabling a larger multicentre trial to be done. Following completion of our study, we were able to perform a power calculation based on the two most important predictors noted (PINP and CTx). In order to demonstrate a significant difference between baseline concentrations in PINP and CTx as predictors of response (assuming a non-response rate 40%), a sample size of 430 was calculated and assumed an 80% power with significance level of p=0.05.
Results
A total of 58 patients were consented and 52 included in the study (figure 1). Follow-up visits occurred at 1.7±0.3 and 5.7±0.7 months, respectively. There were 27 (59.1%) responders and 22 (44.9%) non-responders after 6 months follow-up.
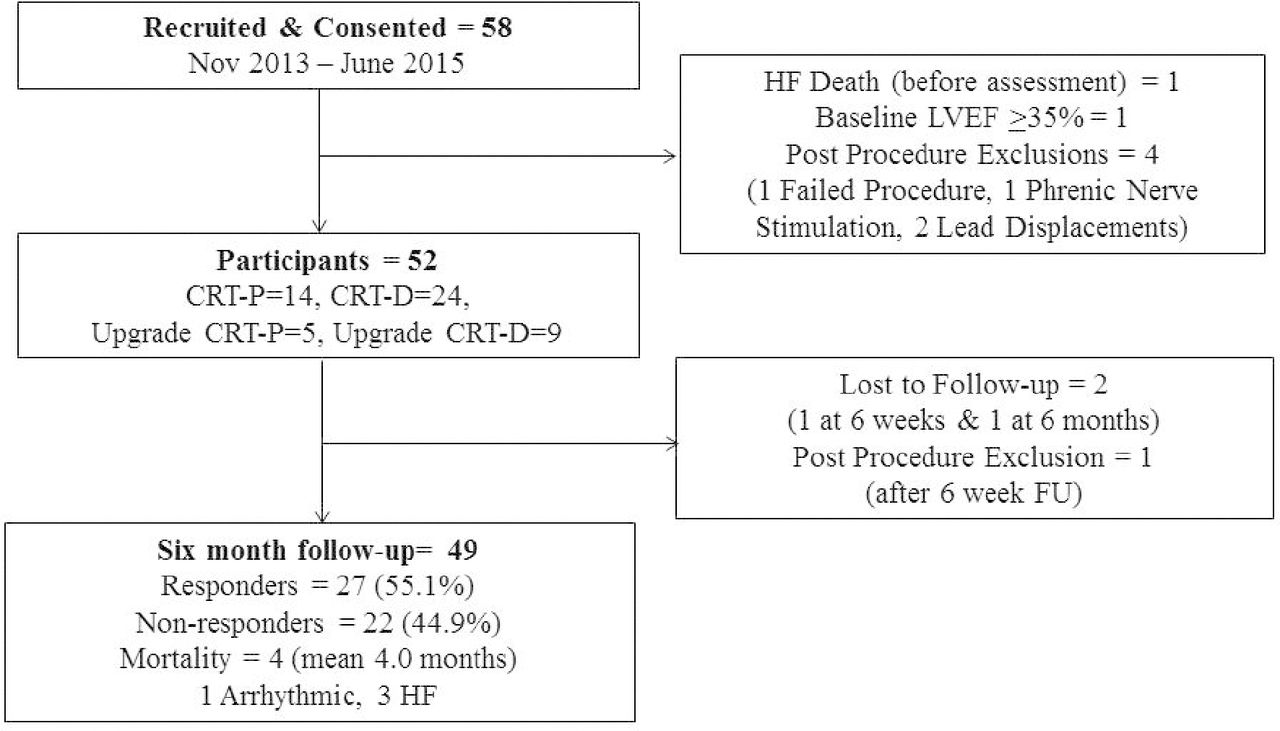
Patient recruitment, flow and outcomes. CRT, cardiac resynchronisation therapy; HF, heart failure.
Baseline clinical characteristics
Baseline characteristics and functional response are shown in table 1. There were 43 (82.7%) males with mean age of 72.4±9.4 years with no significant difference between responders and non-responders; 30 (57.7%) had ischaemic and 22 (42.3%) non-ischaemic aetiology, which did not significantly vary by response status. Median (+range) QRS duration was 164.0 ms (120.0–240.0) and 39 (75.0%) had baseline LBBB. Both QRS duration (168.0 ms vs 159.0 ms, p=0.11) and LBBB morphology (85.2% vs 63.6%, p=0.16) did not vary significantly between responders and non-responders, respectively. There was a trend for wider QRS and presence of LBBB in responders. The three patients lost during follow-up did not change the cohort characteristics.
Baseline cohort characteristics
Baseline biomarker levels
Table 2 shows baseline ECM biomarkers and miRNA for the cohort and by functional response status. There was no significant difference in expression of ECM biomarkers of collagen synthesis or degradation between functional responders and non-responders at baseline. Baseline levels of type I collagen degradation (CTx) were observed to be more highly expressed in responders than non-responders, but did not reach statistical significance (0.48 (0.14–1.14) ug/L vs 0.31 (0.16–0.73) ug/L, p=0.07). The biomarker of myocardial stress, GDF-15, was not demonstrated to have significant variation in expression between responders and non-responders (1.12 (1.12–10.29) ug/L vs 1.20 (2.75–5.95) ug/L, p=0.42). MiRNA biomarker expression profiles did not vary significantly between functional responders and non-responders; however, a trend for changes in miR-133a was observed (fold change 0.65, p=0.08). MiR-486 was found to have no significant difference between responder and non-responders at baseline (fold-change 1.16, p=0.76).
Baseline biomarker levels for functional responders and non-responders
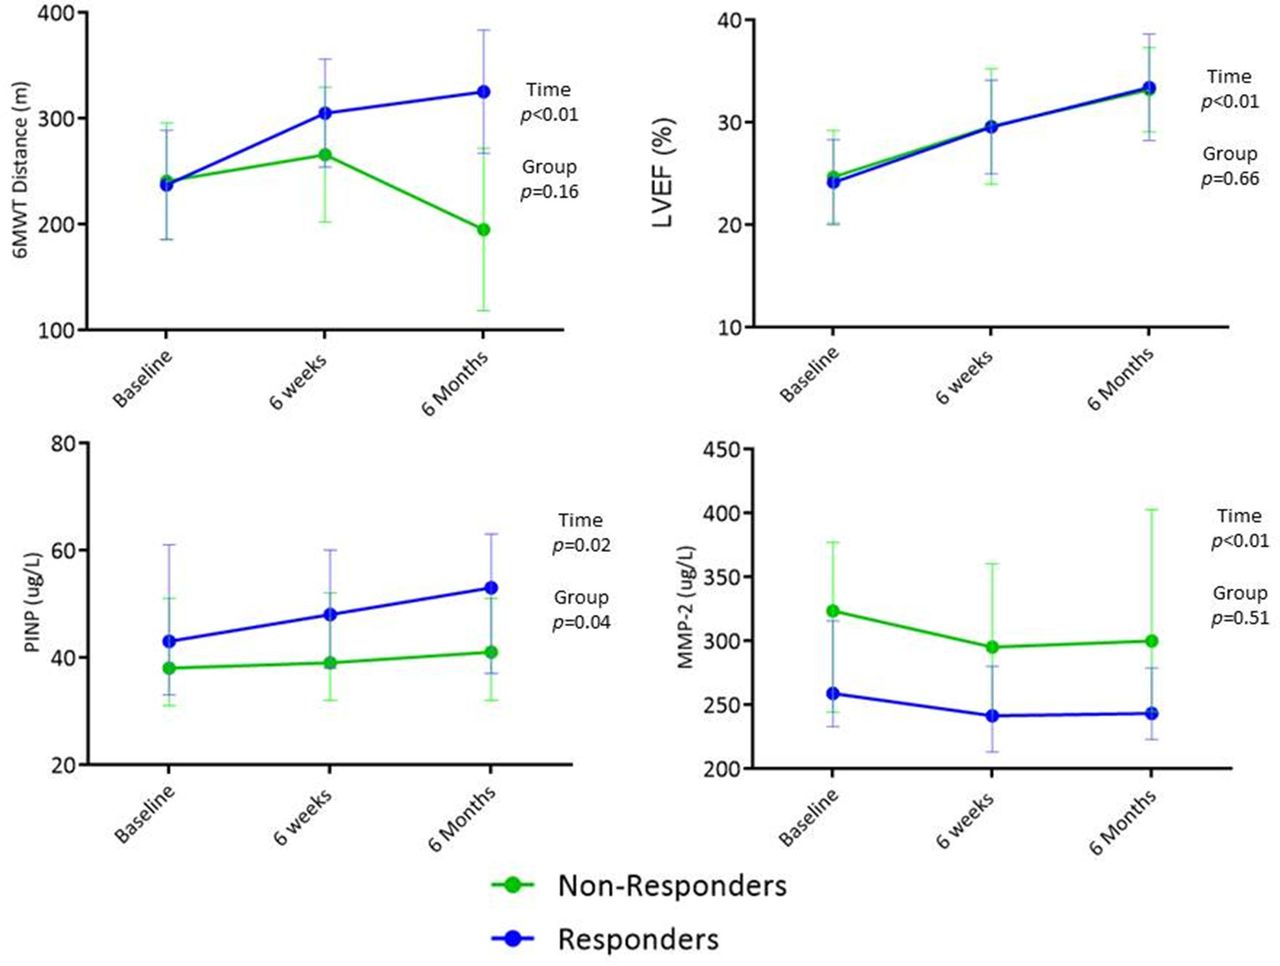
Effects of CRT on cardiac function and biomarker expression
The impact of implanting CRT was examined for functional variables, LV geometry and biomarker expression over 6 months. Trends between functional responders and non-responders were compared. Online supplementary file 1 demonstrates functional variables, LV geometry measurements and biomarker levels at baseline and changes at follow-up. Figure 2 demonstrates the most significant changes in 6MWT, LVEF, PINP and MMP-2 over the period of follow-up for changes over time and between groups. Quality of life scores and left ventricular end systolic volume (LVESV) both improved following CRT implantation for responders and non-responders (p<0.01). MMP-9 had decreased expression in both groups over the follow-up period (p=0.01). MiR-122 (a liver-specific miRNA) was the only miRNA to have significantly higher initial expression in non-responders compared with responders (p=0.03). MiR-486 expression trended towards a significant decrease in expression in both responders and non-responders (p=0.05).
Supplemental material

Trends in functional variables, LV geometry and biomarker expression following CRT implantation in responders and non-responders. Trends represent the mean value of responders or non-responders. Differences over time and between response status were tested. 6MWT and LVEF are presented as mean (95% CI). PINP (ug/L) and MMP-2 (ug/L) are presented as median (CI 95%). CRT, cardiac resynchronisation therapy; LV, left ventricle; MMP-2, matrixmetalloproteinase-2; 6MWT, 6 min walk test; PINP, N-terminal pro-peptides of collagen I.
Correlation between change in biomarker expression and cardiovascular variables following CRT
Correlation analysis was performed for relative change during short/long-term follow-up between prespecified biomarkers and functional parameters, LV geometry measures and NT-pro-BNP. Figure 3 shows the strongest associations found. Further significant associations in short-term relative changes following CRT implantation were noted between LVESV/PIIINP (r=0.39, p=0.04) and NT-pro-BNP/miR-133a (r=−0.34, p=0.03). Additional associations were observed between relative long-term changes in NT-pro-BNP with miR-133a (r=−0.50, p≤<0.01) and MMP-9 (r=−0.32, p=0<0.03).
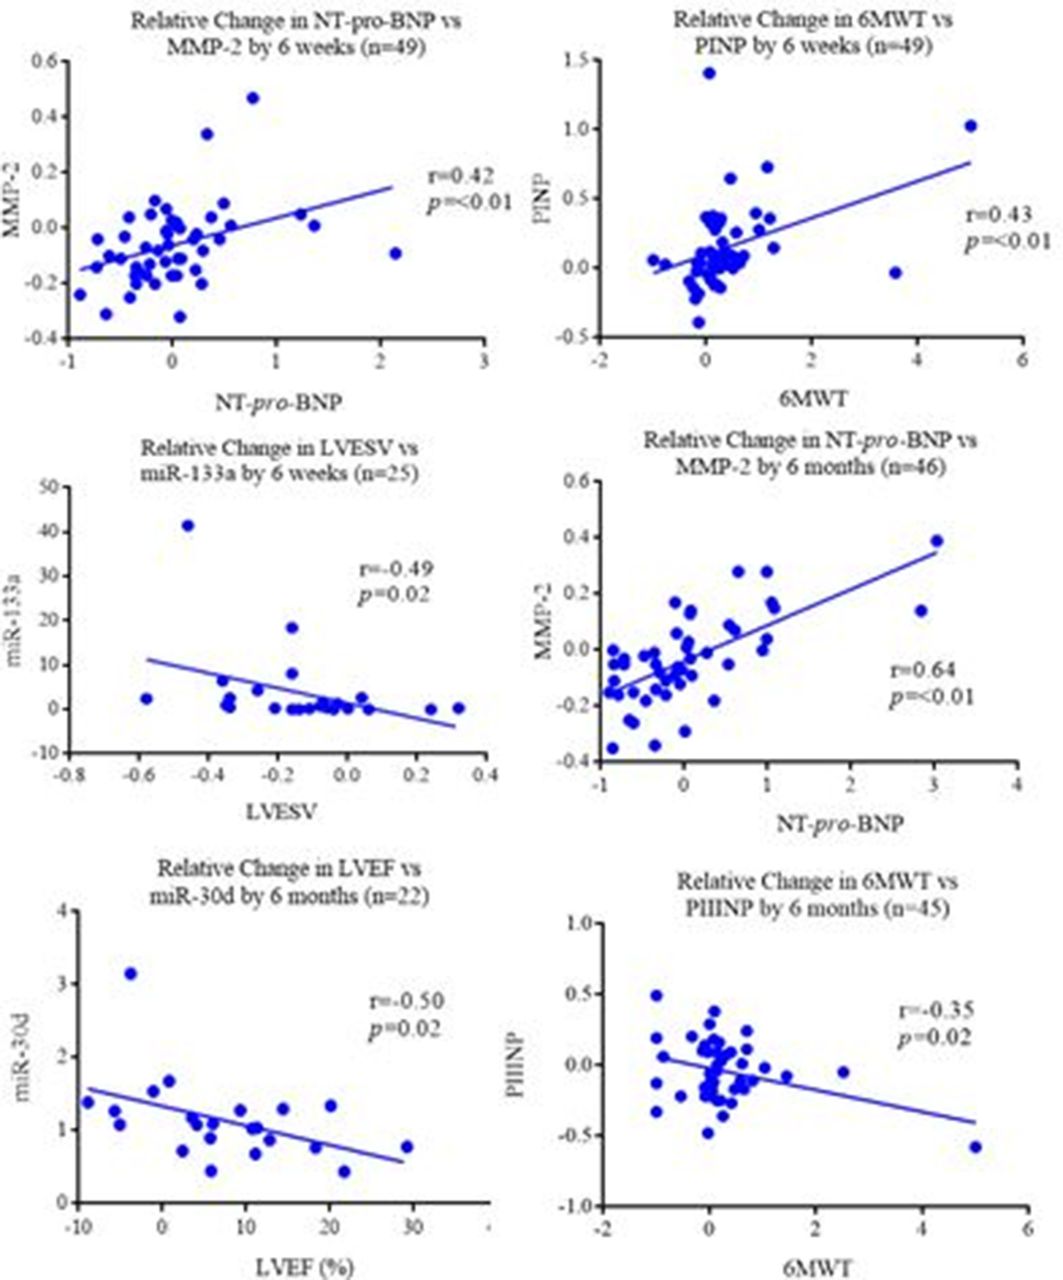
Bivariate correlation analysis of short-term and long-term changes following CRT between biomarkers versus functional and echocardiographic variables. Relative change applied to short-term (6 weeks) and long-term (6 months) reviews compared with the baseline assessments. Relative change was calculated by follow-up-Baseline/Baseline. Parametric or non-parametric bivariate correlation analysis performed dependent of continuous data distribution. All prespecified biomarkers compared with were 6MWT, QoL score, NT-pro-BNP, LVESV and LVEF. CRT, cardiac resynchronisation therapy; LV, left ventricle; MMP-2, matrixmetalloproteinase-2; 6MWT, 6 min walk test; NT-pro-BNP, N-terminal pro-brain natriuretic peptide; PINP, N-terminal pro-peptides of collagen I; PIIINP, N-terminal pro-peptides of collagen III.
Predicting functional response
Prespecified baseline ECM, GDF-15 and miRNA biomarkers, alongside established clinical parameters underwent logistic regression modelling to build a prediction model for functional response. Figure 4 shows the univariate and multivariate model for preimplant parameters and their ability to predict functional response. There were two variables on multivariate modelling which trended towards predicting long-term functional response; these were increasing baseline CTx expression and presence of LBBB morphology on resting ECG.
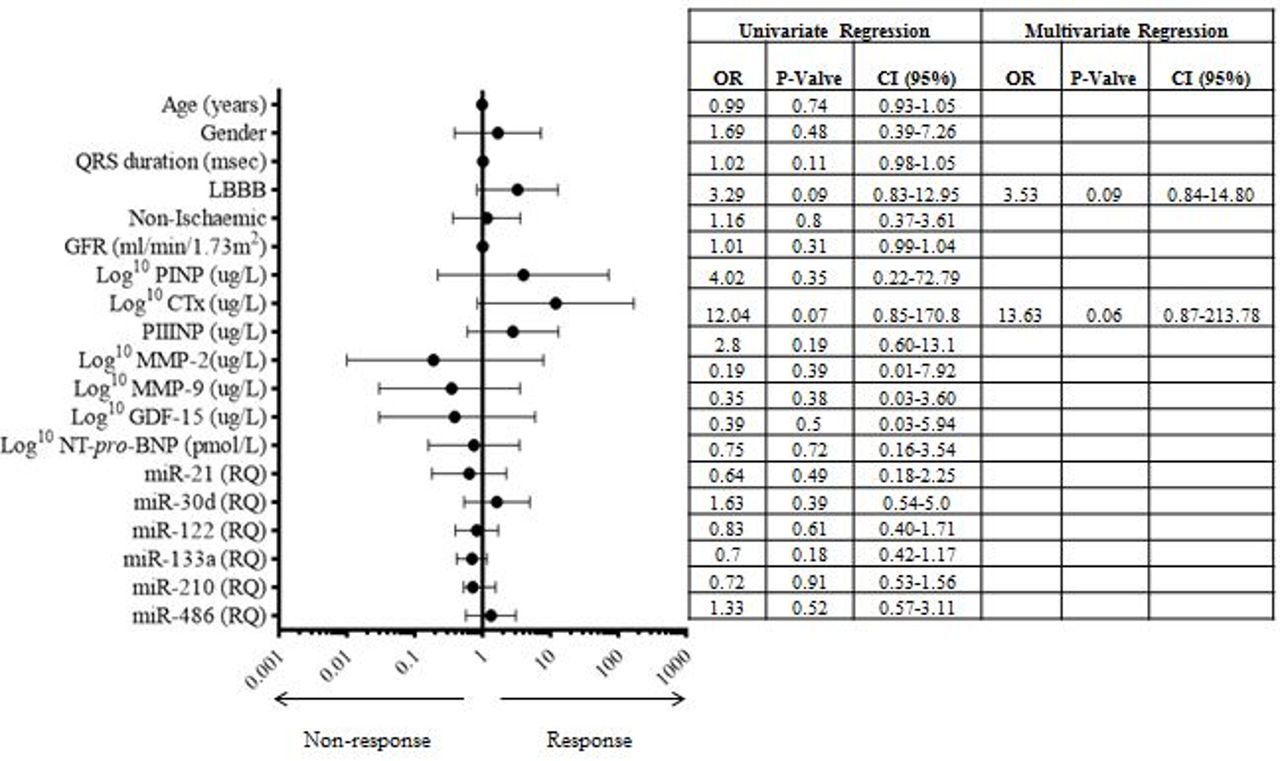
Univariate and multivariate regression model of pre-CRT implant variables for prediction of functional response at 6 months. Forrest plot demonstrated the OR and 95% CI for parameters in univariate analysis. The table demonstrated the final step in the multivariate analysis. ECM, GDF-15 and NT-pro-BNP were logarithmically transformed for the prediction model. ECM, extracellular matrix; GDF-15, Growth Differentiation Factor-15; NT-pro-BNP, N-terminal pro-brain natriuretic peptide.
Echocardiographic response and baseline biomarker expression
Echocardiographic response was established in 28 participants, due to limitations in the ability to perform paired LV volumetric assessments secondary to suboptimal image quality and body habitus; there were 12 (42.9%) responders and 16 (57.1%) non-responders. Baseline comparison of biomarker expression was performed between these echocardiographic responders and non-responders (table 3).
Comparison of baseline biomarker expression between with and without >15% reduction in LVESV at 6 months following CRT
Adverse events
During the 1-year observation period following CRT, there were 8 (15.4%) MACEs at a median 2.8 (0.1–11.9) months. There were 4 (7.7%) all-cause mortalities at median of 3.7 (0.1–9.6) months. There were 6 (11.5%) hospital admissions for first HF event after CRT which occurred at median of 2.8 (1.3–11.9) months. Baseline characteristics for those with/without MACE were not significantly different for any parameter or baseline biomarker expression. Online supplementary file 1 compares baseline biomarker expression dependent on MACE occurrence in the following year.
Coronary sinus biomarker profile
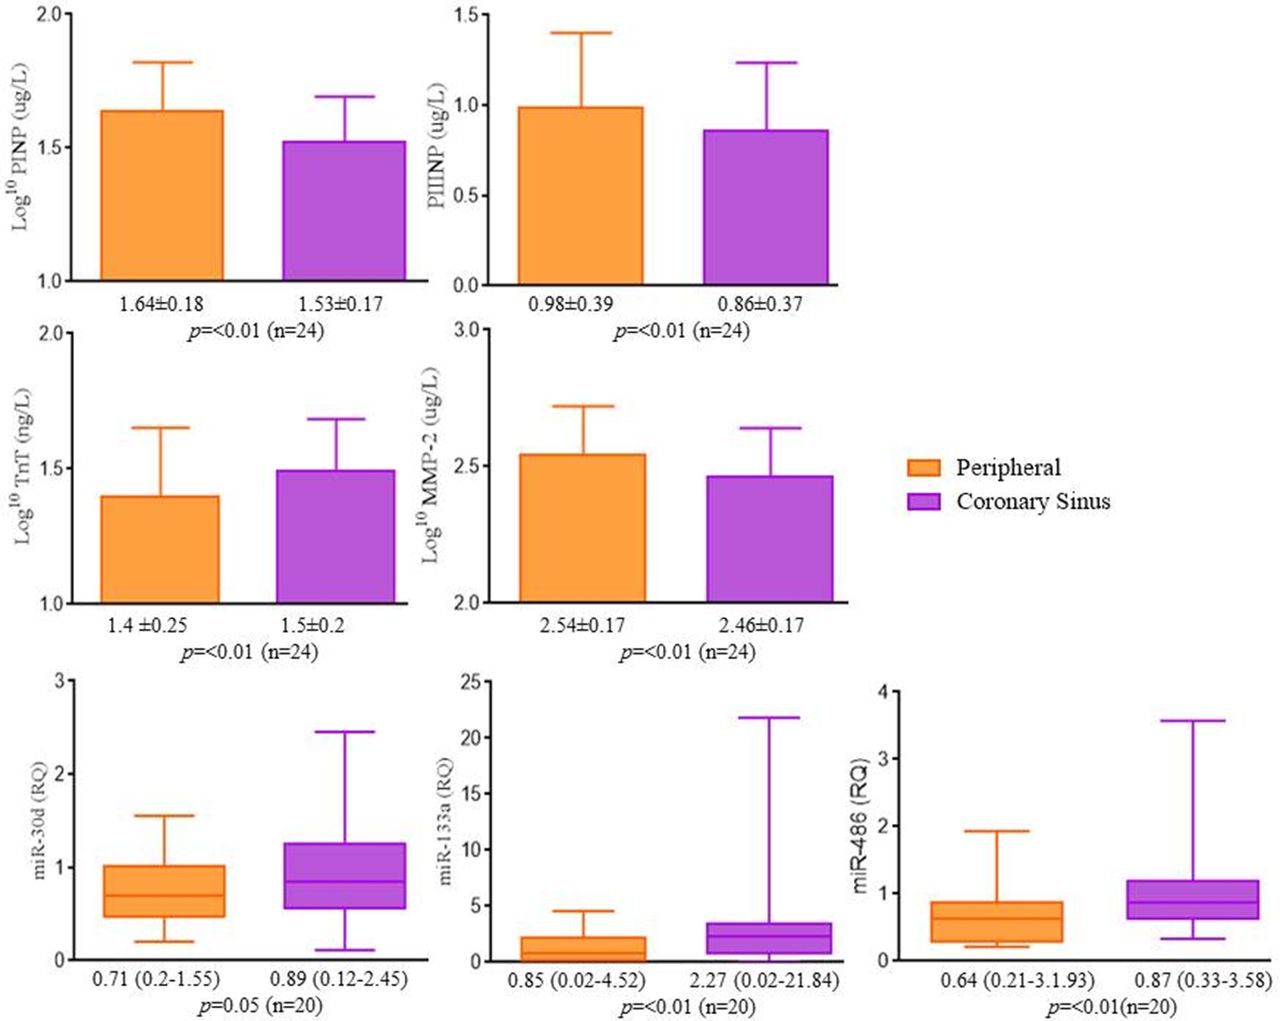
Coronary sinus and peripheral venous sampling were conducted on a subset of the study cohort (n=26) on the day of implant (only paired samples compared). Haemolysed samples were excluded from respective analyses. Figure 5 shows those biomarkers that demonstrated significant variation in their expression. Expression was higher in the coronary sinus for hs-TnT (p<0.01), miR-30d (fold change 1.29, p=0.05) and −133a (fold change 3.36, p<0.01). Notably miR-486 had significantly higher expression in the coronary sinus (fold change 1.43, p<0.01), which is in keeping with the higher haemolysis rate observed in coronary sinus sampling. PINP, PIIINP and MMP-2 all had significantly higher expression in peripheral samples than coronary sinus (p<0.01), this was observed for both responders and non-responders (p<0.01); hs-TnT demonstrated significantly higher expression in non-responders in coronary sinus than peripheral samples (28.8 ng/L (6.5–61.6) vs 38.4 ng/L (10.3–60.6], p<0.01). No statistical difference in hs-TnT levels for responders was observed between peripheral and coronary sinus samples (23.4 ng/L (8.5–68.2) vs 27.5 ng/L (17.7–64.7), p=0.14).

Variation between biomarker expression in peripheral and coronary sinus blood. PIIINP is expressed as mean±SD and underwent parametric comparison. PINP, MMP-2, hs-TnT, miR-30d, miR-133a and miR-486 were reported as median (range) and underwent non-parametric comparison. Comparisons were undertaken on the number of paired datasets available (n given for each comparison). hs-TnT, high-sensitivity Troponin-T; MMP-2, matrixmetalloproteinase-2; PINP, N-terminal pro-peptides of collagen I; PIIINP, N-terminal pro-peptides of collagen III.
Discussion
Our pilot study is the first to prospectively evaluate cardiac fibrosis biomarkers and dysregulated miRNA in patients with HF undergoing CRT to determine their potential to predict functional response. It is the first study, to our knowledge, to profile specific miRNAs that are known to be dysregulated in patients with HFrEF. Preimplant, there were no significant differences between expressions in the prespecified biomarkers. None of the predefined biomarkers demonstrated ability to predict functional response; however, CTx and LBBB morphology trended towards significance. However, levels of PINP and miR-122 following CRT implantation were shown to vary significantly between responders and non-responders. Expression over time in both groups was shown to alter for MMP-2, MMP-9 and hs-TnT. Furthermore, specific changes in biomarker expression were shown to be associated with changes in functional, neurohormonal and LV geometry parameters both in short-term and long-term follow-up. The study also showed higher expression of cardiac fibrosis biomarkers systemically and higher expression of miRNAs in the coronary sinus.
Cardiac fibrosis biomarkers are known to be strongly associated with poor HF outcomes.2 Alteration in ECM turnover is a key feature of cardiac fibrosis and strongly associated with development and progression of HFrEF.3 Over the last decade, specific ECM biomarkers have been associated with poor HF outcomes2 and to predict response to CRT.4 Alteration in collagen synthesis and deposition, demonstrated by PINP/PICP for type I and PIIINP for type III, have been observed to predict response in several observational studies for functional and echocardiographic criteria. The exact behaviour and significance of collagen turnover have not been consistently replicated,4 principally due to variation in response definitions. No biomarkers in our study predicted response; CTx trended towards predicting response but did not reach significance. No statistically significant differences in ECM biomarker expression were demonstrated between echocardiographic responders or those with/without MACE. A substudy of the CARE-HF trial1 examined ECM biomarkers (PINP, PIIINP, ICTP, MMP-1) as potential predictors of response (survival and LVEF >35% at 18 months); they showed none predicted response, in keeping with our observations.16 More recently, The Markers and Response to CRT (MARC) study tested multiple pre-specified variables including ECM biomarkers (PIIINP, ICTP, PICP, MMP-9, TIMP-1) and they also showed none predicted CRT response (defined as ↓>LVESVi at 6 months).17 Our study demonstrated that reduction in PIIINP expression at 6 months was associated with greater 6MWT distance from baseline, suggesting reversal of cardiac fibrosis was associated with improved functional status, in contrast to observations made by Garcia-Bolao et al .18 PIIINP was observed to be more sensitive to changes in cardiac modelling implying it may represent a more long-term remodelling pattern. However, in the long term, these markers do not correlate with LV geometry parameters, therefore the precise relationship between collagen turnover and response to CRT remains unclear. We found that PINP, PIIINP and MMP-2 expression was higher in peripheral compared with coronary sinus samples. These observations are in agreement with findings of Tolsana et al,19 who reported MMP-2 was more highly expressed systemically than in the coronary sinus. Multiple cell types have been shown to secrete pro-MMP-2 that are not exclusive to the heart.3 The implications are that HF modifies systemic expression of MMP-2 alongside that of the heart. Furthermore, greater expression systematically suggests potential modification of cardiac ECM in HF is from non-cardiac sources. GDF-15 is a marker of myocardial stress and its ability to predict poor HF outcomes are well described. GDF-15 has been demonstrated to be a robust predictor of mortality following CRT.5 However, GDF-15 did not predict functional response (survival/HF hospitalisations, ↓>1 NYHA class or ↑>25% 6 MWD at 1 year);5 our observations support these conclusions. GDF-15 did not predict response and we did not observe any difference in baseline expression in those with and without MACE.
There is maladaptation of complex cardiovascular biological systems in HF. This maladaptation involves dysregulation of specific miRNAs which regulate and control these systems.6 MiRNA dysregulation has been associated with development of adverse cardiac remodelling in HFrEF.6 Marfella et al 7 observed altered expression in miRNA profiles between responders and non-responders using a miRNA microarray. Melman et al 9 recently identified that miR-30d was overexpressed in responders and had ability to predict response (increase LVEF >10% at 6 months). Neither study replicated the results of the other; however, the studies differed in methodology. Marfella et al 7 and Melman et al 9both used small cohorts with different characteristics and different quantification methods (microarray and quantitative PCR, respectively). We selected six specific miRNAs that have been demonstrated to be dysregulated in HFrEF, including miR-30d. MiRNAs were individually profiled by quantitative PCR methods, which is gold standard for quantification.6 None of the miRNAs were observed to be predictors of functional response and no variation at baseline was observed for echocardiographic responders. However, miR-30d had statistically higher expression in patients with no MACE at 12 months. This observation has not previously been made and may imply increased LV wall stress is protective; however, this has not been tested in a prediction model against other variables. Over the observation period, miR-122 expression was statistically lower in functional responders. Recently, miR-122 has been shown to be expressed in the liver due to congestion which would support the observation that there is lower expression in responders after CRT.20 Higher expression of miR-30d and miR-133a was observed in the coronary sinus compared with peripheral circulation consistent with previous findings that demonstrated these miRNAs to be enriched.6 MiR-486 demonstrated higher expression in the coronary sinus than peripherally, potentially reflecting higher haemolysis of samples taken via the catheter.
Our cohort behaved as expected following CRT implantation.1 18 19 Overall, patients had significantly improved NYHA classification and 6MWT distances, alongside reduced Qualiy of Life (QoL) scores. Interestingly, the entire cohort showed a statistically significant improvement in LV geometry and reduction in hs-TnT over the observation period, without any difference between responders and non-responders. The pattern observed in overall improvement in LV geometry has been well described following CRT.1 However, given this pattern was not seen in functional responders only emphasises the known poor correlation between echocardiographic and clinical response criteria.21 Variation in different definitions used for CRT response remains a major limitation in this field.21
There are several limitations to our prospective study. The first and most important is that our study was underpowered and may have affected the study findings. We were unable to perform power calculations at the start given the lack of data in the field. We performed this single-centre pilot study to allow us to subsequently perform a power calculation which would inform a larger multicentre trial. Therefore, a larger, powered sample size may demonstrate different results. Transthoracic echocardiography was limited in several participants due to body habitus resulting in inability to perform paired standardised modified Simpsons biplane assessments on all (28 paired assessments performed). The NICE implant guidelines10 used changed during the study period reflecting a move away from mechanical dys-synchrony on echo towards QRS duration/morphology. The study inclusion changed to reflect real world circumstances and this may have altered cohort characteristics. Also, the number of MACE events was low over 12 months and results must be interpreted cautiously. Coronary sinus samples were taken on the second half of the cohort only. Given the small sample size caution must be applied when interpreting these results. It is possible there may be a delay in ECM biomarkers/mRNA levels following CRT and longer follow-up may cause changes undetected during our follow-up.
Conclusion
Our study showed that ECM biomarkers, GDF-15 and a selected panel of miRNAs did not predict functional response in a heterogeneous HFrEF population undergoing CRT. However, we observed LBBB morphology and the biomarker CTx did show a trend towards predicting response and warrants further study.
Acknowledgments
We acknowledge our manuscript appears in a plagiarism checker. We acknowledge textual overlap with Dr McAloon’s recent PhD thesis on this subject, which is held in a repository at the University of Warwick. We would like to thank the Research, Development and Innovation department at University Hospitals Coventry and Warwickshire for their support with the study as well as the Department of Cardiac Investigation. We would like to thank Dr Abdul Maher for implanting many of the devices included in the study.
References
Footnotes
Contributors All authors contributed to the planning, conduct and reporting of the work described in the article. FO is responsible for the overall content as guarantor.
Funding We would like to thank the Research, Development and Innovation department at University Hospitals Coventry and Warwickshire for their support with the study.
Competing interests None declared.
Patient consent Not required.
Ethics approval South Birmingham Regional Ethics committee (13/WM/0355).
Provenance and peer review Not commissioned; externally peer reviewed.
Data statement No additional data are available.