Article Text

Abstract
Objective Myocardial early systolic lengthening (ESL) duration is prolonged in patients with coronary artery disease (CAD). However, the relationship between the fractional flow reserve (FFR), the current gold standard for evaluating physiological myocardial ischaemia, and ESL has not been studied. The aims of this study were to investigate whether left ventricular (LV) ESL duration could identify patients with CAD, and to examine the relationship between FFR and LV ESL duration.
Methods In this single-centre, cross-sectional, prospective study of 75 patients with suspected or known CAD, we performed two-dimensional speckle tracking echocardiography at rest on the day before coronary angiography or percutaneous coronary intervention. Apical 3 views were used to examine ESL duration, defined as time from onset of the Q wave to maximum myocardial systolic lengthening.
Results Thirty-five patients had non-significant stenosis. Forty patients with CAD underwent FFR testing: 17 had an FFR≥0.8 and 23 had an FFR<0.8. Global ESL duration was 20.9±22.2 ms in patients with non-significant stenosis, 36.4±23.2 ms in patients with FFR≥0.8 and 39.6±29.5 ms in patients with FFR<0.8 (p=0.020). However, global and regional ESL durations were not significantly correlated with FFR and demonstrated poor reproducibility.
Conclusion Although myocardial ESL duration was significantly prolonged in patients with CAD compared with patients without CAD, ESL at rest showed poor reproducibility, and this new parameter did not predict FFR in patients with suspected CAD.
- fractional flow reserve
- myocardial ischaemia
- speckle tracking echocardiography
This is an open access article distributed in accordance with the Creative Commons Attribution Non Commercial (CC BY-NC 4.0) license, which permits others to distribute, remix, adapt, build upon this work non-commercially, and license their derivative works on different terms, provided the original work is properly cited, appropriate credit is given, any changes made indicated, and the use is non-commercial. See: http://creativecommons.org/licenses/by-nc/4.0
Statistics from Altmetric.com
Key questions
What is already known about this subject?
Duration of myocardial early systolic lengthening (ESL) by speckle tracing echocardiography is prolonged in patients with coronary artery disease (CAD).
However, there are no data about the relationship between fractional flow reserve (FFR), which is the current gold standard for evaluating physiological myocardial ischaemia, and left ventricular (LV) ESL.
What does this study add?
The results of this study demonstrated that LV ESL duration at rest was significantly prolonged in patients with CAD and FFR<0.8 compared with those without significant CAD, whereas LV ESL duration did not show a significant correlation with the FFR value in those with CAD.
How might this impact on clinical practice?
Although myocardial ESL duration was significantly prolonged in patients with physiologically significant CAD, ESL at rest showed poor reproducibility and did not predict an FFR in these patients.
Myocardial ESL in clinical practice provided no additional diagnostic information to identify those with significant myocardial ischaemia defined as reduced FFR.
Introduction
The accurate identification of patients with ischaemic heart disease is crucial for successful early revascularisation. The early diagnosis of myocardial ischaemia has been challenging, despite several attempts at non-invasive quantification of ischaemic myocardial contractions.1 2 Two-dimensional (2D) speckle tracking echocardiography (STE) has played a pivotal role in the early diagnosis of coronary artery disease (CAD).3 4
Previous studies indicated that an ischaemic myocardium with reduced active force will lengthen when left ventricular (LV) pressure rises during early systole before onset of systolic shortening in patients with CAD.5 6 However, there are no data about the relationship between fractional flow reserve (FFR), which is the current gold standard for evaluating physiological myocardial ischaemia and used to determine the optimal therapy,7–10 and LV early systolic lengthening (ESL).
The aims of this study were to investigate whether the duration of LV ESL could identify patients with CAD, and to examine the relationship between FFR and duration of LV ESL.
Methods
Study population
This prospective, single-centre, cross-sectional study was conducted between September 2012 and December 2014 in the Shinshu University Hospital. We included 75 consecutive patients who were referred to our department with suspected or known CAD. All patients underwent elective diagnostic coronary angiography (CAG) because of stable chest pain and/or elective percutaneous coronary intervention (PCI) because of objective signs of ischaemia from exercise ECG, stress thallium-201 single-photon emission CT, or clinical symptoms. The exclusion criteria were acute coronary syndrome, a history of myocardial infarction, significant valvular heart disease, atrial fibrillation and bundle branch block with QRS>120 ms consistent with a previous report.5 Our institutional review board approved the protocol, and written informed consent was obtained from each patient before the CAG examination. This study was conducted in accordance with the principles outlined in the Declaration of Helsinki.
Standard ultrasound examination and measurement
All ultrasound examinations were performed with a commercially available echocardiographic machine with an S3 transducer (Vivid Seven System, GE Healthcare, Horten, Norway). Parasternal and apical projections were obtained according to the recommendations of the American Society of Echocardiography.11 12 The LV volume and ejection fraction (EF) were calculated using the biplane Simpson’s method from the apical four-chamber and two-chamber views. Pulsed Doppler echocardiography was used to obtain the transmitral and pulmonary venous flow velocities, with sample volumes positioned at the level of the mitral tips and the right upper pulmonary vein 1 cm below the ostium, respectively. The peak velocities of early (E) and late filling (A) waves, the E/A ratio of peak velocities and deceleration time of the E-wave were measured from transmitral flow velocities, and the peak velocities of systolic (S), diastolic (D) and A waves, S/D ratio of peak velocities were also measured from the pulmonary venous flow velocities. Early diastolic mitral annular velocities of the septal and lateral mitral annulus (e′ velocity) were obtained by tissue Doppler imaging and the E/e′ ratios were calculated.
2D speckled tracking echocardiography
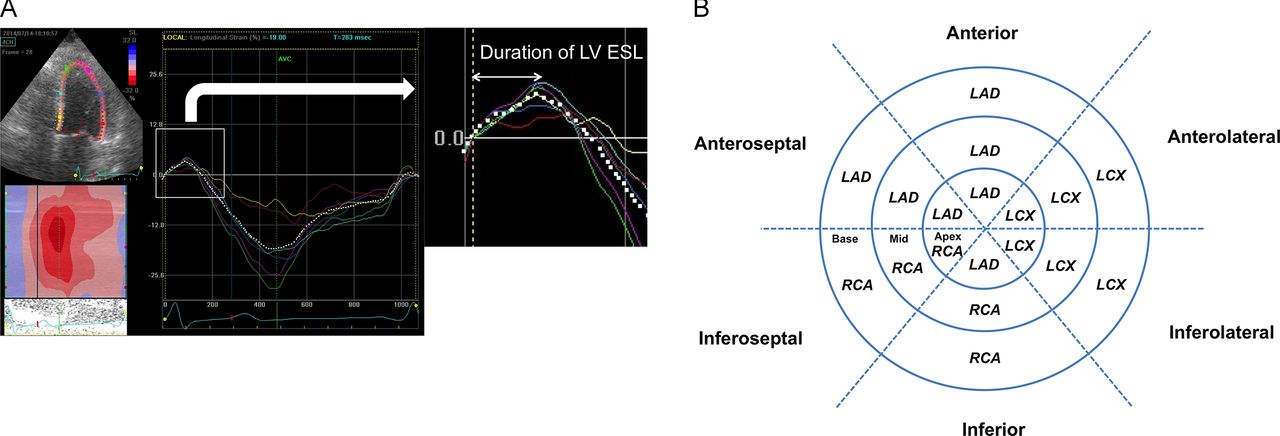
The second harmonic B-mode images were obtained for offline analysis (EchoPAC Dimension BT12.0, GE Vingmed Ultrasound, Horten, Norway). 2D STE at rest was performed the day before CAG or PCI. Apical four-chamber and two-chamber, and long-axis views were used to determine the LV longitudinal strain. The frame rate for 2D echo was 92.7±2.7 frames per second. Longitudinal strain was measured by 2D-STE using an 18-LV segment model.13 The LV endocardial border was manually traced in the end-systolic frame, and the software subsequently and automatically traced the borders in the other frames. End-systole was defined by aortic valve closure in the apical long-axis view. LV global longitudinal strain (GLS) was calculated as the mean longitudinal peak negative strain from each of three apical views during a cardiac cycle. For each segment, the peak negative systolic strain value (representing maximum segmental systolic shortening), peak positive early strain (representing maximum segmental systolic lengthening), duration of ESL and postsystolic shortening (PSS) were recorded by fully automated software. The values from all segments were averaged to obtain a mean value for each patient, according to the methodology about the duration of ESL in the previous paper.5 Regarding the duration of ESL, we analysed the global and regional values in each patient. The duration of LV ESL was defined as time from onset of the Q wave on ECG to maximum myocardial systolic lengthening (figure 1A). PSS was defined as peak negative strain during diastole minus peak negative systolic strain.14 When the minimum segment length occurred during systole, PSS was zero by definition. Three consecutive beats were measured and averaged for each measurement. Based on an 18-LV segment model of myocardial perfusion territories,13 regional strain was calculated as the value of segments belonging to the perfusion territory in the left anterior descending coronary artery (LAD) (seven segments out of the 18-LV segment model). The theoretical perfusion area may not reflect the real perfusion areas particularly in left circumflex and right coronary arteries. Therefore, we analysed the composite of regional strain belonging to the perfusion territory in left circumflex and right coronary arteries (11 segments out of the 18-LV segment model) (figure 1B).12 13

Representative example of LV early systolic lengthening duration using two-dimensional speckle tracking echocardiography (A) and 18-LV segment model (B). LAD, left anterior descending coronary artery; LCX, left circumflex; LV ESL, left ventricular early systolic lengthening; RCA, right coronary artery.
Coronary angiography and FFR
Multidirectional CAG was performed according to Judkins technique. The degree of coronary artery stenosis was rated visually according to the criteria of the American Heart Association.15 PCI was performed at the discretion of the operator. An intracoronary pressure and temperature sensor-tipped 0.014-inch wire (Certus, St Jude Medical, Minneapolis, MN, USA) was passed through a 6 F or 7 F guiding catheter. The sensor near the wire tip measured the distal pressure and temperature, whereas the shaft of the pressure wire detected proximal temperature. Maximal hyperaemia was induced by infusing intravenous adenosine triphosphate (140–180 µg/kg/min) through a 4 F sheath via the brachial vein or by injecting intracoronary papaverine hydrochloride (8–12 mg).16 17 FFR was measured after CAG or before PCI. Three measurements were made and averaged. FFR was defined as the mean distal pressure divided by the mean proximal pressure during maximal hyperaemia.18 Non-significant CAD (nsCAD) was defined as <50% diameter narrowing in all three vessels on visual estimation. CAD was defined as ≥50% diameter stenosis in any coronary artery.
Intraobserver and interobserver variability
The intraobserver and interobserver variabilities for LV GLS, mean LV peak positive early strain and mean duration of LV ESL were studied in a group of 27 randomly selected subjects, based on measurements repeated by one observer at different times, and by two observers who were unaware of each other’s measurements. The bias (mean difference) and limits of agreement (1.96 SDs of difference) between the first and second measurements were determined.
Statistical analysis
Continuous variables are summarised as mean±SD if normally distributed, and as median and IQR if non-normally distributed. Categorical variables are described as percentages. Comparisons among groups were performed with the use of analysis of variance for normal continuous variables, the Kruskal-Wallis test for non-normal continuous variables and χ2 analyses for categorical variables. When significant differences among groups were present, the Bonferroni post hoc test was used to compare individual groups. Correlations between the FFR and the duration of LV ESL were studied using a non-parametric (Spearman’s) correlation coefficient. Receiver operating characteristic (ROC) curve analyses were used to evaluate the diagnostic ability of echocardiographic indices to classify patients with CAD or FFR<0.8. The optimal cut-off value was the value for which the sum of sensitivity and specificity was the highest on the ROC curves. A logistic regression analysis was performed to identify patients with CAD by using variables that included clinical characteristics, risk factors and echocardiographic indices. Multivariable analysis was performed using all variables with a p value <0.1 in the univariable analyses. A value of p<0.05 was considered to indicate statistical significance. All analyses were performed using SPSS V.21.0 (SPSS) and STATA V.14.1 (StataCorp, College Station, TX, USA).
Results
Clinical characteristics and conventional echocardiography
Patient clinical characteristics are listed in table 1. Thirty-five patients revealed nsCAD. Forty patients, who underwent FFR, showed CAD, with 17 patients having FFR≥0.8 and 23 patients having FFR<0.8. Patients with CAD were older than those without (p=0.04). Sex, blood pressure, history of hypertension, dyslipidaemia and diabetes mellitus were similar among the three groups, whereas smoking was significantly more common in patients with CAD than in those with nsCAD. Multivessel disease and visual stenosis did not differ between the two groups with CAD. With respect to drug therapies, the use of antiplatelet medications and statins in patients with CAD was significantly more frequent compared with patients with nsCAD. Left atrial diameter, LV thickness and LVEF did not differ among the three groups. There was no difference in transmitral, pulmonary venous flow, or pulsed tissue Doppler parameters among the three groups, except for the peak E-wave, A-wave and D-wave velocities.
Patient clinical characteristics and echocardiographic findings
LV myocardial deformation
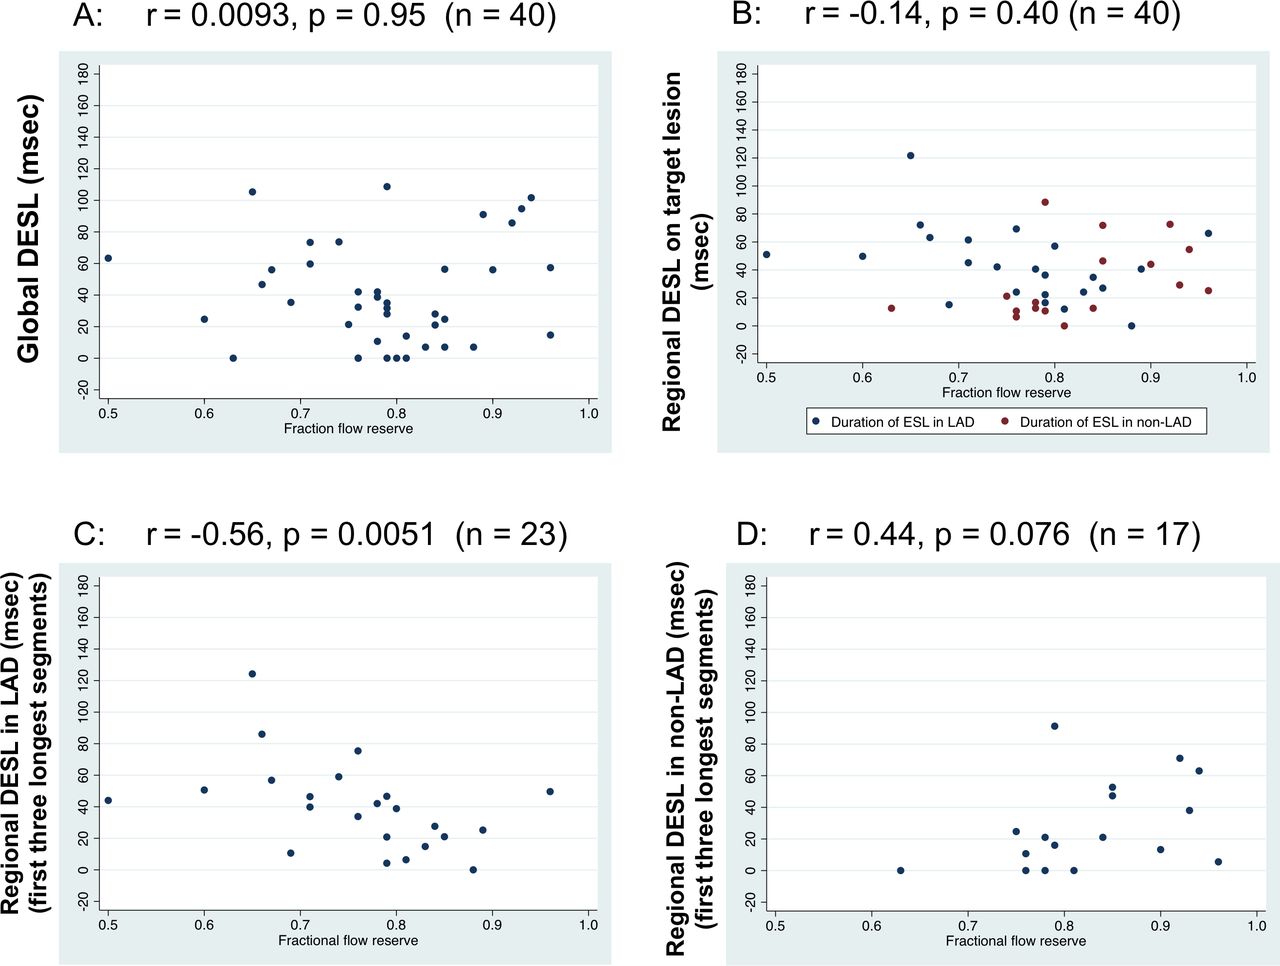
The values of LV GLS, PSS, LV peak positive early strain and duration of LV ESL are shown in figure 2. There was no difference in LV GLS, PSS and LV peak positive early strain (p=0.14, p=0.71 and p=0.19, respectively) among the three groups. The duration of ESL was 20.9±22.2 ms in patients with nsCAD, 36.4±23.2 ms in patients with FFR≥0.8 and 39.6±29.5 ms in patients with FFR<0.8 (overall, p=0.020). With respect to regional strain belonging to the perfusion territory in the LAD, duration of LV ESL was significantly prolonged in patients with FFR<0.8 compared with patients with nsCAD and FFR≥0.8 (p=0.001 and 0.018, respectively). There was no difference in LV longitudinal strain, PSS and LV peak positive early strain (p=0.22, p=0.67 and p=0.31, respectively) among the three groups (table 2). The duration of global and regional (on target lesion) LV ESL did not show the significant correlation with the value of FFR (n=40, r=0.0093, p=0.95; n=40, r=−0.14, p=0.40, respectively). However, the duration of regional ESL belonging to the perfusion territory in the LAD was significantly correlated with FFR (161 segments, r=−0.21, p=0.007), whereas the duration of regional ESL in the non-LAD coronary artery was not significantly correlated with FFR (187 segments, r=0.11, p=0.14). As to the centre region of ischaemia (using first three longest segments in each patient), the duration of regional ESL in the LAD was also significantly correlated with FFR (n=23, r=−0.56, p=0.0051). The duration of regional ESL (using the only first three longest segments) in the non-LAD did not show the correlation with FFR (n=17, r=0.44, p=0.076) (figure 3).
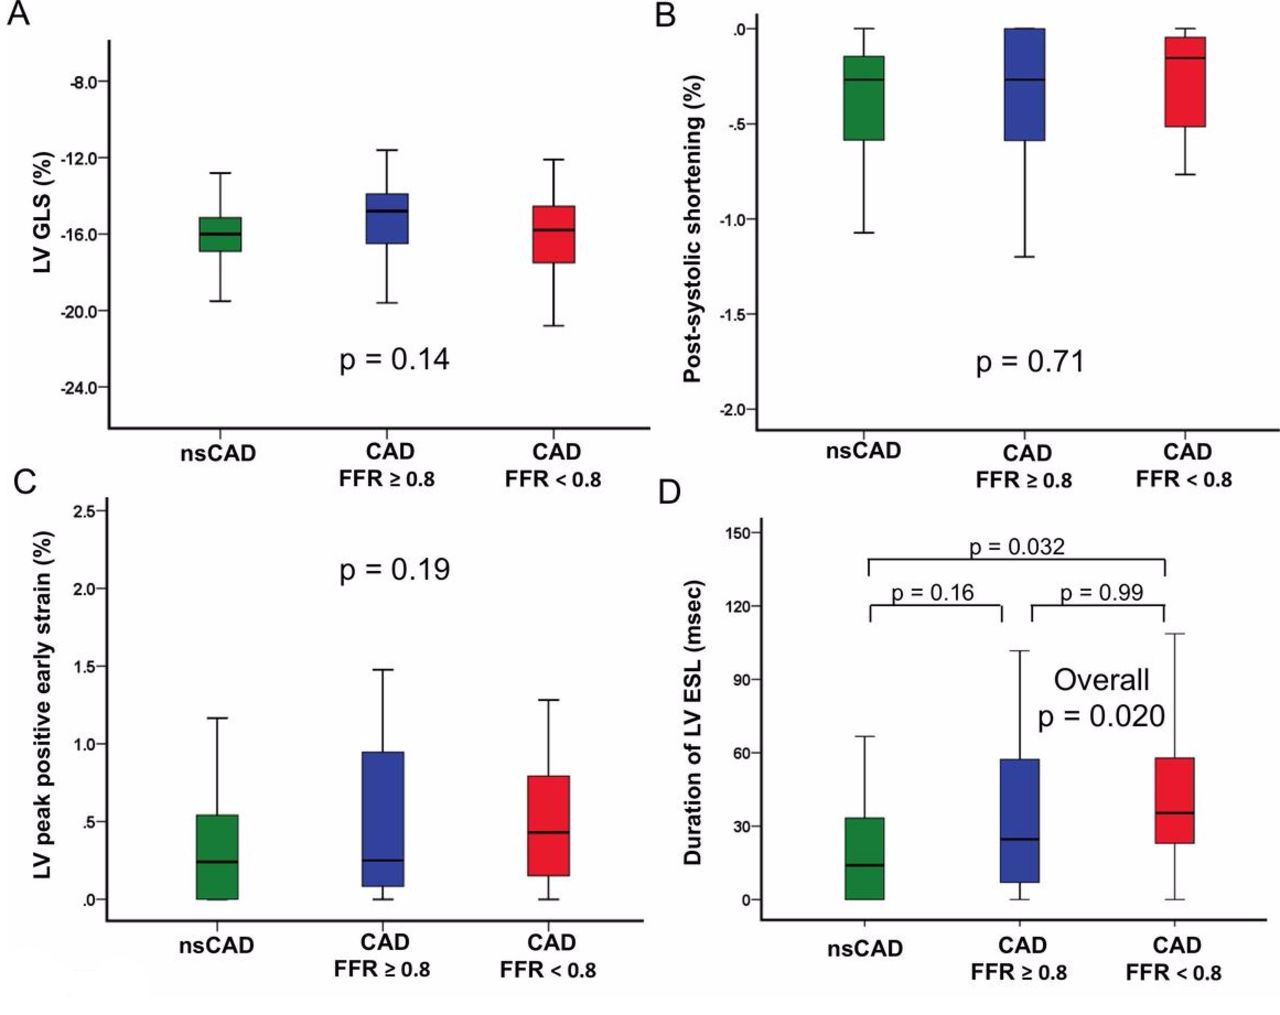
Myocardial deformation in patients with and without coronary artery disease measured by LV GLS levels (A), postsystolic shortening (B), LV peak positive early strain (C), and duration of LV ESL (D). The bottom and top whiskers indicate the fifth and 95th percentile levels, respectively; the lower and upper boundaries of the boxes, the 25th and 75th percentile levels, respectively; and the horizontal line within the box, the median level. CAD, coronary artery disease; FFR, fractional flow reserve; LV ESL, left ventricular early systolic lengthening; LV GLS, left ventricular global longitudinal strain; nsCAD, non-significant coronary artery disease.

Correlation between fractional flow reserve and duration of (A) global LV ESL, (B) regional LV ESL, (C) regional LV ESL (first three longest segments) in the LAD, and (D) regional LV ESL (first three longest segments) in non-LAD. DESL, duration of ESL; ESL, early systolic lengthening; LAD, left anterior descending coronary artery; LV, left ventricular.
Regional speckle tracking echocardiographic findings
Discrimination of patients with and without CAD
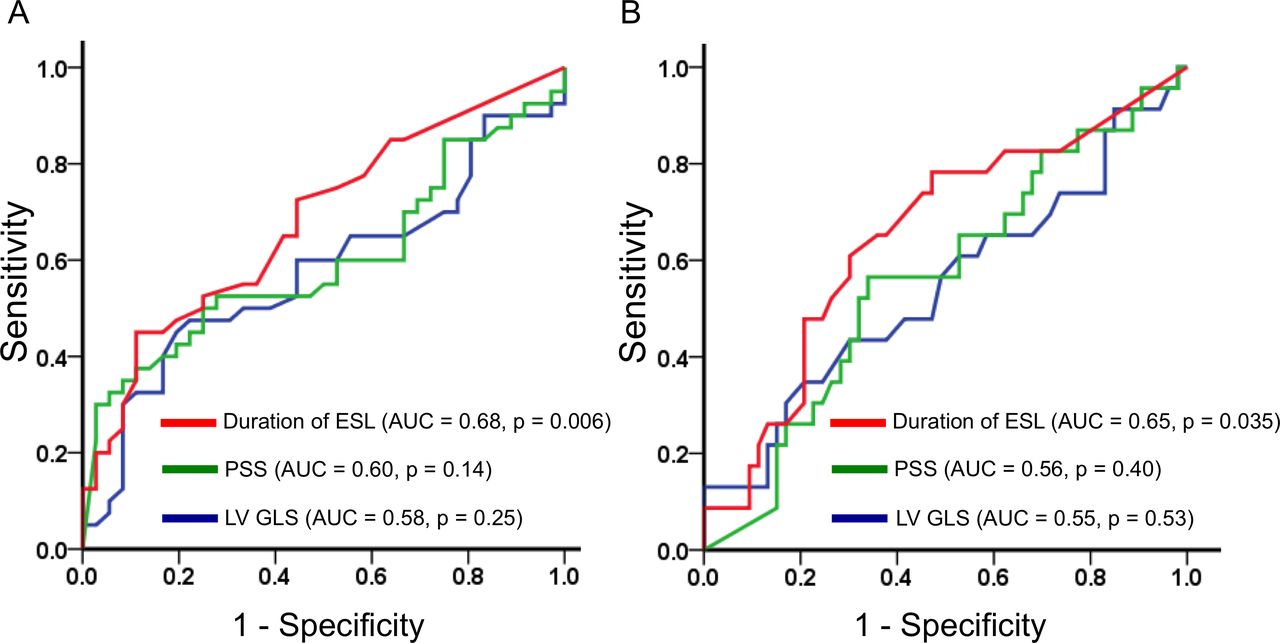
In the univariable logistic regression analysis, age and duration of LV ESL were associated with the presence of CAD. Multivariable logistic regression analyses found that age and duration of LV ESL were significantly associated with the presence of CAD (table 3). Of the examined 2D-STE parameters in global measurements, the area under the ROC curve (AUC) for detecting the presence of CAD was the greatest for duration of LV ESL (AUC 0.68, 95% CI 0.56 to 0.80, p=0.006) (figure 4A). As determined by the ROC curve analysis, an LV ESL duration >14.3 ms (sensitivity 72.5%, specificity 55.6%) separated patients with CAD from patients with nsCAD. Furthermore, the AUC for detecting the patients with FFR<0.8 was the greatest for duration of LV ESL (AUC 0.65, 95% CI 0.52 to 0.79, p=0.035) (figure 4B). As determined by ROC curve analysis, an LV ESL duration >21.2 ms (sensitivity 78.3%, specificity 52.8%) separated patients with FFR<0.8 from the other patients.

Receiver operating characteristic (ROC) curves for detecting (A) patients with coronary artery disease and (B) patients with FFR<0.8 in global measurements. The AUC for duration of LV ESL was the highest, with optimal ROC cut-off points of 13.4 ms (A) and 21.2 ms (B), respectively. AUC, area under the ROC curve; FFR, fractional flow reserve; LV ESL, left ventricular early systolic lengthening; LV GLS, left ventricular global longitudinal strain; PSS, postsystolic shortening.
Logistic regression analyses of predictors of coronary artery disease
Reproducibility
Intraobserver and interobserver reproducibility of STE indices are shown in table 4. The LV GLS average coefficient of variation showed excellent reproducibility. The measurement of duration of global LV ESL showed modest reproducibility, whereas that of LV peak positive early strain showed poor reproducibility. With respect to regional measurements, duration of LV ESL did not show good reproducibility.
Intrarobserver and interobserver reproducibility of speckle tracking echocardiography data
Discussion
To the best of our knowledge, this is the first study examining the relationship between FFR and duration of LV ESL in patients with CAD. The main findings can be summarised as follows. First, we demonstrated that duration of LV ESL at rest was significantly prolonged in patients with CAD and FFR<0.8 compared with patients with no significant CAD. Second, the duration of LV ESL was significantly associated with the presence of CAD, whereas this new parameter did not show a significant correlation with the FFR value in patients with CAD. Third, the mean duration of LV ESL and LV peak positive early strain coefficients of variation showed poor reproducibility. These findings suggested that the duration of LV ESL might not be a useful parameter to evaluate the physiological myocardial ischaemia in these patients.
Smedsrud et al reported that prolonged duration of ESL in stable patients with suspected CAD was related to the presence of significant coronary artery stenosis. They demonstrated that prolonged duration of ESL at rest enabled detection of significant CAD by using visual estimation on CAG, and provided incremental value over peak systolic longitudinal strain for the identification of patients with significant CAD.5 However, whether duration of LV ESL provides added value for prediction of the presence of physiological significant CAD had not been previously studied. Contrary to our expectations, duration of LV ESL did not predict an FFR, which is the current gold standard for evaluating the physiological myocardial ischaemia, in patients with CAD in the present study.
The LV ESL values in our study were relatively shorter than values in the report by Smedsrud et al.5 In that report, the LV ESL values in patients with and without CAD were 76±37 and 38±23 ms, respectively. Furthermore, an average LV ESL duration of 14.3 ms revealed optimal sensitivity and specificity for identification of CAD in our study, and the optimal cut-off values were also shorter than values in that report (cut-off values, 58 ms). Although inclusion and exclusion criteria in our study accorded with the above study, we considered other possible explanations for the difference in results between our study and the previous report. First, we should consider vendor-related variability in 2D-STE measurements.19 All examinations were performed using a Vivid 7 scanner in both studies; therefore, equipment was not a concern. Second, frame rates of analysed images in our study (mean, 92.7±2.7 frames per second) were relatively higher than those in the above study (mean, 76±16 frames per second). However, Shin et al performed a validation study to compare the global peak systolic strain at low (mean, 30 frames per second) and high frame rates (mean, 72 frames per second).20 They found no significant difference, and good correlation was observed between the two different frame rates in LV peak strain measures. Third, the LV segmentation models were different between the previous and our study. In the previous report, longitudinal strain was measured by 2D-STE using a 16-LV segment model. For simplicity, we measured longitudinal strain using 18-LV segment model, because it was the default setting for offline analysis. Indeed, Voigt et al demonstrated that the 18-segment model is simple and well suited to describe myocardial mechanics from 2D data.13 More studies are needed to elucidate whether the different LV segmentation models could account for the difference in LV ESL duration values between the two studies. Further large-scale multicentre studies are needed to confirm the different values of LV ESL between the previous report and our study.
The mechanism underlying LV ESL remains unclear. Animal experiments conducted by Lyseggen et al suggested that a normal myocardium generates sufficient active force to shorten when LV pressure increases during systole, whereas an ischaemic myocardium has reduced active force and tends to lengthen passively during early systole.21 During the isovolumetric contraction phase, when the mitral valve has moved to its final closing position and LV volume is constrained, there is a tug-of-war between the different LV segments.22
The durations of both global and regional ESL did not show the significant correlation with FFR in the present study, whereas the duration of regional ESL belonging to the perfusion territory in the LAD was correlated with FFR. Voigt et al demonstrated that exercise induced marked changes in LV myocardial strain.23 However, we performed echocardiography at resting condition alone. Considering that FFR was measured in the status of maximal hyperaemia induced by adenosine triphosphate or papaverine hydrochloride, LV ESL after exercise or a stress protocol might show the correlation with the FFR. More studies are needed to clarify whether LV ESL during exercise could predict FFR.
In the present study, we found no differences between patients with and without CAD with regard to LVEF, LV GLS and PSS. Although PSS has been reported to be a sensitive marker of myocardium ischaemia induced by dobutamine stress,24 the presence of PSS is not a specific sign of ischaemia.25 Voigt et al demonstrated that one-third of normal LV segments had PSS on longitudinal strain measurements.25 Their findings might account for no significant difference in the values of PSS among the three groups in the present study.
Clinical implications
In large clinical trials, identification of ischaemic myocardium using an objective physiological definition such as FFR has been associated with a greater likelihood of benefit from revascularisation.7–10 Therefore, it is important to diagnose the physiological myocardial ischaemia accurately through non-invasive quantification. On the basis of our findings, LV ESL duration at rest can be used to identify patients with CAD, whereas LV ESL duration did not show a significant correlation with FFR value in patients with CAD. Furthermore, the measurement of LV ESL duration did not show good reproducibility, contrary to that of LV GLS. Taken together, the utility of LV ESL for the detection of myocardial ischaemia should be interpreted cautiously until verified in large-scale multicentre studies.
Study limitations
Our findings represented a single-centre experience of FFR and echocardiography in patients with suspected CAD. Therefore, the first limitation was the relatively small number of subjects. However, our study is the first report to evaluate the relationship between FFR and duration of LV ESL. Second, we did not evaluate the values of 2D-STE indices after PCI, and our analysis was based on single echocardiographic findings the day before angiogram. Therefore, we could not clarify the values of 2D-STE parameter changes after PCI. Third, cardiac MRI was not performed in this study. We might have included some patients with evidence of myocardial infarction by late enhancement of cardiac MRI. Despite these limitations, our findings provide new insight into the diagnostic significance of duration of LV ESL in patients with suspected CAD. Fourth, our patients were examined at resting condition, following the protocol of the previous report.5 Therefore, we could not evaluate the changes is LV ESL after exercise or a stress protocol.
Conclusions
Although duration of myocardial ESL was significantly prolonged in patients with physiologically significant CAD compared with patients without CAD, ESL at rest showed poor reproducibility, and this new parameter could not predict an FFR in these patients.
References
Footnotes
Presented at A part of study was presented at ESC congress in 2015. Minamisawa M, et al. Diagnostic significance of duration of myocardial early systolic lengthening in patients with stable coronary artery disease. European Society of Cardiology Congress 2015, London, United Kingdom, August 29- September 2, 2015.
Contributors JK, UI and KK contributed to study design and manuscript preparation. MM, AK, TM, TS, SE, HM and AO contributed to echocardiographic examination, cardiac catheterisation, patient management and statistical analysis.
Funding The authors have not declared a specific grant for this research from any funding agency in the public, commercial or not-for-profit sectors.
Competing interests None declared.
Patient consent Obtained.
Ethics approval Institutional Review Board of Shinshu University.
Provenance and peer review Not commissioned; externally peer reviewed.
Data sharing statement No additional data are available.