Article Text

Abstract
Background Patient-specific left ventricular (LV) lead optimisation strategies with immediate feedback on cardiac resynchronisation therapy (CRT) effectiveness are needed. The purpose of this study was to compare contractility surrogates derived from biventricular lead motion analysis to the peak positive time derivative of LV pressure (dP/dtmax) in patients undergoing CRT implantation.
Methods Twenty-seven patients underwent CRT implantation with continuous haemodynamic monitoring. The right ventricular (RV) lead was placed in apex and a quadripolar LV lead was placed laterally. Biplane fluoroscopy cine films facilitated construction of three-dimensional RV–LV interlead distance waveforms at baseline and under biventricular pacing (BIVP) from which the following contractility surrogates were derived; fractional shortening (FS), time to peak systolic contraction and peak shortening of the interlead distance (negative slope). Acute haemodynamic CRT response was defined as LV ∆dP/dtmax ≥ 10 %.
Results We observed a mean increase in dP/dtmax under BIVP (899±205 mm Hg/s vs 777±180 mm Hg/s, p<0.001). Based on ΔdP/dtmax, 18 patients were classified as acute CRT responders and nine as non-responders (23.3%±10.6% vs 1.9±5.3%, p<0.001). The baseline RV–LV interlead distance was associated with echocardiographic LV dimensions (end diastole: R=0.61, p=0.001 and end systole: R=0.54, p=0.004). However, none of the contractility surrogates could discriminate between the acute CRT responders and non-responders (ΔFS: −2.5±2.6% vs − 2.0±3.1%, p=0.50; Δtime to peak systolic contraction: −9.7±18.1% vs −10.8±15.1%, p=0.43 and Δpeak negative slope: −8.7±45.9% vs 12.5±54.8 %, p=0.09).
Conclusion The baseline RV–LV interlead distance was associated with echocardiographic LV dimensions. In CRT recipients, contractility surrogates derived from the RV–LV interlead distance waveform could not discriminate between acute haemodynamic responders and non-responders.
- cardiac resynchronisation therapy
- haemodynamics
- fluoroscopy
This is an open access article distributed in accordance with the Creative Commons Attribution Non Commercial (CC BY-NC 4.0) license, which permits others to distribute, remix, adapt, build upon this work non-commercially, and license their derivative works on different terms, provided the original work is properly cited, appropriate credit is given, any changes made indicated, and the use is non-commercial. See: http://creativecommons.org/licenses/by-nc/4.0
Statistics from Altmetric.com
Key questions
What is already known about this subject?
Large randomised trials have repeatedly documented that cardiac resynchronisation therapy (CRT) is an effective treatment for patients with systolic heart failure and wide QRS complex. However, approximately one-third of the patients do not benefit from CRT and this is unsatisfactory for the operator, the patient and the healthcare system.
Non-invasive patient-specific acute CRT response parameters could ideally both predict benefit of CRT and be used to maximise the individual effect of biventricular pacing. Currently, an acute response parameter with both high sensitivity and specificity does not exists.
What does this study add?
This study demonstrates that it is feasible to assess a three-dimensional distance between the right ventricular and left ventricular lead using standard fluoroscopic equipment under CRT implantation.
From a waveform based on this continuous interlead distance, contractility surrogates were derived. Unfortunately, the contractility surrogates used in this study were not able to predict acute haemodynamic response to CRT when compared with peak positive time derivative of left ventricular pressure (dP/dtmax).
How might this impact on clinical practice?
This study will not have immediate impact on clinical practice. It might, however, contribute to maintain focus on the need for new and improved CRT response parameters.
It is important that the complexity of several aspects concerning CRT response is recognised and we hope this study can contribute to this.
Introduction
Cardiac resynchronisation therapy (CRT) has demonstrated symptom relief and survival benefit on a group level in several large randomised trials.1–4 However, a substantial subset of eligible patients do not benefit from CRT. Multiple reasons for this have been proposed and a suboptimal left ventricular (LV) lead position is regarded as one of the main causes for diminished or absent long-term response to CRT.5 Thus, during implant, patient-specific LV lead optimisation strategies with immediate feedback on CRT effectiveness are needed.
Assessment of LV systolic function is a cornerstone in cardiac evaluation and echocardiography has become the standard imaging modality for this purpose. Based on changes in ventricular size and volume, fraction shortening (FS) and ejection fraction (EF) are typical examples used worldwide in everyday clinical practice. A major limitation, however, is that imaging, in general, during CRT implantation is cumbersome and not widely in use. The acute haemodynamic response to CRT may be invasively assessed using the peak positive time derivative of LV pressure (dP/dtmax) which is considered as a reproducible parameter.6 However, a non-invasive parameter with ability to confirm acute CRT response without adding complexity or risk to a standard CRT procedure setup would likely find greater acceptance.
In patients with a CRT device, the right ventricular (RV) and LV leads are in constant cyclic motion due to cardiac contraction and relaxation. This physiological lead motion is visible under fluoroscopy, but its informative value remains unexplored. In this study, we performed a continuous three-dimensional (3D) lead motion analysis during CRT implantation and hypothesised that contractility surrogates derived from an RV–LV interlead distance waveform could predict acute haemodynamic response to CRT.
Methods
Study population
This single-centre interventional study included 30 patients eligible for CRT implantation with EF ≤35%, sinus rhythm and QRS duration ≥130 ms, New York Heart Association (NYHA) functional class II or III and optimal medical therapy. Patients with atrial fibrillation, severe aortic valvular disease, severe renal failure or a recent myocardial infarction were excluded from this study. All patients gave written informed consent. The study protocol was registered at www.clinicaltrials.gov (identifier NCT01996397) and complied with the Declaration of Helsinki.
Three patients were excluded from the analysis due to incomplete data sets. Onset of transient third-degree atrioventricular (AV) block during CRT implantation and incomplete fluoroscopic film (CINE) acquisition were the reasons for this.
Implant and pacing protocol
CRT implantation was performed under local anaesthesia and in light sedation with midazolam and morphine. With access from the subclavian vein, the atrial lead was placed in the right atrial appendage and the RV lead was placed apically. A lateral or posterolateral quadripolar LV lead (Medtronic Attain Performa 4298, Medtronic, Minneapolis, USA) position was chosen under discretion of the implanter. Atrial pacing (AP) was performed at a rate 10% above intrinsic rhythm to ensure a constant baseline heart rate. Biventricular pacing (BIVP) was performed at the same rate and with an AV interval calculated as the sum of the paced P-wave width +30 ms as described by Jones et al.7 Surface ECGs and intracardiac electrograms were collected during the entire procedure and stored on a dedicated workstation (Powerlab, ADInstruments Ltd, Oxford, UK).
Haemodynamic assessment
Haemodynamic pressure monitoring was performed using a pressure catheter (MicroCath, Millar, Houston, Texas, USA) placed in the LV via a multipurpose catheter. Pressure data were obtained automatically at 1000 hz (Powerlab) followed by later offline analyses (LabChart, ADInstruments Ltd, Oxford, UK). AP and BIVP were performed for 1 min, respectively, prior to haemodynamic assessment. LV dP/dtmax was averaged over a period of a minimum of 6 s free from ectopic ventricular beats and acute haemodynamic CRT response was defined as LV ∆dP/dtmax≥10%.
Fluoroscopic lead motion analysis
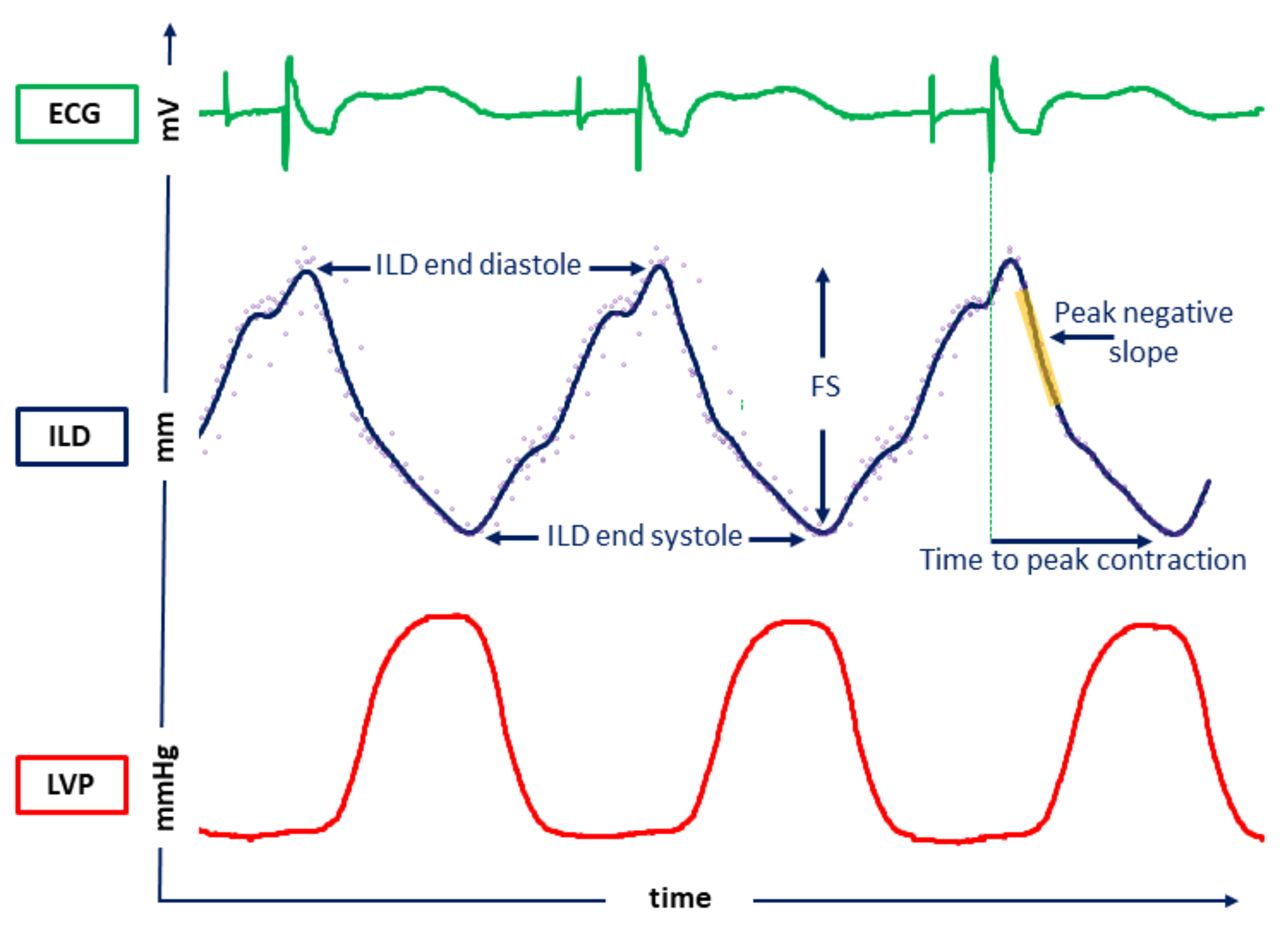
Biplane fluoroscopic cine loops were taken at baseline and under BIVP. A 6-second long sequence was obtained at 30 frames/second, simultaneously from both right anterior oblique (RAO) and left anterior oblique (LAO) views (figure 1). After the patient had left the operating theatre, images of a phantom with small metal beads of a known spiral geometry were taken using the same biplane projections for later offline calibration. Custom Medtronic software was used to first analyse the phantom images to calculate the transformation matrices in order to triangulate the points of interest in 3D space. Sequential points in the phantom spiral were selected on each of the two images and the software then calculated the transformation matrices, the spatial error of the fit to each of the individual beads, the overall average root-mean-square error of all points and the image resolution at isocenter in mm per pixel. The cine loop images were imported into a second custom software program along with the transformation matrices. The software processed each image pair sequentially. In each set of images for a particular frame, the same point of interest was chosen in each of the two images. When completed with all frames, the software output the x, y and z coordinates to a text file. A 3D waveform of the instantaneous interlead distance between the RV tip and the active LV electrode was then constructed, ensemble averaged over all beats and a best fit curve calculated using a piecewise cubic spline. From this waveform, three contractility surrogates were calculated: FS defined by the formula displayed in figure 1; the time to peak contraction defined as the time interval from QRS onset to minimum interlead distance and the peak negative slope defined as the steepest downward part of the waveform in systole (figure 2). Assessment of these contractility surrogates were done both at baseline and under BIVP followed by a calculation of the relative change.

Fluoroscopy taken under CRT implant. Upper image panel display LAO view in end diastole (left) and end systole (right). Lower image panel display RAO view in end diastole (left) and end diastole (right). The ILD is marked in all images and represents the implanting doctor’s 2D view before the 3D calculation is performed. In this patient example, the distal electrode of the quadripolar LV lead was chosen as the active LV electrode. Note that the systolic ILD reduction seems more pronounced in RAO compared with LAO. The formula for FS used after 3D calculation of the ILD is displayed below the fluoroscopic panels. 2D, two dimensional; 3D, three dimensional; FS, fraction shortening; ILD, interlead distance; ILDd, end-diastolic RV–LV ILD; ILDs, end-systolic RV–LV ILD; LAO, left anterior oblique; LV, left ventricular; RAO, right anterior oblique; RA, right atrium lead;RV, right ventricular.

Patient example of the continuous RV–LV ILD waveform under BIVP displayed over time as a signal averaged flow curve. The purple dots represent all the ILD measure points from six consecutive heart beats and through them runs a dark blue waveform constructed using piecewise cubic spline to obtain optimal curve fitting. Corresponding ECG is displayed in green and invasive LVP in red colour. The diastolic and systolic ILD were used to calculate FS. The peak negative slope was defined as the steepest downward part of the systolic curve and is marked in yellow. The peak contraction was defined as the minimum ILD. Time to peak contraction was calculated from the QRS onset represented by the green dotted line. The waveform had a shape that was quite well in line with the principles of cardiac physiology: the peak contraction defined as the minimum ILD occurred in the last part of the electric systole and the LVP started to drop simultaneously with the beginning of lead separation. The leads continued to separate throughout the diastole with a final notch corresponding with the atrial kick. BIVP, biventricular pacing; FS, fraction shortening; ILD, interlead distance; LV, left ventricular; LVP, LV pressure; RV, right ventricular.
Echocardiography
Two-dimensional (2D) echocardiographic studies were performed within 24 hours before scheduled CRT implantation using Vivid E9 (GE Healthcare, Horten Norway). EchoPac V.112 (GE Healthcare) was used for offline analysis. End-diastolic dimension (LVIDd) and end-systolic dimension (LVIDs) were both calculated in a parasternal long-axis view. FS was calculated using the same formula as for interlead distance (figure 1). LV volume and EF were calculated automatically by using the function autoEF in apically two-chamber and four-chamber view.
Statistics
Continuous variables are presented as mean±SD or as median±IQR. Comparisons between groups were performed with independent sample t-test or with Mann-Whitney U test if a non-normal distribution was present. Within-group comparisons were performed using paired student t-test, one sample t-test, Wilcoxon matched-pair signed-rank test and Pearson’s correlation coefficients as appropriate. Dichotomous variables are presented as numbers and were compared with Fisher’s exact test. All statistical analyses were performed with IBM SPSS V.24 software and a p value <0.05 was considered as statistically significant.
Results
Study population
Baseline characteristics of the 27 patients (64±9 years, 78% men) are presented in table 1.
Baseline characteristics
The study group had a mean EF of 28%±6% and QRS width of 173±18 ms. Coronary artery disease was present in 15 (56%) patients. All patients except one had left bundle branch block (LBBB) according to the Strauss criteria.8 A lateral or posterolateral LV lead position with acceptable sensed LV electrical delay (Q-LV: 126±24 ms) and pacing threshold were obtained in all patients.
RV–LV interlead distance and echocardiographic dimensions
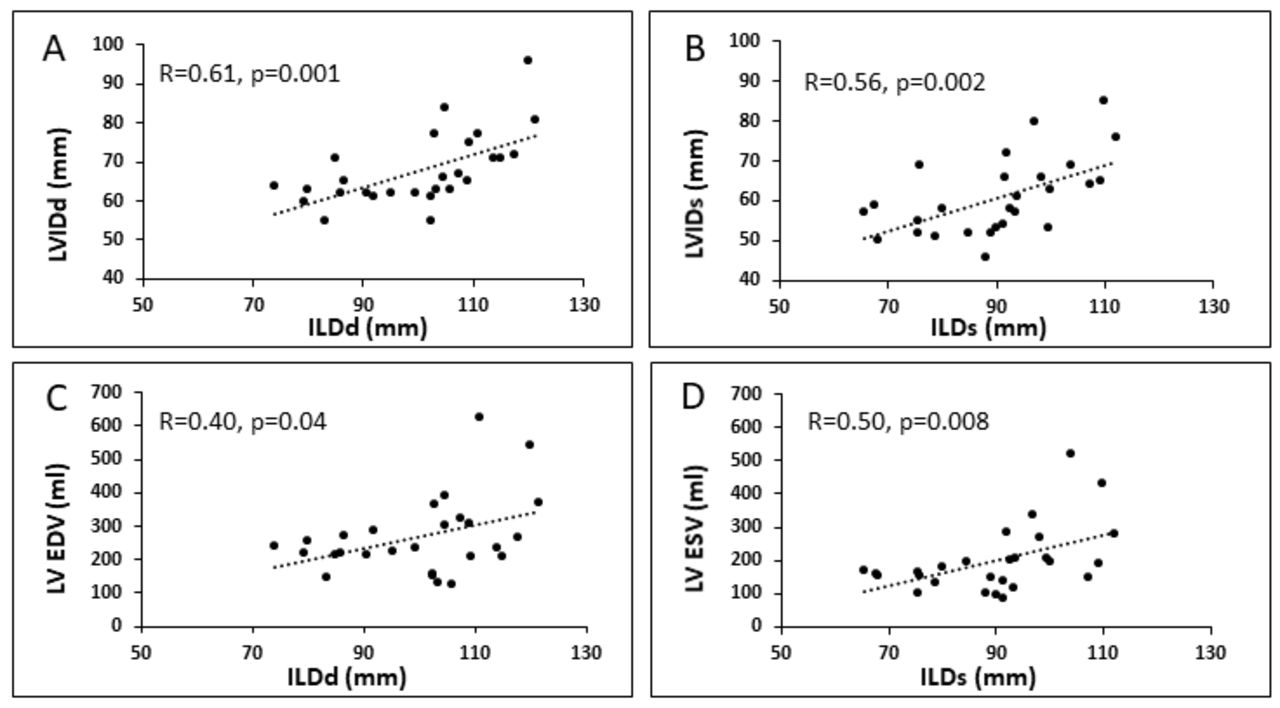
The baseline RV–LV interlead distance was longer in end diastole compared with end systole (102.8±23.0 mm vs 91.4±20.7 mm, p=0.002) and was associated with echocardiographic LV dimensions. We observed a significant correlation between enddiastolic RV–LV interlead distance and LVIDd (R=0.61, p=0.001) and between end systolic RV–LV interlead distance and LVIDs (R=0.56, p=0.002). A slightly weaker, but still significant correlation was observed between RV–LV interlead distance and LV volume both in end diastole and in end systole (R=0.40, p=0.04 and R=0.50, p=0.008), respectively (figure 3).

Scatter plots displaying the linear relationship between the RV–LV ILD and the echocardiographic dimensions in the upper panel (A: end diastole and B: end systole) and between the RV–LV interlead distance and echocardiographic LV volumes in the lower panel (C: end diastole and D: end systole). EDV, end-diastolic volume; ESV, end-systolic volume; ILD, interlead distance; ILDd, RV–LV ILD in end diastole; ILDs, RV–LV ILD in end systole; LV, left ventricular; LVIDd, left ventricular internal end-diastolic diameter; LVIDs, left ventricular internal end-systolic diameter; RV, right ventricular.
Acute haemodynamic response to CRT
Baseline AP and BIVP were both performed at a heart rate of 75±9 beats per minute. The mean paced AV delay was 125±17 ms. We observed a mean increase in LV dP/dtmax from 777±180 mm Hg/s at baseline to 899±205 mm Hg/s under BIVP (p<0.001) (table 2).
Haemodynamic results
Contractility surrogates
The RV–LV interlead distances and the corresponding contractile surrogates are summarised in table 3 and figure 4.
ILD and contractility surrogates

Baseline and BIVP values are presented for all patients with regard to three contractility surrogates (A, B and C) based on waveforms derived from the RV–LV interlead distance. A reduction in fraction shortening (A) and in the time to peak systolic contraction (B) is displayed. No difference was observed in the peak negative slope (C). The acute cardiac resynchronisation therapy responders are marked with individual colours and all non-responders are marked with black colour. Patient example of waveforms at baseline and under BIVP with corresponding ECG is displayed to the right (D). Note the shortening of the time to peak contraction marked with red arrows and the slightly steeper peak negative slope (doted red lines) under BIVP in this patient example. AP, atrial pacing; BIVP, biventricular pacing; LV, left ventricular; RV, right ventricular.
Under BIVP, we observed longer end diastolic than end systolic RV–LV interlead distance (100.9±18.1 mm vs 91.9±22.6 mm, p<0.001). FS under BIVP was, however, significantly lower compared with baseline FS (6.8%±4.4% vs 8.8%±5.4%, p<0.001). The acute CRT responders and the non-responders had similar interlead distance both at baseline and under BIVP. The median FS was higher at baseline than under BIVP in both responders (9.0%±5.3% vs 6.2%±3.9%, p<0.001) and in non-responders (8.6%±5.3% vs 6.8%±6.0%, p=0.008). ΔFS was similar in the acute CRT responders compared with the non-responders (ΔFS: −2.5±2.6% vs −2.0±3.1 %, p=0.50).
The time to peak systolic contraction was shortened under BIVP in both the acute CRT responders (379±51 ms vs 421±70 ms, p<0.01) and in the non-responders (398±14 ms vs 427±78 ms, p=0.04). No difference in the Δtime to peak systolic contraction was observed between the acute CRT responders and the non-responders.
The peak negative slope was similar at baseline and under BIVP for the whole study population (−45.0±17.7 mm/s vs −53.9±34.8 mm/s, p=0.43), in the acute CRT responders (−41.2±21.9 mm/s vs −61.5±45.9 mm/s, p=0.06) and in the non-responders (−48.0±17.8 mm/s vs −46.7±28.4 mm/s, p=0.21). No difference was observed in Δpeak negative slope between the acute CRT responders and the non-responders.
Relationship between contractility surrogates and acute haemodynamic response
We found no association between RV–LV interlead ΔFS and LV ΔdP/dtmax (R=0.16, p=0.41). Similar findings were observed with the other two contractility surrogates used in this study. Neither Δtime to peak systolic contraction (R=0.34, p=0.08), nor Δpeak negative slope (R=0.28, p=0.15) showed any significant association with the acute haemodynamic response to BIVP.
Ischaemic scar distribution
Late enhancement cardiac magnetic resonance (LE-CMR) was performed in a subset of the study population (n=20). Of these, 10 patients (50%) displayed ischaemic scars. We observed no difference in scar presence between the acute CRT responders and the non-responders (n=7 (50%) vs n=3 (50%), p=1.0). The contractility surrogates were similar when comparing patients with and without ischaemic scars (ΔFS: −2.1±2.3 vs −2.5±2.9%, p=0.35; Δtime to peak systolic contraction: −12.9±20.0 vs −9.3±13.9%, p=0.58 and Δpeak negative slope: 0.5±42.1 vs 17.6%±65.1%, p=0.32).
Discussion
This study presents a fluoroscopic technique for LV contractility assessment during CRT implantation. To our knowledge, the intraoperative fluoroscopic 3D distance between the active CRT electrodes has previously not been reported. Our findings show a relationship between fluoroscopic interlead distance and echocardiographic dimensions and volumes indicating both feasibility and accuracy of the baseline measurements. The primary objective of this study was to investigate whether contractility surrogates based on fluoroscopic RV–LV interlead distance waveform feature extraction could predict acute haemodynamic response to CRT. However, we found no encouraging results to support this hypothesis.
The complexity of the cardiac mechanics is substantial in patients with heart failure with delayed electrical activation and it is challenging to fully understand the electrical and mechanical interplay in the CRT population. Patients with LBBB are thought to have an early septal systolic contraction inducing a stretch in the lateral wall. The delayed electrical propagation then activates the prestretched lateral wall resulting in a forceful contraction without any septal counterforce leading to a pronounced lateral wall shortening and subsequent septal rebound stretch.9–12 This mirror image of dyssynchronous mechanical behaviour is meant to be remedied by CRT as the pre-excited lateral wall leads to improved timing of contraction relative to the septum. Introducing BIVP, the now unstretched lateral wall is suddenly exposed to an instant septal counterforce that most likely reduces the lateral wall shortening. This might explain why the instantaneous FS was reduced with BIVP in this study.
As a consequence of an apically positioned RV lead, it might be possible that the contractility surrogates used in this study to a larger extent reflect the lateral wall contraction rather than the global LV function. This may be the reason for why the time to peak contraction was reduced in all patients and not only in the acute CRT responders. It is reasonable to believe that most patients with a lateral electrical delay will benefit from lateral LV pre-excitation with a reduced time to peak contraction regardless of the quality of the local contraction. The slope of the waveform showed a trend towards a steeper curve under BIVP compared with baseline in the acute CRT responders and there was also a trend towards a difference in Δpeak negative slope between responders and non-responders. The slope of the curve is influenced by both contractility and timing. The added complexity of this interplay introduced by pacing makes the risk of causal oversimplification likely when trying to understand why the peak negative slope was unable to discriminate between responders and non-responders.
The internal relation of the RV and LV lead displacement throughout the cardiac cycle is also influenced by the local tissue properties surrounding the lead’s position such as ischaemic scars. The contractility surrogates used in this study were similar in patients with and without ischaemic scars. These results should, however, be interpreted with caution as LE-CMR was performed in a subset of patients. Additionally, with regard to local tissue properties, all RV leads were placed in the RV endocardial apical region in contrast to an epicardial position of the LV lead. Also, the angle of the 3D line of distance between the RV tip and the LV lead depends on the choice of active electrode on the quadripolar LV lead as well as the heart’s orientation and geometry. Thus, the 3D waveform was not derived from two anatomically standardised points of interest equivalent in all patients. In addition, the angle of the interlead line was neither equivalent to a long axis nor a radial axis but rather something in between. In order to obtain a RV–LV waveform on a more radial level, additional calculations were made between the proximal end of the coil of the RV lead and the active LV electrode (data not shown). However, no improved results with regard to the contractility surrogates were observed. Despite these potential methodological weaknesses, the contractility surrogates were measured equally and between the same electrode pair at baseline and under BIVP in each individual.
Niazi et al recently used an electroanatomic mapping system to track the motion of CRT lead electrodes during device implant.13 Their study showed that it was feasible to derive contractility surrogates based on the motion of the CRT electrodes. They did not, however, present contractility surrogate values for intrinsic rhythm and reported no significant differences between RV pacing and BIVP. A more septal RV lead position combined with altered loading conditions (shortened AV delay with RV pacing) in their study might explain why our results were slightly different. In our study, we wanted to simplify the CRT lead tracking using fluoroscopy that has the advantage of being a part of the routinely CRT procedure. In addition, we wanted to investigate the relationship between the contractility surrogates and the haemodynamic changes under BIVP. If contractility surrogates were to be derived successfully from 3D fluoroscopy, no additional equipment in a CRT lab would be necessary. Despite using a 3D system for CRT lead tracking, the RV–LV interlead distance will remain as a line between the two electrodes of interest and even with normal intrinsic electrical propagation, the cardiac contraction has a complex motion pattern with radial and longitudinal shortening in addition to the twisting rotation. Why we were unsuccessful to demonstrate a relationship between the non-invasive contractile surrogates and the acute haemodynamic response in this study still remains unclear, but the most obvious reason is the lack of ability to track larger parts of the ventricle in all directions.
Most studies with RV–LV interlead distance assessment have been performed in 2D using chest radiography.14–16 From a lateral view, increased interlead distance in the horizontal plane as well as increased direct interlead distance, were reported by Heist et al to predict acute haemodynamic response to CRT.14 Long-term results were later reported by Merchant et al showing that interlead distance predicted reverse LV remodelling. In addition, Merchant et al observed a correlation between interlead distance and LV electrical delay supporting that increased interlead distance is an important parameter for successful CRT.15 Both Heist and Merchant reported their interlead distances between the RV lead tip and the LV lead tip corrected for the cardiac size. Despite encouraging results, a 2D postoperative snapshot has its limitations as the interlead distance is measured in one plane irrespective of the cardiac cycle. More importantly, the image is taken after the implant procedure is over. A lateral 2D image may be performed during CRT implantation using fluoroscopy as reported by Covino et al.17 Still, the limitation of single plane assessment is present. RV–LV interlead studies are based on the theory that a large interlead distance could facilitate a larger amount of resynchronisation. However, Richard et al recently reported that QRS duration and its association with long-term CRT benefit is not modified by LV size.18
Recently, also 3D interlead distance was assessed by using the standard post-implant chest radiography and Clementy et al reported that longer interlead distance could predict long-term CRT response.19 Another imaging technique was used for the same purpose by Modi et al.20 Using cardiac CT, the authors showed that the very intriguing parameter, circumferential interlead distance together with the direct interlead distance, could predict reverse remodelling at 6 months. The circumferential interlead distance is the distance along the curvature of the heart also known as the geodesic distance. The geodesic distance might be a more correct way of assessing the interlead distance since it follows the cardiac curvature as the electrical signals. Intraoperative 3D CT imaging may not be a realistic option today. However, a preimplant assessment with visualisation of the coronary sinus tree and a calculation of the potential maximum geodesic distance might be valuable.
In contrast to the studies mentioned above, we used a quadripolar LV lead. A quadripolar LV lead is normally preferred by implanters and provides four alternative electrodes.21 It was the implanter’s privilege to determine each patient’s optimal BIVP pacing vector based on LV electrical delay, pacing threshold and avoidance of phrenic nerve stimulation. In this study, we focused on contractility surrogate assessment using the presumed optimal LV electrode position for each patient, and it was not our intention to maximise the 3D distance between the RV tip and active LV pacing electrode. The uncorrected maximal interlead distance at baseline in this study was not able to discriminate between patients with or without acute haemodynamic response to CRT. This result did not change after correction for cardiac size and body surface area (data not shown). The interlead distance may also be maximised by placing the RV lead as far away as possible from a presumed optimal LV lead position. However, conflicting results have been reported concerning the importance of the RV lead position and we did not investigate the impact of an RV lead repositioning based on the choice of active LV electrode.22
Limitations
This study is limited by a relative low sample size. The contractility surrogates were derived from an interlead distance waveform and not from a standardised plane. According to the study design, the acute haemodynamic response to BIVP under device implantation was used to classify CRT response. The correlation between acute and long-term response to BIVP was not addressed in this study. Neither was the correlation between the contractility surrogates and long-term response to BIVP assessed as reversed remodelling. We did not attempt to optimise the AV-delay or VV-delay (0 ms) during implantation. In selected patients, optimisation may be beneficial.23 Confirmation of the true position of the RV and LV leads with additional imaging modalities was not performed.
Conclusion
Baseline RV–LV interlead distance assessed in 3D using fluoroscopy correlates well with echocardiographic LV dimensions and volumes. Contractility surrogates derived from the RV–LV interlead distance waveform during CRT implantation could, however, not discriminate patients with acute haemodynamic response from non-responders.
References
Footnotes
Contributors HHO, TF, TE, LOG, RC and EK contributed substantially to conception and design. SR, HHO, TF, LOG, TFH, and EK contributed substantially to data collection. SR, HHO, TF, TE, LOG, TFH, RC and EK contributed substantially to analysis and interpretation of data, drafting and revising the manuscript for important intellectual content. SR, HHO, TF, TE, LOG, TFH, RC and EK provided final approval of the submitted manuscript. There is no one else that fulfills the ICMJE recommendations for authorship that has been excluded as an author.
Funding Center for Cardiological innovation (CCI) is funded by the Research council of Norway (project number 203489/o30). PhD candidate Stian Ross has received additional funding from South-Eastern Norway Regional Health Authority (project number 2015054). The study sponsors had no role in the study design; collection, analysis and interpretation of the data; in writing the manuscript or in the decision to submit the paper for publication. Trent Fischer, Lars Ove Gammelsrud and Richard Cornelussen are full time Medtronic employees.
Competing interests Trent Fischer, Lars Ove Gammelsrud and Richard Cornelussen are full time Medtronic employees.
Patient consent for publication Not required.
Ethics approval Regional ethical committe of the South-Eastern Norway Regional Health Authority.
Provenance and peer review Not commissioned; externally peer reviewed.
Data sharing statement No additional data are available.