Article Text

Abstract
Objective This longitudinal study was performed to determine changes in echocardiography parameters in association with various biomarker levels in pregnancy/postpartum.
Methods Fifty-one healthy pregnant women underwent echocardiography with simultaneous determination of blood levels of five biomarkers at each of the first, second and third trimesters of pregnancy, immediately postpartum within 1 week after childbirth and approximately 1 month postpartum. Data on 255 echocardiography scans (five times per woman) and biomarkers were analysed.
Results Left ventricular end-diastolic dimension, left atrial (LA) volume index and left ventricular (LV) mass index increased with advancing gestation and reached the maximum immediately postpartum concomitant with the highest brain natriuretic peptide (BNP), N-terminal pro B-type natriuretic peptide (NT-proBNP), high-sensitivity troponin I (hs-TnI) and creatine kinase MB levels. The inferior vena cava diameter was significantly reduced in the third trimester compared with that in the first trimester and the peak occurred immediately after childbirth. In 255 paired measurements, hs-TnI level was significantly positively correlated with LA volume index and LV mass index; BNP and NT-proBNP were significantly positively correlated with LA volume index and estimated glomerular filtration rate (eGFR) was significantly positively correlated with the average of early diastolic septal and lateral mitral annular velocity (e′).
Conclusions Maximal cardiac changes in morphology occurred postpartum within 1 week after childbirth, not during pregnancy. BNP/NT-proBNP, hs-TnI and eGFR reflected cardiac changes in pregnancy.
- echocardiography
- obstetrics
- heart failure
This is an open access article distributed in accordance with the Creative Commons Attribution Non Commercial (CC BY-NC 4.0) license, which permits others to distribute, remix, adapt, build upon this work non-commercially, and license their derivative works on different terms, provided the original work is properly cited, appropriate credit is given, any changes made indicated, and the use is non-commercial. See:http://creativecommons.org/licenses/by-nc/4.0/.
Statistics from Altmetric.com
Key questions
What is already known about this subject?
Cardiac morphofunction within 1 week after childbirth has not been studied, although heart failure in pregnant women occurs most often within 1 week after childbirth. It has not been determined whether cardiac biomarkers reflect changes in cardiac morphofunction occurring in pregnancy.
What does this study add?
The maximal cardiac change occurred within 1 week after childbirth and not during pregnancy. Brain natriuretic peptide, high-sensitivity troponin I and estimated glomerular filtration rate reflected cardiac changes in pregnancy/postpartum.
How might this impact on clinical practice?
Brain natriuretic peptide, high-sensitivity troponin I and estimated glomerular filtration rate can be used to estimate cardiac morphofunction in pregnancy and may be helpful to identify women at higher risk of adverse cardiac events.
Introduction
The blood volume increases by approximately 40% in pregnancy,1 leading to morphological and functional cardiac changes, such as increased left ventricular (LV) mass,2–4 increased left atrial (LA) volume2 3 and significantly reduced early to late diastolic transmitral flow velocity ratio (E/A)2 4 by the onset of labour. A further increase in cardiac output may occur during labour because autotransfusion of 300–500 mL of blood from the uterus into the systemic circulation occurs after each uterine contraction.5 The uterine body volume, approximately 1000 cm3 before delivery, decreases to 440 cm3 on postpartum day 7 in healthy women.6 As water and sodium accumulated in the interstitial space during pregnancy shift into the circulation, the blood volume may increase further during the first few days postpartum and cardiac load may therefore reach the maximum during this period. This may explain the transient rise in N-terminal pro B-type natriuretic peptide (NT-proBNP) on postpartum day 37 and why heart failure is most likely to occur within 1 week after childbirth among women with structural heart diseases.8 However, there have been no reports addressing the immediately postpartum cardiac morphofunction within 1 week after childbirth.
Heart failure can occur in pregnant women. Clinical symptoms associated with heart failure, such as fatigue, shortness of breath, and oedema, are relatively common even in healthy pregnant women. It is considered beneficial to screen pregnant women at higher risk of heart failure before echocardiography using biomarkers, such as brain natriuretic peptide (BNP)/NT-proBNP and troponin I. Elevated levels of both troponin I and NT-proBNP are seen in patients with heart failure caused by peripartum cardiomyopathy,9 10 and high-sensitivity troponin T retains prognostic value in patients with chronic heart failure.11–13 However, there have been few studies regarding the associations between biomarker levels and echocardiography findings in pregnancy.14–17
This longitudinal prospective study was conducted to characterise changes in cardiac structures and function in normal pregnancies, especially during the period immediately postpartum when cardiac load may reach the maximum, in association with changes in five biomarkers and to determine which biomarkers changed with changes in cardiac morphology and function.
Methods
This prospective observational study was performed in accordance with the provisions of the Declaration of Helsinki and was conducted after receiving approval from the Institutional Review Board of Hokkaido University Hospital (013–0262, 4 April 2014). Written informed consent was obtained from all participants prior to enrolment in the study.
Participants
This project began in April 2014. All pregnant women scheduled to give birth at Hokkaido University Hospital were invited to participate in this study. All participants were recommended to undergo echocardiography at each of the first (~136/7 gestational weeks), second (140/7~276/7 gestational weeks) and third (280/7 gestational weeks ~) trimesters of pregnancy, immediately postpartum within 1 week after childbirth (designated as ‘PP1’) and approximately 1 month postpartum (designated as ‘PP2’) on enrolment and to provide blood samples at the same time as each echocardiography scan. In this study, we analysed 51 women fulfilling all of the following three criteria (1) those that underwent these tests during all five stages of pregnancy/postpartum, including first, second and third trimesters, PP1 and PP2; (2) no hypertensive disorders of pregnancy, including chronic hypertension, gestational hypertension and preeclampsia, in the current pregnancy and (3) absence of diseases, including hypothyroidism, systemic lupus erythematosus, IgA nephropathy, diabetes mellitus, Basedow’s disease, Cushing’ disease, essential thrombocythaemia, immune thrombocytopenic purpura, polycystic kidney, rheumatoid arthritis and Sjogren’s syndrome, at the establishment of the current pregnancy. These 51 women were uncomplicated and normotensive throughout pregnancy with uneventful pregnancies.
Echocardiography evaluation
Bedside transthoracic echocardiography, including two-dimensional, colour Doppler and tissue Doppler imaging, was performed by a single trained operator (TU) using the same machine (ProSound α7; Hitachi, Tokyo, Japan) according to the European Association of Cardiovascular Imaging.18 B-mode recordings, including parasternal and apical views with pulsed and continuous wave Doppler evaluation, were performed with subjects in the left lateral decubitus position. Stroke volume was calculated as the product of aortic valve area and the aortic flow-velocity time integral. Only the inferior vena cava (IVC) diameter was evaluated in dorsal position. To avoid any possible performance bias, TU performed echocardiography blinded to the biochemical data.
Biochemical procedures
Serum and plasma were collected at the time of each echocardiography scan and stored at –20°C until assays of the following five biomarkers: high-sensitivity troponin I (hs-TnI), NT-proBNP, BNP, creatine kinase MB (CK-MB) and estimated glomerular filtration rate (eGFR) obtained using the following equation: 0.739×194× serum creatinine–1.094×age (years)–0.287.19 The hs-TnI, BNP, CK-MB and NT-proBNP concentrations were measured using CIA kits (ARCHITECT High-Sensitivity Troponin-I, ARCHITECT BNP-JP and ARCHITECT CK-MB (Abbott Japan, Chiba, Japan) and Elecsys proBNP II STAT Assay (Roche Diagnostics K.K., Tokyo, Japan), respectively).
Statistical methods
Statistical analyses were performed using JMP Pro12 (SAS, Cary, North Carolina, USA) and the SPSS Statistics V.24.0 (IBM, Armonk, New York, USA). Changes in variables within a group were compared using Wilcoxon’s rank sum test and Student’s t-test with Bonferroni’s correction. Relations of the echocardiography parameters with biomarker levels at five time points were tested using the mixed effect model to consider the correlation of each time point. Dependent (echocardiography parameters) and independent (biomarker levels) variables were standardised to interpret the regression coefficient as the correlation coefficient. The covariance structure at each time point was compound symmetry. In all analyses, p<0.05 was taken to indicate statistical significance. However, a significant finding regarding a linear correlation between two standardised variables was defined as that meeting both p<0.05 and standardised regression coefficient (β)>0.25 or <–0.25.
Results
The 51 women with normotensive uncomplicated singleton pregnancies underwent simultaneous echocardiography and blood sampling 255 times (table 1). Twenty-four of the 51 women (47%) underwent Caesarean section (CS). Changes in maternal physical findings during pregnancy/postpartum are shown in table 2. The mean (SD) weight and body surface area gains in pregnancy were 17.2 (8.0)% and 6.9 (3.2)%, respectively in these 51 women.
Demographic characteristics of 51 women with uncomplicated singleton pregnancies
Echocardiographic and blood parameters in 51 women with uncomplicated singleton pregnancies
Changes in echocardiography parameters
Most echocardiography variables, including those associated with cardiac function, changed significantly during pregnancy/postpartum compared with baseline levels obtained during the first trimester (table 2). LV end-diastolic dimension (LVDd), interventricular septal thickness, LV posterior wall thickness, LV mass, LA volume and cardiac output increased with advancing gestation, reaching their peak values at PP1, suggesting increased volume load and a likelihood of LV hypertrophy peripartum (table 2, figure 1). Systemic vascular resistance was consistently lower until PP1 on and after the second trimester (table 2). The IVC diameter decreased significantly in the third trimester despite a significant increase in volume load and increased significantly after childbirth. E/A decreased significantly and the ratio of systolic pulmonary venous flow velocity to anterograde diastolic pulmonary venous flow velocity (S/D) increased significantly with advancing gestation, suggesting a likelihood of LV diastolic dysfunction peripartum. The average of early diastolic septal and lateral mitral annular velocity (e′), as an index of LV relaxation, was higher during the first and second trimesters compared with the third trimester and postpartum. The ratio of early diastolic mitral flow velocity (E) to e′ (E/e′) as an index of LV filling pressure increased significantly at PP1 due to the acute increase in E (table 2).

Changes in eight representative echocardiographic measurements during pregnancy/postpartum. *P<0.05 vs baseline value determined during the first trimester. Vertical bars indicate ±SE. IVC, inferior vena cava; LA, left atrial; LV, left ventricle; LVDd, left ventricular end-diastolic dimension.
Changes in blood variable levels
All blood variables changed significantly during pregnancy and/or postpartum (table 2, figure 2). Cardiac biomarkers, including NT-proBNP/BNP, hs-TnI and CK-MB, showed peaks in PP1. The increased eGFR during pregnancy decreased significantly immediately postpartum.
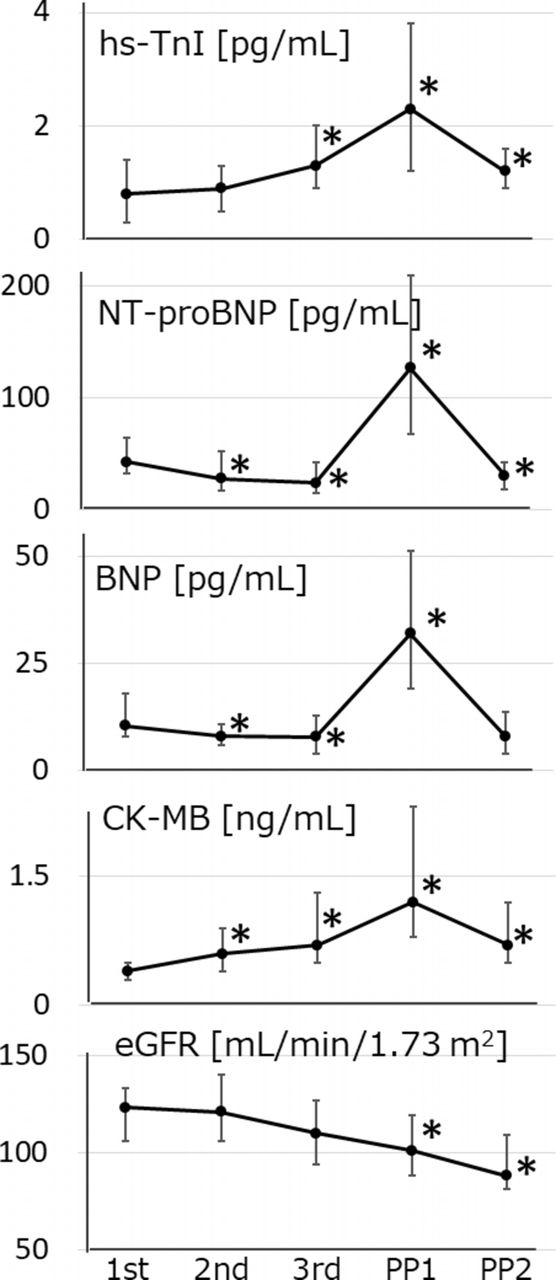
Changes in levels of blood biomarkers during pregnancy/postpartum. *P<0.05 vs baseline value determined during the first trimester. Vertical bars indicate 25th–75th percentile values (see table 2 for median (5th–95th) value). Data on BNP were determined in a limited number of women (see footnote for table 2). BNP, brain natriuretic peptide; CK-MB, creatine kinase MB; eGFR, estimated glomerular filtration rate; hs-TnI, high-sensitivity troponin I; NT-proBNP, N-terminal pro B-type natriuretic peptide.
Effects of Caesarean section on variable levels determined immediately postpartum
Peripartum fluid replacement (4.5±0.6 vs 1.0±0.5 L) were significantly greater in women with CS than vaginal delivery (VD) (table 3). The third trimester tests including echocardiography and simultaneous blood tests were performed at a similar gestational week (mean±SD, 36.4±0.5 vs 36.5±0.7 for CS vs VD group, respectively). The tests were again performed immediately postpartum in the both groups (on postpartum day 3.3±0.9 vs 3.3±0.8 for CS vs VD group, respectively) (table 3). Net weight loss during several days after delivery until the postpartum test was significantly lesser in CS than VD group (2.9±1.5 vs 4.6±1.4 kg) (table 3). Most variables changed significantly immediately postpartum irrespective of delivery modes; for example, LA volume index, IVC diameter, E/e′, NT-proBNP and hs-TnI were significantly greater immediately postpartum than antepartum in both groups (figure 3). Postpartum LA volume index and NT-proBNP levels were significantly greater in CS than VD group, while postpartum hs-TnI and CK-MB levels were significantly greater in VD than CS group (figure 3, table 4).
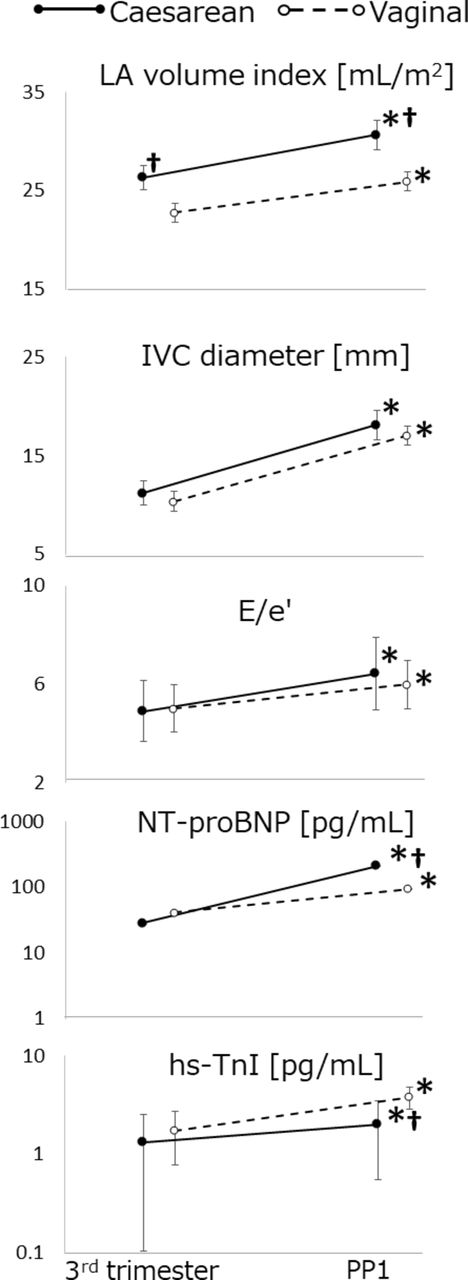
Comparison of peripartum changes in LA volume index, IVC diameter, E/e′, NT-proBNP and hs-TnI between women with Caesarean section and vaginal delivery. *P<0.05 vs value determined during the third trimester. †P<0.05 between two groups. Vertical bars indicate ±SE. hs-TnI, high-sensitivity troponin I; IVC, inferior vena cava; LA, left atrial; NT-proBNP, N-terminal pro B-type natriuretic peptide.
Characteristics of Caesarean section and vaginal delivery
Peripartum changes in blood parameter levels in women with Caesarean section vs vaginal delivery
Associations between various blood variable levels and echocardiography measurements
All five blood variables shown in figure 2, including eGFR, were analysed with regard to correlations with five measurements on echocardiography, that is, LVDd, LA volume index, LV mass index, LV ejection fraction (LVEF) and e′. All of the blood variables except eGFR were significantly positively correlated with LA volume index, BNP was the best predictor of LA volume index, only hs-TnI was significantly correlated with LV mass index and only eGFR was correlated significantly with e′ (figure 4). None of the blood variables was significantly correlated with LVDd or LVEF.

Standardised regression coefficients between blood variable levels and echocardiographic measurements. β, standardised regression coefficient. Regression line was drawn for β>0.25 or <–0.25. When hs-TnI level was below the limit of detection (0.1 pg/mL), we assumed that hs-TnI was present at a serum concentration of 0.1 pg/mL. BNP, B-type natriuretic peptide; CK-MB, creatine kinase MB; eGFR, estimated glomerular filtration rate; hs-TnI, high-sensitivity troponin I; IVC, inferior vena cava; LA, left atrial; LV, left ventricle; LVDd, left ventricular end-diastolic dimension; LVEF, LV ejection fraction; NT-proBNP, N-terminal pro B-type natriuretic peptide.
Discussion
This was the largest longitudinal study to date examining associations between changes in echocardiography parameters and blood variables determined simultaneously in healthy women with uncomplicated pregnancies. This study yielded the following novel findings: (1) pregnancy-induced cardiac changes in morphology reached the maximum during the early postpartum period, within 1 week after childbirth, not during the late stage of pregnancy; (2) IVC diameter was significantly reduced in the third trimester despite significantly increased volume load, as evidenced by significant increases in LA volume index and LVDd, and showed the peak value immediately after childbirth and (3) all cardiac biomarkers examined (including hs-TnI, BNP/NT-proBNP and CK-MB) showed peak values immediately postpartum, hs-TnI was significantly positively correlated with LA volume index and LVmass index, BNP/NT-proBNP was significantly positively correlated with LA volume index and eGFR was significantly positively correlated with e′.
In this study, morphological cardiac changes reached the maximum during the early postpartum period, within 1 week after childbirth, not during the late stage of pregnancy irrespective of modes of delivery, suggesting that cardiac volume load is most likely to occur during the early postpartum period. Although expected, this phenomenon was documented here for the first time, as many investigators have focused on cardiac changes during pregnancy and not during the early postpartum period.2–4 20–27 To our knowledge, there have been no reports of echocardiography performed immediately postpartum within 1 week after childbirth. In previous reports dealing with postpartum echocardiography findings, echocardiography was performed at 2–4 weeks postpartum,21 22 1–3 months postpartum,23 3–6 months postpartum,3 4 20 24 25 3–12 months postpartum26 27 and 1 year postpartum.2 The increase in water retention during pregnancy is reversed by parturition. The interstitial water accumulated during pregnancy also returns to the intravascular space postpartum. In addition, the blood that perfused the placenta and gravid uterus may also have returned to the general circulation with involution of the uterus after childbirth. These may have outweighed the volume loss occurring postpartum with bleeding at birth and subsequent lactation. Alternatively, our observations in the immediately postpartum period may have been a hangover effect of term pregnancy and labour.
The IVC diameter was significantly reduced in the third trimester compared with that in the first trimester and increased abruptly showing the peak value immediately after childbirth. Reduced IVC diameter in the third trimester may have resulted from compression by the enlarged gravid uterus. Lifting of IVC compression occurring immediately after childbirth may have caused an abrupt increase in venous blood return to the heart. This may have placed further strain on the heart that had adapted to tolerate the physiological increase in circulating blood volume in pregnancy. This together with the increased circulating blood volume perhaps occurring in the early postpartum period may have additively contributed to significant increases in hs-TnI, BNP/NT-proBNP and CK-MB levels occurring in the early postpartum period in healthy women.
BNP reached the maximum in the early postpartum period and exhibited a significant positive correlation with LA volume index in this study, consistent with the physiological role of BNP as a bioactive natriuretic hormone; BNP is produced in cardiomyocytes and released into the circulation in response to ventricular stretching, reducing preload and afterload. However, there may have been a somewhat different implication in the present study that the hs-TnI exhibited a significant increase immediately postpartum within 1 week after childbirth and was significantly correlated with LA volume index and LV mass index even in normal pregnant women. In an animal model, increased external load initially induced cardiac hypertrophy with preserved contractility and sustained overload eventually led to heart failure through pathological cardiac remodelling28 with low capillary density and replacement with fibrosis.28 29 Replacement myocardial fibrosis is associated with increased plasma hs-TnI concentration.29 Cardiac troponin can reflect myocyte injury and predict the outcome of heart failure in fields outside obstetrics.29 30 The significant rise in hs-TnI occurring in the early postpartum period in this study suggested that transient myocyte injury with or without pathological cardiac remodelling occurred even in normal pregnant women postpartum. This was supported by a recent study indicating that a significant proportion of women with apparently normal pregnancies showed cardiovascular maladaptation to the volume-overloaded state at term.2
Interestingly, postpartum hs-TnI and CK-MB levels were significantly higher in women with VD than CS (figure 3, table 4). As CK-MB is expressed in the uterine muscle and its blood level increases after VD,31 32 as was seen in this study but not after CS, the elevated CK-MB may have been derived from the uterine muscle that experienced labour pains. In contrast to CK-MB, TnI is only expressed in the cardiac muscle33 and is considered as a biomarker suggesting myocardial damage.33 The hs-TnI increased significantly after VD as well as CS in this study. In an earlier report on perinatal changes in TnI,32 a significant increase in TnI level was observed in women after uneventful VD. It was speculated that minimal myocardial damage was more likely to occur during parturition with VD than CS.
There have been few studies regarding the associations between biomarker levels and echocardiography findings in pregnancy. Only a few previous reports addressed the associations between biomarker levels and echocardiographic measurements in pregnant women.14–17 These reports dealt with only NT-proBNP/BNP levels in pregnant women. To our knowledge, there have been no reports addressing the association of cardiac status on echocardiography with cardiac troponin and eGFR in pregnant women. A significant positive correlation was observed between eGFR and e′ as an index of LV relaxation in this study, consistent with findings in non-pregnant subjects.34 This suggested that reduced eGFR reflects decreased e' causing increased E/e' as an index of LV end-diastolic pressure. Pulmonary congestion as a sign of heart failure may be likely to occur under such conditions with increased LV end-diastolic pressure.
Limitations of this study
Early suspicion of heart failure is required to prevent major adverse events, such as death or the necessity for heart transplantation occurring in peripartum cardiomyopathy. Elevated levels of both troponin I and NT-proBNP are seen in patients diagnosed with peripartum cardiomyopathy.9 This study suggested that hs-TnI, BNP/NT-proBNP and eGFR reflected cardiac load/overload and myocardial relaxation in pregnant women, although the correlations were not sufficiently strong for biomarkers to predict cardiac status on echocardiography. As no women with heart failure were included in this study, we were not able to determine clinical usefulness of hs-TnI and BNP/NT-proBNP in pregnant women.
Conclusion
Maximal cardiac changes in morphology occur postpartum within 1 week after childbirth, not during pregnancy. This explains why heart failure is most likely to occur within 1 week after childbirth among women with structural heart diseases.8 Not only BNP/NT-proBNP but also hs-TnI and eGFR reflect cardiac changes in pregnancy. These biomarkers may contribute to early detection of women at higher risk of adverse cardiac events.
References
Footnotes
Contributors All authors participated in the design of the study and collected data on each pregnant woman that participated in this study. TU participated in design of the study, performed statistical analyses and drafted the manuscript. HM conceived of the study and participated in its design and coordination and helped to draft the manuscript. All authors read and approved the final manuscript.
Funding This study was supported by a Grant-in Aid for Scientific Research from the Ministry of Education, Science, Sports, and Culture of Japan (No. 2646246804). This work was not associated with any commercial entity.
Competing interests None declared.
Patient consent Obtained.
Ethics approval Institutional Review Board of Hokkaido University Hospital.
Provenance and peer review Not commissioned; externally peer reviewed.