Article Text

Abstract
Objectives To evaluate a Framingham 5-year cardiovascular disease (CVD) risk score in Indians and Europeans in New Zealand, and determine whether body mass index (BMI) and socioeconomic deprivation were independent predictors of CVD risk.
Methods We included Indians and Europeans, aged 30–74 years without prior CVD undergoing risk assessment in New Zealand primary care during 2002–2015 (n=256 446). Risk profiles included standard Framingham predictors (age, sex, systolic blood pressure, total cholesterol/high-density lipoprotein ratio, smoking and diabetes) and were linked with national CVD hospitalisations and mortality datasets. Discrimination was measured by the area under the receiver operating characteristics curve (AUC) and calibration examined graphically. We used Cox regression to study the impact of BMI and deprivation on the risk of CVD with and without adjustment for the Framingham score.
Results During follow-up, 8105 and 1156 CVD events occurred in Europeans and Indians, respectively. Higher AUCs of 0.76 were found in Indian men (95% CI 0.74 to 0.78) and women (95% CI 0.73 to 0.78) compared with 0.74 (95% CI 0.73 to 0.74) in European men and 0.72 (95% CI 0.71 to 0.73) in European women. Framingham was best calibrated in Indian men, and overestimated risk in Indian women and in Europeans. BMI and deprivation were positively associated with CVD, also after adjustment for the Framingham risk score, although the BMI association was attenuated.
Conclusions The Framingham risk model performed reasonably well in Indian men, but overestimated risk in Indian women and in Europeans. BMI and socioeconomic deprivation could be useful predictors in addition to a Framingham score.
- coronary artery disease
- stroke
- epidemiology
- risk stratification
- risk factors
This is an open access article distributed in accordance with the Creative Commons Attribution Non Commercial (CC BY-NC 4.0) license, which permits others to distribute, remix, adapt, build upon this work non-commercially, and license their derivative works on different terms, provided the original work is properly cited, appropriate credit is given, any changes made indicated, and the use is non-commercial. See: http://creativecommons.org/licenses/by-nc/4.0/.
Statistics from Altmetric.com
Key questions
What is already known about this subject?
South Asians have a high burden of cardiovascular disease (CVD) compared with other ethnic groups.
Although many risk prediction models exist, most prediction models are derived based on information from Caucasian populations and few studies have examined the performance of cardiovascular risk models in South Asian populations.
What does this study add?
Our study showed that a Framingham risk model predicted the 5-year risk of CVD in Indian men reasonably well, but overestimated risk in Indian women and in European men and women.
We also found that BMI and deprivation could be useful predictors of CVD risk in addition to a Framingham risk score.
How might this impact on clinical practice?
Our findings demonstrate a need for improved methods for assessing cardiovascular risk in Europeans and Indians in New Zealand.
Introduction
South Asians (people originating from the Indian subcontinent) constitute almost a quarter of the world’s population, and have a high burden of cardiovascular disease (CVD) compared with other ethnic groups.1 International guidelines recommend calculation of absolute cardiovascular risk based on multiple risk factors.2 3 Cardiovascular risk prediction models facilitate identification of high-risk patients and could help reduce the excess risk of CVD in South Asians. For a risk model to be clinically useful, however, it should be externally validated, ideally in the population where it is applied.4 Few studies have evaluated the performance of cardiovascular risk models in South Asian populations.5
In the Auckland and Northland regions of New Zealand, cardiovascular risk assessments have been part of routine clinical care since the establishment of the PREDICT-CVD cohort in 2002.6 A new CVD risk prediction equation for the New Zealand population has just been published,7 but until recently, New Zealand guidelines2 recommended general practitioners to use a modified 1991 Framingham risk equation8 to predict patients’ 5-year risk of developing CVD. This Framingham score is based on information collected >40 years ago in a cohort of white working-class and middle-class Americans.8 The validity of Framingham for the contemporary New Zealand population has been questioned, especially regarding high-risk groups such as South Asians.6 A previous validation study of the Framingham equation in ethnic groups in New Zealand lacked sufficient person-time follow-up to study the groups separately. Indian, Māori and Pacific people were therefore combined into one ‘high-risk’ group and analysed together.9 Indians comprised only 11%–12% of this combined group.
We now have sufficient follow-up time to study the performance of the Framingham score in Indians in New Zealand. We therefore aimed to study the discrimination and calibration performance of the Framingham risk score among Indians and Europeans. Body mass index (BMI) and social deprivation are known CVD risk factors.10 11 The second aim was to determine whether these factors improved CVD risk prediction over and above the Framingham score.
Methods
Study population and study setting
The study population consisted of individuals risk assessed in New Zealand primary care between August 2002 and October 20156 using web-based decision support software called PREDICT. The PREDICT software was first implemented in Auckland general practices in 2002 and about 35%–40% of New Zealand general practices now use this software. It is mainly used in the Auckland and Northland regions, which represent around 38% of the New Zealand resident population.12 The PREDICT study is an open cohort study continuously recruiting new participants whenever primary care practitioners complete standardised risk assessments using the PREDICT software. The study is described in detail elsewhere.6 For these analyses, we included participants of South Asians or European ethnicity aged 30–74 years, with no history of CVD at baseline (individuals with CVD diagnosed solely in primary care, with a previous CVD hospitalisation or with congestive heart failure) (figure 1). This is a prospective cohort study, and the participants were followed until 31 December 2015.

Flow chart showing the numbers of persons at each stage of participant selection. CVD, cardiovascular disease; eGFR, estimated glomerular filtration rate; HDL, high-density lipoprotein; TC, total cholesterol.
Risk factors
Systolic blood pressure (SBP) was based on the mean of the two last recordings done by primary care practitioners. Blood lipids, glucose or glycated haemoglobin measurements were undertaken in community laboratories while smoking status and other risk factors were gathered on a standard electronic template completed by primary care practitioners. BMI was calculated as weight in kilograms divided by the square of height in metres (kg/m2). The exact time of the BMI measurement is unknown, but it was either at the time of the index risk assessment or before. The most recent BMI measure was used. We divided BMI into four categories: underweight (<18.5), normal weight (18.5–24.9), overweight (25.29.9) and obesity (30+). The New Zealand Index of Socioeconomic Deprivation (NZDep) is a New Zealand area-based socioeconomic deprivation score based on information from the national censuses using nine variables that reflect eight dimensions of deprivation (income, owned home, support, employment, qualifications, living space, communication and transport).13 A deprivation score is provided for each meshblock in New Zealand. Meshblocks are geographical units defined by Statistics New Zealand. The New Zealand deprivation index relates to these small areas and not to individuals. The New Zealand deprivation index is presented as a decile score and is linked to most New Zealand health records. The deciles are based on the distribution of the first principal component score for the New Zealand deprivation index, where, decile 10 indicates residence in the 10% of the most deprived census meshblocks in New Zealand. For these analyses, we combined each set of two deciles to provide a quintile score (ie, quintile 1=deciles 1 and 2 (least deprived) through quintile 5=deciles 9 and 10 (most deprived).
Data linkage
Most New Zealanders (about 98%) have a unique National Health Identifier (NHI), assigned through contact with healthcare services in New Zealand.14 An encrypted NHI was used to link the risk factor profiles from the PREDICT cohort with information from national health databases including all public hospitalisations, deaths, publicly funded drug dispensing and regional laboratory test results.6
Definition of outcome
We identified first CVD events (fatal and non-fatal) through the national hospitalisation and mortality databases using International Classification of Disease-10-Australian Modification (ICD-10-AM) codes.15 CVD included primary and secondary hospitalisation codes or underlying cause of death from one of the following conditions: coronary heart disease (CHD), congestive heart failure, haemorrhagic or ischaemic stroke, transient ischaemic attack, peripheral vascular disease and other CVD-related deaths. Online supplementary table A1 shows the corresponding ICD-10-AM codes.
Supplemental material
Ethnicity
Self-identified ethnicity data are routinely available for almost every New Zealander and came from the National Health Index dataset, coded according to predefined categories. In the case of multiple recorded ethnicities, a prioritising algorithm was used.16 The ethnicity coding system for health data in New Zealand enables identification of Indian people (including Fijian Indians), but not other South Asians (such as Sri Lankans, Pakistanis, Bangladeshis or Nepalese). However, Indians account for almost 90% of South Asians in New Zealand,17 and the majority are immigrants.18 The Indian ethnic group does not include other Asian ethnic subgroups such as Chinese or South East Asians.
The Framingham risk score
We calculated the 5-year risk of CVD using a 1991 Framingham risk equation.8 The Framingham predictors are age, sex, SBP, total cholesterol (TC)/high-density lipoprotein (HDL) ratio, smoking (yes/no) and diabetes (yes/no).8 As recommended by the New Zealand Guidelines Group, individuals who recently quit smoking (within 12 months) were considered as smokers for the risk score.2
Statistical analyses
We measured discrimination of the Framingham score (the ability of the score to differentiate between those who experience an event and those who do not) by the area under the receiver operating characteristics (ROC) curve (AUC).19 We additionally calculated the Harrell’s C to take censoring into account.20 We present a calibration plot of predicted minus observed event rates (calculated by the life table method) within deciles of predicted risk. When evaluating the Framingham score performance, we restricted the follow-up to maximum 5 years (counting CVD events until 5 years after baseline and resetting the person-time to 5 years for those with >5 years person-time at risk). We used Cox regression to study the impact of BMI and deprivation on the risk of CVD in Indians and Europeans with and without adjustment for the Framingham risk score. For these analyses, all available follow-up was included. Possible interaction was examined by including an interaction term in the Cox model. Only complete cases were analysed. We checked if inclusion of BMI or deprivation index in a 5-year prediction model based on Cox regression, improved AUC or Harrell’s C compared with Framingham alone. Proportional hazards assumptions were tested using Schoenfeld residuals and log-log plots. All analyses were performed using Stata V.14.
Sensitivity analyses
The younger participants in PREDICT have high levels of risk factors (results not shown). We therefore repeated the calibration analyses excluding men aged <45 years and women aged <55 years to see whether calibration altered. These sex-specific age cut-offs refer to the ages when risk assessment is currently recommended for the general New Zealand population (asymptomatic and without known risk factors).2
Results
Participant numbers and CVD events
A total of 222 083 European (43% women) and 34 383 Indian (41% women) participants aged 30–74 years without prior CVD were enrolled in the PREDICT-CVD cohort between August 2002 and December 2015. The participants were followed for a mean of 4.2 years.
During the first 5 years of follow-up, we identified 6065 CVD events among Europeans and 886 CVD events among Indians. When all available follow-up time was included, 8105 CVD events occurred among Europeans and 1156 CVD events among Indians.
Baseline characteristics
Women were older than men, and Indians around 6–8 years younger than Europeans (table 1); both age differences reflect New Zealand guideline recommendations that asymptomatic men should be risk assessed 10 years earlier than asymptomatic women and Indians 10 years earlier than Europeans.2 TC/HDL ratios were higher in Indians than Europeans, and diabetes prevalence was more than threefold higher in Indians than Europeans. Ethnic differences in TC/HDL ratios and diabetes prevalence persisted after adjustment for age, although the differences in TC/HDL ratio diminished (not shown). Diabetes prevalence was high among the youngest participants (not shown), also reflecting guideline recommendations that people with known risk factors or at high risk of developing diabetes should be risk assessed 10 years earlier than others.21 People with diabetes generally have a risk assessment at the time of diagnosis and are thus automatically included in the PREDICT cohort, whatever their age.21 Indians had lower mean SBP than Europeans, but these ethnic differences became smaller after adjustment for age (after adjusting for age the difference between the ethnic groups was 2.2 mm Hg in men and 1.5 mm Hg in women). Indians smoked less than Europeans, with minimal recorded smoking among Indian women.
Baseline characteristics of study population, PREDICT, unadjusted
Indian men had lower mean levels of BMI and were less overweight or obese than European men while Indian and European women had similar BMI levels (table 1). Indians lived in more deprived areas than Europeans with around 50% belonging to the two most deprived quintiles (quintiles 4–5). For Europeans, this percentage was around 25%.
Predicted and observed risk
Europeans had higher Framingham predicted 5-year risk than Indian participants (table 2); however, this largely reflected their older age, especially men. The observed 5-year event rates were lower than the predicted rates in all groups except Indian men where the observed and predicted event rates were similar. The observed 5-year event rates were similar in the two ethnic groups despite Europeans being considerably older than Indians.
Mean values of Framingham 5-year risk scores and observed 5-year event rates
The Framingham score discriminated better in Indians than in Europeans with AUCs of 0.76 in Indian men and women (table 3) compared with 0.74 in European men and 0.72 in European women. Harrell’s C was slightly lower than the AUC for all subgroups. The Harrell’s C was also higher in Indians than in Europeans, with the highest value of 0.75 (95% CI 0.73 to 0.77) in Indian men.
Discrimination ability of the Framingham (1991) model
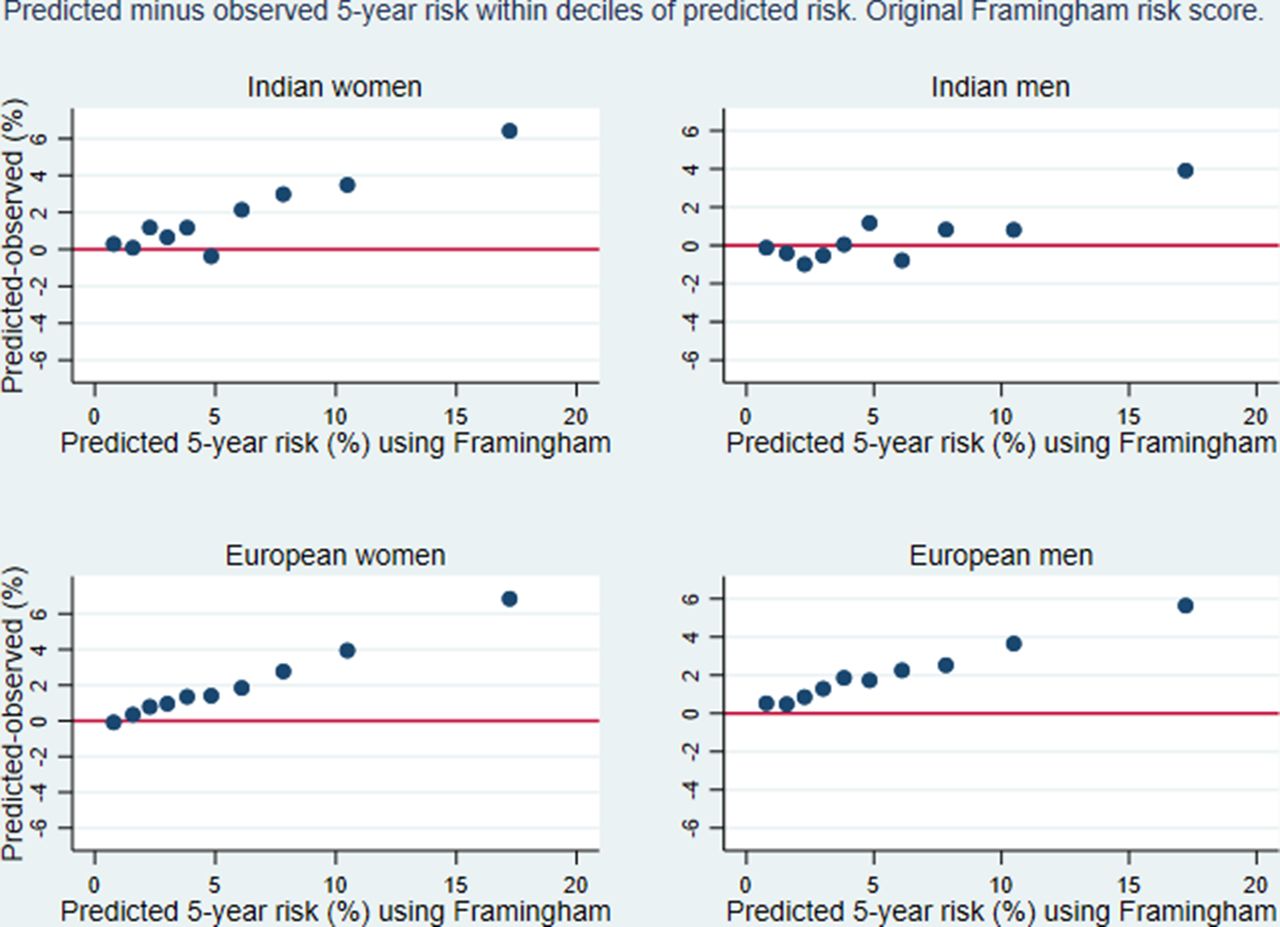
The calibration plot (figure 2) showed that the Framingham 5-year risk score generally overestimated risk in higher deciles of predicted risk, especially in Europeans. The best correspondence between predicted and observed event rates was seen in Indian men.
Calibration plot showing predicted minus observed 5-year event rates within deciles of predicted risk using the original Framingham risk score by Anderson et al 1991.
In age-adjusted analyses, BMI was significantly associated with risk of CVD in both ethnic groups (table 4). From BMI≥18.5, we found an increasing risk of CVD with increasing BMI in both categorical and continuous analyses. After adjustment for the Framingham risk score, the continuous BMI (≥18.5) measure remained statistically significant in European men and Indian men and was borderline significant for Indian women. The HRs for this association for both Indian men and Indian women were more than double those for Europeans. However, the CIs were wide and overlapping, and there were no significant interaction between ethnicity and BMI on the risk of CVD. The categorical analyses only showed a statistically significant positive association between overweight or obesity and CVD in Indian women. Being underweight (BMI<18.5) compared with being normal weight was associated with a significantly increased risk of CVD in Europeans, which remained after adjustment for the Framingham risk score. Inclusion of BMI in the model did not increase the AUC compared with the Framingham score alone (not shown).
HRs (95% CI) for the prospective association between BMI and first CVD events
Quintiles of socioeconomic deprivation showed a linear association with CVD in both ethnic groups with increasing age-adjusted HRs with increasing deprivation (table 5). Compared with the least deprived quintile, the four highest deprivation quintiles (quintiles 2–5) were significantly associated with increased risk of CVD in Europeans. We found a similar pattern for Indians, although the estimates were generally lower than in Europeans and the CIs were wider. After adjusting for Framingham, all HRs were attenuated. However, the general pattern for the association between area deprivation and CVD remained in all subgroups after adjustment for Framingham. The HR for the continuous deprivation variable also remained statistically significant in all subgroups. Inclusion of deprivation index in the model did not increase the AUC compared with the Framingham alone (not shown).
HRs (95% CI) for the prospective association between area deprivation index score and first CVD events
Sensitivity analyses
The sensitivity analyses excluding men aged <45 years and women aged <55 years showed similar calibration (not shown).
Discussion
This study showed that a Framingham CVD risk score based on risk factor information collected over 40 years ago8 predicted the 5-year risk of CVD reasonably well in Indian men currently living in New Zealand. However, the Framingham score overestimated risk substantially in Indian women with predicted risk values of about 6% and above, and in European men and women in all but the two lowest deciles of predicted risk. Despite Indians being around 6–8 years younger than Europeans in the cohort, their observed 5-year CVD event rates were very similar to the observed 5-year CVD event rates in Europeans, consistent with the previously documented high burden of CVD in South Asians in New Zealand22 and other countries.1 23 We also found a positive association between increasing BMI (from BMI≥18.5) and the risk of CVD in both ethnic groups which remained statistically significant in all the subgroups except European women after adjustment for the Framingham risk score. A consistent and strong association between area deprivation and the risk of CVD in both Indians and Europeans was also identified.
It has been recommended that researchers focus on external validation of existing models instead of deriving new prediction models as there is an abundance of CVD risk scores of unclear validity.24 This study is one of few cohort studies to evaluate the performance of an existing CVD risk score in South Asians using measures of calibration and discrimination.5 A recent review5 identified only four studies that reported the performance of CVD risk models in South Asians (published in English during January 2000–April 2014) and we have only been able to find one relevant study published since then.25 A cohort study from the UK26 was the only study identified in this review5 to provide statistical measures of model performance (discrimination and calibration). The UK study found that Framingham underestimated risk in South Asian women and performed reasonably well in South Asian men after a factor of 1.4 was added to the score.26 Based on these findings,26 the previously documented high burden of CVD in South Asians22 and New Zealand guidelines recommendations to add 5% to the risk score for South Asians,2 we would expect the Framingham risk score to underestimate risk among Indians in New Zealand. Instead, we found that Framingham overestimated the risk in Indian women and in Europeans of both genders. This overestimation of risk could partly be explained by medical treatment since those with a high predicted risk are most likely to be prescribed medication to reduce their absolute risk of CVD.21 Moreover, the New Zealand population is a low-risk population which has experienced declining rates of CHD27 and stroke28 during the past four decades. It is therefore not surprising that the Framingham risk model derived from data collected over 40 years ago overpredicted the risk of CVD in European New Zealanders. The Framingham model, however, was well calibrated in Indian men reflecting their previously observed increased risk.
In the present study, we found that BMI was positively associated with the risk of CVD in both Europeans and Indians in all age-adjusted analyses. After adjusting for the Framingham risk score, the categorical analyses only showed a statistically significant positive association between overweight or obesity and CVD in Indian women, whereas when BMI was analysed as a continuous variable, the association remained significant in European men and Indian men and women. Some of the risk related to a high BMI is mediated through blood pressure, cholesterol and glucose,11 which are included in the Framingham risk score (where diabetes is included instead of glucose). This would explain why the association between BMI and CVD was attenuated after adjusting for Framingham. BMI is often regarded as a poor indicator of adiposity in South Asians, since South Asians have higher levels of body fat than Europeans at the same BMI levels,29 yet we found that BMI was significantly associated with the risk of CVD in Indians and Europeans. It is possible that adiposity would prove even more important for the risk of CVD in Indians had we studied other adiposity measures such as waist-to-hip ratio. Unfortunately, this information was not available for the majority of the study participants. The higher HR point estimates for the association between increasing BMI (≥18.5) and CVD in Indians than Europeans could imply a stronger association between BMI and CVD in Indians, concurring with the lower cut-offs for overweight (BMI >23) and obesity (BMI >25) that has been suggested for Asian Indians.30 However, the CIs for the two ethnic groups were overlapping. The strong association between underweight and risk of CVD is likely due to comorbidities and possibly smoking-related weight loss.31
We found a similar and clear association between the New Zealand deprivation index and CVD risk in both Indians and Europeans. The association persisted after adjusting for the Framingham score in both ethnic groups suggesting that information about social deprivation should be considered in addition to Framingham when assessing risk of CVD in Indians and Europeans. The ASSIGN score from Scotland32 and QRISK,33 which is also from the UK, are examples of risk scores that have included similar area-based measures of deprivation. Framingham risk scores have previously been criticised for lacking socioeconomic predictors10 and our findings support the inclusion of such information. The inclusion of BMI or deprivation did not improve the AUC measures compared with Framingham alone. However, the AUC is an insensitive measure when it comes to selection of variables to be included in a prediction model.19
Strengths and limitations
A strength of this study is the large number of study participants and the completeness of risk factor information. Another strength is the identification of cardiovascular outcomes through comprehensive national health registers. We have also validated a well-known risk prediction model in a high-risk population in which the validity of available risk scores is largely unknown.
Since risk assessment was prioritised for high-risk patients, the PREDICT cohort may not be representative of the general New Zealand adult population. More importantly, however, the PREDICT cohort is representative of New Zealanders eligible for CVD risk assessment. The New Zealand Ministry of Health has prioritised and incentivised heart and diabetes checks over the last 10 years through a nationally co-ordinated and funded programme.34 Consequently, about 90% of all New Zealanders meeting national guideline eligibility criteria had CVD risk assessments between 2010 and 2015, and over 90% of eligible individuals in the primary health organisations using the PREDICT decision support software have been risk assessed. A limitation is the lack of individual measures of socioeconomic deprivation, and the lack of adiposity measures in addition to BMI, such as waist-to-hip ratio. Another limitation is that we could not distinguish between Indians born in New Zealand or overseas.
Conclusions
Prospective information from 222 000 Europeans and 34 000 Indians showed that a Framingham risk model predicted the 5-year risk of CVD in Indian men reasonably well, but overestimated risk in Indian women and in European men and women. The study also showed that BMI and deprivation are potentially useful predictors of CVD risk over and above Framingham predictors. These findings demonstrate that improved methods for assessing risk in Europeans and Indians in New Zealand are warranted, particularly given the high burden of CVD among South Asians.
References
Footnotes
Contributors RTJ and HEM contributed to the conception and design of the work. RTJ was responsible for the collection of data. RP and SM contributed with definition of end points and preparation of the dataset. RMS provided ideas for analyses and contributed to the analysis of data. KSR drafted the paper and carried out the data analyses. All authors contributed to the interpretation of results as well as critical reading and revision of the draft. All authors approved the final manuscript for submission.
Funding This work was supported by the Norwegian Extra-Foundation for Health and Rehabilitation (grant number 2012-2-0129).
Competing interests RTJ and SM report grants from Health Research Council of New Zealand.
Patient consent Not required.
Ethics approval The PREDICT study was approved by the Northern Region Ethics Committee Y in 2003 (AKY/03/12/134), and later annually approved by the National Multiregion Ethics Committee since 2007 (MEC07/19/EXP).
Provenance and peer review Not commissioned; externally peer reviewed.