Article Text

Abstract
Background Myocardial T1 and extracellular volume (ECV) derived from cardiovascular MRIs are more and more widely accepted as important markers for diagnosis, risk prediction and monitoring of cardiac disease. Yet data regarding long-term stability of myocardial T1 mapping are lacking. The aim of this study was to investigate the long-term stability of native and postcontrast T1 mapping values in healthy volunteers.
Methods 18 strictly selected healthy volunteers (52±10 years, 12 men) were studied on a Philips Achieva 1.5 Tesla scanner. T1 relaxation times were measured before and 15 min after a bolus contrast injection of gadolinium diethylenetriamine penta-acetic acid (DTPA) (0.2 mmol/kg) using a single-breath-hold modified Look-Locker inversion recovery 3(3)3(3)5 sequence. ECV was calculated using native and postcontrast T1 times of myocardium and blood correcting for blood haematocrit. Exams were repeated 3.6±0.5 years later under the same conditions and using the same scan protocols.
Results Cardiac biomarkers (high-sensitivity troponin T and N terminal pro-brain natriuretic peptide) remained unchanged, as well as left ventricular mass, and global and longitudinal function. No significant change occurred regarding native T1 times (1017±24 ms vs 1015±21 ms; P=0.6), postcontrast T1 times (426±38 ms vs 413±20 ms; P=0.13) or ECV (22%±2% vs 23%±2%; P=0.3). Native T1 time and ECV appeared to be better reproducible than postcontrast T1, resulting in lower coefficients of variation (ECV: 3.5%, native T1: 1.3%, postcontrast T1: 6.4%) and smaller limits of agreement (ECV: 2%/−2%, native T1: 39 ms/−35 ms, postcontrast T1: 85 ms/−59 ms).
Conclusions During long-term follow-up, native T1 and ECV values are very robust markers, whereas postcontrast T1 results appear less stable.
- CMR - T1
- mapping
- normal values
- extracellular volume
This is an Open Access article distributed in accordance with the Creative Commons Attribution Non Commercial (CC BY-NC 4.0) license, which permits others to distribute, remix, adapt, build upon this work non-commercially, and license their derivative works on different terms, provided the original work is properly cited and the use is non-commercial. See: http://creativecommons.org/licenses/by-nc/4.0/
Statistics from Altmetric.com
Key questions
What is already known about this subject?
Myocardial T1 and extracellular volume (ECV) derived from cardiovascular MRIs are more and more widely accepted as important markers for diagnosis, risk prediction and monitoring of cardiac disease. Yet data regarding long-term stability of myocardial T1 mapping are lacking.
What does this study add?
This study investigated the long-term stability of native and postcontrast T1 mapping values in healthy volunteers.
How might this impact on clinical practice?
The demonstrated long-term stability of T1 mapping parameters in this study might help to establish this technique in clinical routine.
Introduction
Background
Cardiovascular magnetic resonance (CMR) T1 mapping represents a quantitative imaging technique for the characterisation of the myocardium and identifies changes in myocardial tissue composition. T1 mapping therefore offers the opportunity to detect and to quantify pathological changes of the myocardium in various heart diseases.1 In T1 mapping, parametric maps are generated where the signal intensity of each pixel represents its longitudinal or spin-lattice relaxation time T1 in milliseconds, which is a time constant that describes a specific magnetic tissue property. T1 maps can be assessed before (native T1) and after (postcontrast T1) administration of a gadolinium-based extracellular contrast agent. Moreover, the extracellular volume (ECV) fraction can be estimated from a combination of native and postcontrast T1 values.
Recently, several studies could demonstrate characteristic changes in native myocardial T1, postcontrast T1 and ECV in different forms of ischaemic and non-ischaemic heart diseases, including acute2 and early states of diseases.3 For instance, changes in T1 times can be caused by interstitial fibrosis,4 5 oedema6 or amyloid deposition.7 The capability of this technique to quantify the amount of diffuse cardiac fibrosis could be demonstrated by comparing T1 mapping parameters with histological parameters from myocardial biopsies.8–10 Recent studies revealed even a prognostic value for T1 mapping in patients with aortic stenosis.11 Furthermore, T1 mapping might be able to detect early microvascular dysfunction in adenosine stress tests.12
Before a diagnostic test is implemented in clinical routine, its technical characteristics have to be investigated, in particular with regard to normal values, comparability, reproducibility and stability. Recent studies reported normal ranges for healthy subjects and data on short-term stability for 1.5 and 3 Tesla. Additionally, Piechnik et al 13 reported only small differences in native T1 in a cohort of 18 healthy volunteers over a period of 3 years using the shortened modified Look-Locker inversion recovery (MOLLI) technique.
Study aim
To date, it is unknown however if ECV values of healthy individuals change over time or remain constant. We sought to investigate the long-term stability of T1 mapping values including ECV in a cohort of well-characterised, healthy volunteers.
Methods
Study population
Eighteen volunteers were prospectively enrolled between 2010 and 2011. Recruitment was performed using postings and newspaper advertisement, inviting apparently healthy volunteers to participate in a scientific study and following a standard protocol. Except for thyroid hormone substitution and oral contraceptives, permanent medication was a contraindication. For follow-up, these volunteers were enrolled by written invitation in 2015. All participants gave written informed consent.
Clinical examination and ECG
All subjects underwent clinical examination and 12-lead ECG at the baseline visit and at the follow-up visit. Medical history, family history, physical examination and ECG analysis were performed by two clinically experienced physicians and supervised by senior physicians.
Laboratory testing
Extensive blood analyses were performed both at the baseline visit and at the follow-up visit, including complete blood cell count, electrolytes, cardiac biomarkers, liver and kidney function tests, and thyroid hormone levels. Additionally, test subjects underwent an oral glucose tolerance test at the baseline visit. Standard assays were used for determination of troponin T (ECLIA, Roche Diagnostics) and N terminal pro-brain natriuretic peptide (NT-proBNP) (CLIA, Siemens). Blood samples were collected on the same day as the CMR scan was performed.
Cardiovascular magnetic resonance
All scans were performed on the same Philips 1.5 Tesla MRI scanner (Achieva) with a 32-element cardiac receiver coil and vector-ECG gating. Steady-state free-precession cine sequences were applied in contiguous short-axis and in three long-axis views (two-chamber, three-chamber, four-chamber). T1 imaging was performed using a MOLLI sequence in a mid-ventricular short-axis view during breath-hold in end-expiration14 before and 15 min after administration of gadolinium diethylenetriamine penta-acetic acid /DTPA (Magnograf, 0.2 mmol/kg body weight). At baseline, an adenosine stress examination was performed to exclude significant coronary artery disease.
Contiguous short-axis stack images were used to measure cardiac volumes, left ventricular ejection fraction (LVEF) and myocardial mass in late diastole using a commercially available workstation (Philips IntelliSpace, V.7.0.1, Best, The Netherlands).
Precontrast and postcontrast T1 maps were generated and analysed using a commercial software package for cardiovascular image analysis (cvi42, V.5.2, Circle Cardiovascular Imaging, Calgary, Canada). Endocardial and epicardial borders were defined manually, using an offset of 15% to avoid partial-volume effects in the subendocardial and subepicardial layers. Global myocardial T1 values were calculated as a mean of all segments with respect to the segment’s area. T1 values for blood were gathered by manually drawing a region of interest in the left ventricular (LV) cavity.
ECV values were created according to the following formula15:

Statistical analysis
Statistical analysis was performed using MedCalc V.16.4 statistical software (MedCalc Software, Ostend, Belgium).
The Kolmogorov-Smirnov test was used to test for normal distributions. Categorical data are expressed as percentages and continuous variables as mean±SD. For comparison of two parametric variables, the paired t-test was used. For analysis of the reproducibility of different parameters, we used Bland-Altman plots and coefficients of variation. A P value of less than 0.05 was considered statistically significant.
Results
Clinical parameters and laboratory results
No study subjects reported symptoms or any other evidence of cardiac disease at baseline and after follow-up (mean interval 3.8±0.6 years). None of the subjects had medications on a regular basis. All clinical and ECG values were within the normal range at baseline as well as at the follow-up visit. There was a small yet significant increase of systolic (from 119±10 to 126±9 mm Hg; P<0.001) and diastolic (from 73±10 to 83±8 mm Hg; P<0.001) blood pressure, PQ time, QTc time, and heart frequency between the two examinations, while all other parameters remained stable (table 1). No arrhythmias, abnormalities in conduction or signs of ischaemia were detected by ECG.
Clinical characteristics and ECG data
Laboratory values were within normal range at both visits, and the detailed data are provided in table 2. No significant changes in cardiac biomarkers (high-sensitivity troponin T and NT-proBNP) were observed.
Laboratory results
CMR results
All CMR parameters of all subjects were within the reference range on both visits, with normal initial stress test results. On the follow-up visit, significant changes occurred in end-diastolic volume (from 155±31 mL to 143±28 mL, P=0.01), end-systolic volume (from 60±14 mL to 55±12 mL, P=0.01) and stroke volume (from 94±20 mL to 88±17 mL, P=0.03), whereas LV mass, LVEF and parameters of longitudinal function remained unchanged. All parameters are given in table 3.
CMR parameters
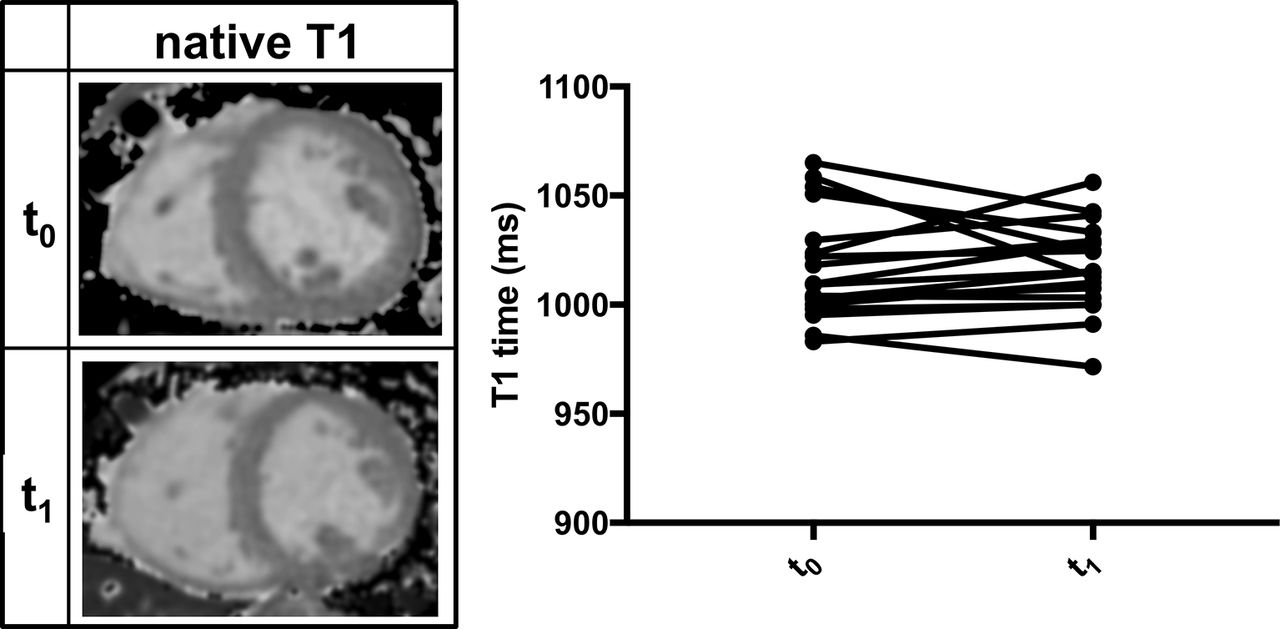
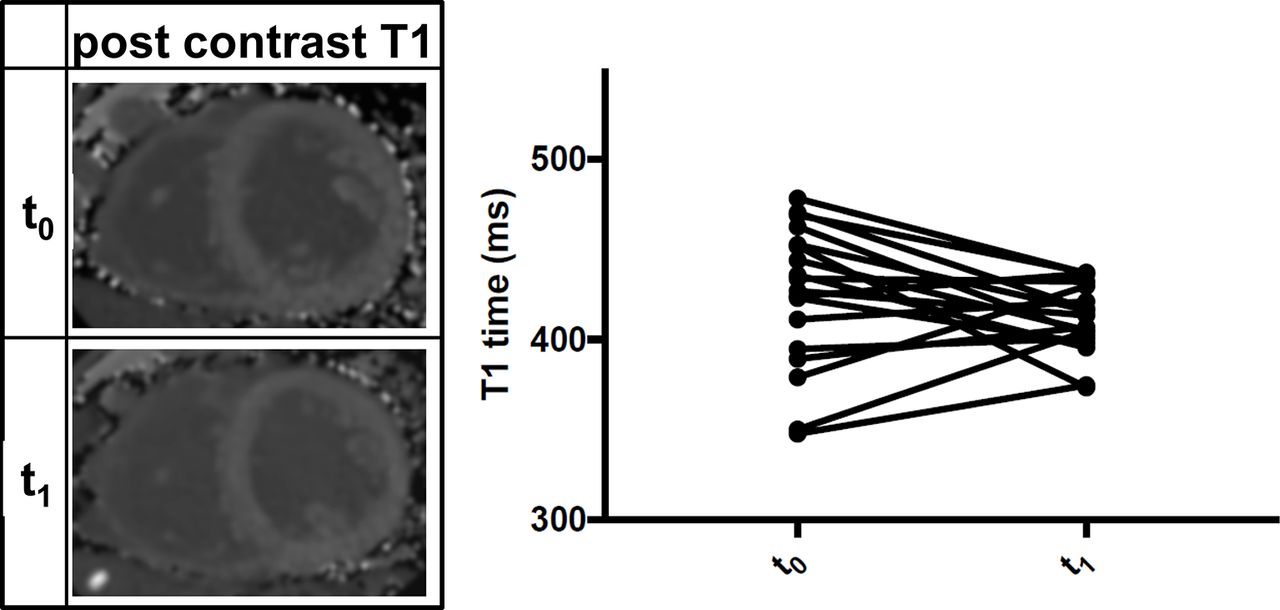
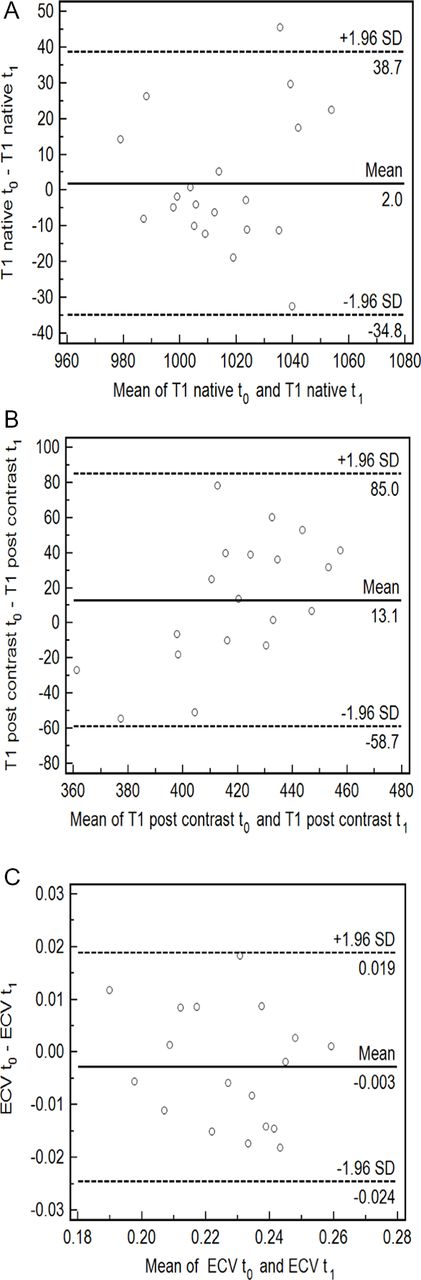
No significant change occurred in native T1 times (baseline: 1017±24 ms vs follow-up: 1015±21 ms; P=0.6; figure 1), postcontrast T1 times (baseline: 426±38 ms vs follow-up: 413±20 ms; P=0.13; figure 2) or ECV (baseline: 22±2% vs follow-up: 23%±2%; P=0.3; figure 3). Native T1 time and ECV were better reproducible than postcontrast T1, resulting in better coefficients of variation (ECV: 3.5%, native T1: 1.3%, postcontrast T1: 6.4%). Limits of agreement were smaller in ECV and native compared with postcontrast T1 (ECV: 2%/−2%, native T1: 39 ms/−35 ms, postcontrast T1: 85 ms/−59 ms). Bland-Altman plots are given in figure 4.

Representative images of native T1 maps and plots of individual T1 values at baseline (t0) and follow-up visit (t1).

Representative images of postcontrast T1 maps and plots of individual postcontrast T1 values at baseline (t0) and follow-up visit (t1).

Representative images of extracellular volume (ECV) maps and plots of individual ECV values at baseline (t0) and follow-up visit (t1).

Bland-Altman plots of native T1 (A), postcontrast T1 (B) and extracellular volume (ECV) (C). T0, baseline visit; t1, follow up visit.
Gender-wise analysis
Male subjects had a significantly higher body mass index (26±1 kg/m2 vs 22±1 kg/m2, P=0.02), but did not differ significantly in any other baseline parameter. No differences in CMR parameters or T1 mapping values could be observed between genders except postcontrast T1 time at baseline visit (male: 443±8 ms, female: 388±14 ms; P=0.002). Limits of agreement were smaller in ECV and native T1 compared with postcontrast T1 in men (native T1: 24/–27 ms, postcontrast-: −95/42 ms, ECV: 2/%–2%) as well as in women (native T1: 60/–51 ms, postcontrast T1: 48/–73 ms, ECV: 2/%–2%). Accordingly, coefficients of variation were better for ECV and native T1 compared with postcontrast T1 in men (ECV: 3.0%, native T1: 0.9%, postcontrast T1: 6.9%) and women (ECV: 3.9%, native T1: 1.7%, postcontrast T1: 5.9%).
Discussion
In this study we could demonstrate that in a cohort of strictly selected healthy individuals, (1) native T1, postcontrast T1 and ECV did not change significantly during a long-term follow-up; (2) native T1 and ECV values showed less variation between measurements than postcontrast T1; and (3) no significant differences between genders could be observed.
T1 mapping is an emerging technique and recently was used in numerous single-centre studies. Significant differences between healthy and diseased subjects could be demonstrated for a wide spectrum of cardiomyopathies, including dilated cardiomyopathy (DCM),4 5 9 16 hypertrophic cardiomyopathy4 5 17–20 and cardiac amyloidosis.7 21–23 Some studies also elucidated the prognostic value of T1 mapping in a cohort of patients with DCM,16 24 light-chain amyloidosis,25 diabetes26 and patients with heart failure of different aetiologies.27 An association between ECV and short-term mortality in a heterogeneous cohort could be demonstrated by Wong et al.28 Before these research findings can be translated into clinical application, several technical aspects have to be addressed. First, various mapping sequences with specific advantages and disadvantages and—even more importantly—different normal ranges are available, and technical improvement is still ongoing. T1 results might vary between different vendors and magnetic resonance systems,29 and there is a lack of multivendor/multicentre trials. Furthermore, the field is heterogeneous regarding the use and dosage of contrast agents, cut-off values, quality management, image postprocessing and reporting. Due to the novelty of the technique and the different technical challenges, no universally valid reference values are available yet. In a consensus paper edited by an expert consensus group, it was suggested that normal values should be established at each CMR site for the local set-up.30 In a first multicentre, single-vendor approach, Piechnik et al 13 provided reference values for 1.5 Tesla in a large cohort of 342 healthy volunteers. Additionally, mapping values for different cardiovascular diseases were provided.31 Dabir et al 32 provided reference values for 1.5 and 3T based on 103 healthy subjects, examined in four different centres under the same conditions using a standardised mapping sequence. Normal values of 1.5T T1 mapping parameters based on smaller cohorts were also published by Messroghli et al,14 Gai et al,33 Liu et al,34 von Knobelsdorf-Brenkenhoff et al 35 and Nacif et al.36 The average values in our cohort were closest to the values obtained by Nacif et al, using the same sequence with the same flip angle of 35°.
Postcontrast T1 times depend on the dosage of contrast agents, the total volume of distribution and the time between injection of contrast medium and image acquisition. This may explain why postcontrast T1 had the highest coefficient of variation among all parameters in our cohort and therefore appeared to be less robust than native T1 or ECV. As a derived parameter, ECV appears much less dependent on technical confounders and field strength. Additionally, ECV has a lower variability between different vendors than native and postcontrast T1.29 Indeed, in our study, ECV had a good reproducibility, with just a slightly higher coefficient of variation than native T1.
In our cohort, no significant changes could be detected between baseline and follow-up scans, but several studies reported an age dependency of T1 mapping parameters. For instance, an increase of ECV26 37 and a decrease of native T1 times with age13 were described. It remains unclear whether the observed changes might indicate a subclinical disease or the physiological ageing process. However, the small sample size in our study should be considered as a major limitation in this context.
The finding that native T1 and ECV remain constant in healthy volunteers over several years, respectively, the long-term stability of T1 mapping parameters in individuals, is an essential precondition for applications such as monitoring during therapeutic interventions or assessment of natural disease progression. Of course, our study is limited by a small case number and a lack of data for different sequences, field strengths, vendors or postprocessing procedures. Nevertheless, the presented data endorse the results of previous studies regarding stability of T1 measurements.
Conclusion
Myocardial T1 and ECV values are stable over a long-term follow-up period in healthy subjects and thus appear suitable for longitudinal studies. While a similar reproducibility could be demonstrated for native T1 and ECV, postcontrast T1 appeared to be less robust.
Acknowledgments
We thank our medical technical assistant Daniel Helm for excellent image acquisition and his valuable and sustained support.
References
Footnotes
FS and CB contributed equally.
Contributors FadS: study conception and design, drafting of manuscript. CB: acquisition of data. MM-H: analysis and interpretation of data, drafting of manuscript. FA: analysis and interpretation of data, statistics. DM: critical revision. MO: critical revision. JR: critical revision. EG: critical revision. HAK: critical revision. MGF: critical revision. SJB: analysis and interpretation of data, drafting of manuscript.
Competing interests None declared.
Ethics approval The study was conducted in accordance with the ethical principles of the Declaration of Helsinki and was approved by the local ethics committee of the University of Heidelberg, Germany (reference number: S-038/2007, Ethikkommission Heidelberg, Alte Glockengießerei 11/1, 60015 Heidelberg).
Provenance and peer review Not commissioned; externally peer reviewed.
Data sharing statement No additional data are available.