Article Text

Abstract
Objectives Healthcare expenditure per-capita in the USA is higher than in England. We hypothesised that clinical outcomes after cardiac revascularisation are better in the USA. We compared costs and outcomes of patients undergoing coronary artery bypass grafting (CABG) and percutaneous coronary intervention (PCI) in England and New York State (NYS).
Methods Costs and total mortality were assessed using the Hospital Episode Statistics for England and the Statewide Planning and Research Cooperative System for NYS. Outcomes after a first CABG or PCI were assessed in patients undergoing a first CABG (n=142 969) or PCI (n=431 416).
Results After CABG, crude total mortality in England was 0.72% lower at 30 days and 3.68% lower at 1 year (both P<0.001). After PCI, crude total mortality was 0.35% lower at 30 days and 3.55% lower at 1 year (both P<0.001). No differences emerged in total mortality at 30 days after either CABG (England: HR 1.02,95% CI 0.94 to 1.10) or PCI (HR 1.04, 95% CI 0.99 to 1.09) after covariate adjustment. At 1 year, adjusted total mortality was lower in England after both CABG (HR 0.74, 95% CI 0.71 to 0.78) and PCI (HR 0.66, 95% CI 0.65 to 0.68). After adjustment for cost-to-charge ratios and purchasing power parities, costs in NYS amounted to uplifts of 3.8-fold for CABG and 3.6-fold for PCI.
Conclusions Total mortality after CABG and PCI was similar at 30 days and lower in England at 1 year. Costs were approximately fourfold higher in NYS.
- cardiac surgery
- coronary artery disease
- interventional cardiology
This is an Open Access article distributed in accordance with the Creative Commons Attribution Non Commercial (CC BY-NC 4.0) license, which permits others to distribute, remix, adapt, build upon this work non-commercially, and license their derivative works on different terms, provided the original work is properly cited and the use is non-commercial. See: http://creativecommons.org/licenses/by-nc/4.0/
Statistics from Altmetric.com
Key messages
What is already known about this subject?
Healthcare expenditure per-capita in the USA is higher than in England.
What does this study add?
Survival after coronary artery bypass grafting (CABG) and percutaneous coronary intervention (PCI) in England at 1 year is better than in New York State (NYS), at much lower costs, taking into account cost of living.
How might this impact on clinical practice?
Survival after CABG and PCI in NYS may be achievable at the cost levels observed in England.
Introduction
The USA spends more per capita on healthcare than any other developed nation. This high expenditure underlies the perception that the quality of healthcare in the USA is better than in a public health system. Despite the most expensive healthcare system, the USA ranks poorly in comparison to other industrialised countries on measures of health system performance, with respect to quality, efficiency, access to care and equity.1
Amidst the current political imperative to reform healthcare in the USA, most Americans consider that they receive the best quality of care2 and that a public healthcare system would undermine quality.3 4 On the other hand, the National Health Service (NHS) in England is popularly regarded as a compromise between ‘best care’ and limited resources, in the context of its fundamental premise that healthcare will be provided to everyone ‘free at the point of delivery’.
Cardiovascular disease is a major contributor to total healthcare costs in the Western World. In the UK, direct annual costs amount to £17.4 billion, which is 18% of total UK healthcare costs.5 Including indirect costs, the total cost of heart disease amounts to £29.1 billion in the UK and $215.6 billion in the USA (2011).6 The cost of cardiovascular disease in the USA is projected to rise from $656 billion in 2015 to $1208 billion in 2030.6 Such a high cost burden begs a comparison of costs and outcomes of cardiovascular procedures in the USA and England. In this study, we explore the costs and long-term outcomes of coronary artery bypass grafting (CABG) and percutaneous coronary intervention (PCI). To this end, we have employed administrative databases, namely the Hospital Episode Statistics (HES) and Office of National Statistics for England and the Statewide Planning and Research Cooperative System (SPARCS) for New York State (NYS).
Methods
Data sources
In this non-randomised, retrospective study, clinical and outcome data were extracted from HES and SPARCS. These are data warehouses containing details of all admissions to all NHS hospitals in England and all NYS hospitals, including patient demographics, diagnoses and treatments and services. In both systems, no personal identification is disclosed, so as to protect patient confidentiality. Data from HES are available to University Hospital Birmingham under a data sharing agreement for the purposes of service evaluation (section 251 of the NHS Act 2006). For SPARCS, an agreement has been drawn with NYS Department of Health to use anonymised data for comparisons of clinical outcomes between hospitals and healthcare systems. The study conforms to the Declaration of Helsinki.
Our sample from both England and NYS includes unselected patients undergoing a first CABG and PCI between 1 April 2009 and 1 December 2013. Only data relating to the first procedure were used in analyses. In NYS, data were collected with reference to International Coding of Diseases Ninth Revision (ICD-9), whereas ICD-10 was used in the England dataset. Mapping of relevant codes between ICD-9 and ICD-10 is listed in the online supplementary appendix.
Supplementary file 1
Costs
The NHS in England is funded through national tariff, which is set for each year. It is calculated on ‘Payment by Results’, according to which payment is linked to activity and adjusted for case mix. In NYS, SPARCS provides individualised, discharge level gross charges but not costs. We therefore converted the gross charges to average cost for each year by adjusting for Medicare hospital-specific cost-to-charge ratios (CCRs) from the relevant year using the Inpatient Prospective Payment System Impact File.7 8 Average CCRs of 0.43–0.45 were used for the period 2009–2013. Instead of applying nominal exchange rates for US dollars and pound sterling, we also adjusted for purchasing power parities (PPPs), which yield an estimate of the exchange rate between two currencies would have to be in order for the exchange to be in line with the purchasing power of the two countries’ currencies. In effect, PPP exchange rates minimise misleading international comparisons that can arise with the use of market exchange rates. Insurance coverage for NYS is shown in the online supplementary appendix. Costs included in this study are for procedures alone and do not include postoperative care, such as rehabilitation, medical follow-up or reinterventions.
Outcomes
The primary endpoint was total mortality. The secondary endpoint was repeat revascularisation. Hospitalisation dates were used to derive the survival time from procedure to the various endpoints. Postoperative outcomes were considered at 30 days and 1 year. As date of death was not available in the NYS dataset, approximate survival times were calculated using death flags. The methodology and validation of this process is detailed in the online supplementary appendix.
Statistical analysis
Continuous variables are expressed as mean (±SD) and compared using the Student’s t-test. Categorical variables were compared using the χ2 statistic. Kaplan-Meier curves and the log-rank test were used to assess survival. Logistic regressions were applied to estimate the different short-term endpoints, that is, within 30 days and 1 year. Cox proportional hazard models were used to assess the long-term relative risk in comparisons of the various endpoints in England and NYS. Proportionality hypotheses were verified by visual examination of log (survival) graphs to ensure parallel curves and by plotting Schoenfeld residuals. Statistical analyses were undertaken using Stata V.14 (Stata, Texas, USA). A two-sided P≤0.05 was considered statistically significant.
Results
Baseline characteristics
The study population included patients undergoing (n=1 42 969) or PCI (n=4 31 416) over a period of 4.67 years in 154 centres in England and 86 in NYS. Baseline characteristics are shown in table 1. Among country differences, there was a greater proportion of women in NYS (P<0.001) and reported individual comorbidities, as well as the Charlson score, were consistently higher in NYS for all procedures (all P<0.001).
Baseline characteristics
Postoperative outcomes
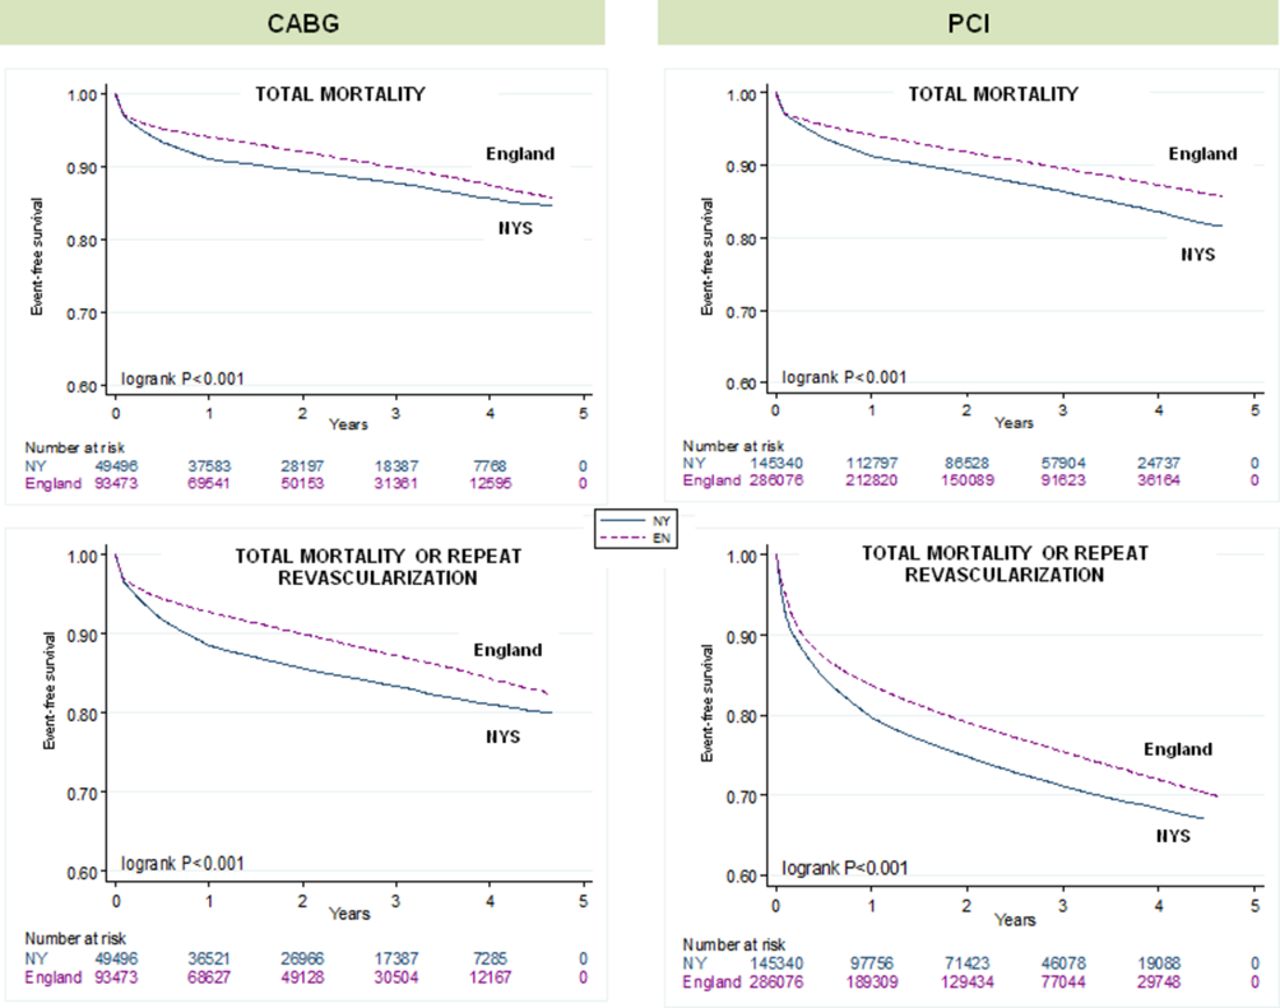
Figure 1 shows Kaplan-Meier survival curves and table 2 shows cumulative incidence rates over the follow-up period. After CABG, total mortality was lower in England at both 30 days (by 0.72%) and 1 year (by 3.68%) (both P<0.001). Likewise, after PCI, total mortality was lower in England at both 30 days (by 0.35%) and 1 year (by 3.55%) (both P<0.001). In multivariable logistic regression analyses, there were no group differences in total mortality at 30 days after either CABG (England: HR 1.02, 95% CI 0.94 to 1.10) or PCI (HR 1.04, 95% CI 0.99 to 1.09). At 1 year, adjusted total mortality was lower in England after both CABG (HR 0.74, 95% CI 0.71 to 0.78) and PCI (HR 0.66, 95% CI 0.65 to 0.68).

Clinical outcomes after cardiac procedures. Kaplan-Meier survival curves are shown for the various endpoints. HR and 95% CI are derived from univariable Cox proportional hazards models. CABG, coronary artery bypass grafting; EN, England; NYS, New York State; PCI, percutaneous coronary intervention.
Clinical outcomes
Repeat revascularisation
The combined endpoint of total mortality or repeat revascularisations at 30 days after CABG was 0.84% lower in England (P<0.001), but this was not significant after adjustment (HR 1.01, 95% CI 0.94 to 1.09). At 1 year, the combined endpoint was 4.91% lower in England (P<0.001) and this remained significant after adjustment (HR 0.76 (95% CI 0.72 to 0.79). After PCI, this combined endpoint was 2.58% lower in England at 30 days (by 2.58%, P<0.001), even after adjustment (HR 0.64, 95% CI 0.62 to 0.66). Similarly, the combined endpoint was also lower in England at 1 year (by 4.63%, P<0.001) even after adjustment (HR 0.68, 95% CI 0.68 to 0.71).
Long-term outcomes
As shown in figure 1, survival curves for total mortality after CABG diverged up to year 1 and converged thereafter. Over the whole follow-up period, there were no differences in adjusted total mortality (England: HR 1.00, 95% CI 0.96 to 1.05) (table 3). In contrast, survival curves after PCI diverged from the outset. Over the whole follow-up period, adjusted total mortality was lower in England (England: HR 0.87, 95% CI 0.85 to 0.89) (table 3). Total mortality or repeat revascularisation was similar after CABG (England: HR 1.00, 95% CI 0.96 to 1.04) and lower in England after PCI (HR 0.85, 95% CI 0.4 to 0.87).
Multivariable analyses
Costs
As shown in table 4, costs of CABG and PCI were higher in NYS. After adjustment for CCR and PPPs, costs in NYS amounted to uplifts of 3.8-fold for CABG and 3.6-fold for PCI.
Costs
Discussion
In this study of real-world clinical practice, we found no differences in 30-day total mortality after CABG or PCI in England and NYS, after adjustment for age and comorbidities. At 1 year, adjusted total mortality was lower in England for both CABG and PCI. Long-term adjusted total mortality was similar after CABG, but lower in England after PCI. Costs of both CABG and PCI were approximately fourfold higher in NYS.
Outcomes
Postoperative outcomes are usually reported in terms of crude 30-day mortality. Whether or not this is an appropriate measure of the outcome of surgery is debatable, but this measure is nevertheless used worldwide. We found no difference in 30-day total mortality between England and NYS for either CABG or PCI, after adjustment for age, sex or comorbidities. Arguably, the effects of an operation extends well beyond 30 days, perhaps after 1 year. In this respect, we found that adjusted total mortality at 1 year after CABG and PCI were lower in England. In the long term, adjusted total mortality was similar for CABG, but lower in England for PCI.
Unfortunately, administrative databases lack granularity and further statistical analysis of our data is unlikely to shed light on the factors that contribute to observed differences in crude outcomes. It might be considered, however, that the observed differences are clinically acceptable, particularly in view that we are dealing with different healthcare systems in different countries. It is also possible that patients with greater comorbidity are being treated in NYS. On the other hand, that comorbidities tend to be under-reported in England.9 This could explain differences in outcomes.
In keeping with other studies,10–12 we have observed a higher uptake of repeat coronary revascularisation procedures in NYS after both CABG and PCI. We did not assess symptom status in these populations and we cannot discount the possibility that higher revascularisation rates in the USA are associated with a better quality of life.
Costs
Costs of cardiac revascularisation in NYS described herein are consistent with other reports.13 An uninsured patient in the USA is likely to pay $70 000–$200 000 for a CABG, depending on the hospital and postoperative course. We found that costs in NYS were approximately fourfold higher than in England. This may be due to several factors. First, the USA pays more simply because it is wealthier. In this respect, the USA spends more per capita (as a percentage of growth domestic product) than other industrialised nation (17.1% vs 7%–11%). In 2006, healthcare costs per capita, adjusted for cost of living, were $6714 in the USA and $2880 in other industrialised nations. The cost for the public sector in the USA and England amounted to $3074 vs $2027 per person (Organisation for Economic Co-operation and Development (OECD) median), respectively, after adjusting for cost of living. Out-of-pocket expenses were also higher in the USA (OECD median of $857 vs $483 in 2006). Second, healthcare in NYS may simply be more expensive, that is, it pays a higher price for the same goods and services. In this regard, pharmaceutical spending per capita in the USA, adjusted for cost of living, was $1843 in 2006, compared with a OECD median of $1433.14 15 Higher charges in the USA are also accrued by diagnostics, such as magnetic resonance and CT scans14 and pharmaceuticals. As this is an observational study, we cannot assume that changes in costs would necessarily translate to changes in clinical outcomes.
An important question is whether our findings are generalisable to other US states. In the analytic sample for NYS, 51.4% of patients were covered by either Medicare (46%) or Medicaid (5.4%), which compares to a total of 63.6% coverage across the USA in 2013,16 when 30/52 states in the USA had similar Medicare and Medicaid coverage to NYS (total between 30% and 40% in 2013).17
Limitations
Our study has several limitations, most of which are related to its observational and retrospective design. First, patients in NYS consistently had more reported comorbidities. Under-reporting is recognised in England.9 Clearly, this could influence both short-term and long-term outcomes. To minimise this effect, we selected our study time from 2009, when coding systems in England improved after greater usage of the Payment by Results tariff system. Second, we used a proxy death date for NYS data. Nevertheless, we have applied the same algorithm to data from England and obtained similar results. Third, disease severity, which could also affect outcomes, was not assessed, as is the norm in administrative datasets. Fourth, we have not explored other aspects of healthcare that might influence outcomes, including medication, differences in operator experience, variations in care pathways and organisational issues.18 Fifth, we do not have data on the aetiology of coronary disorders, all of which are likely to influence outcomes. Sixth, there will be systematic differences in coding between the two countries, and for this reason, we did not use statistical methods to try to match patients. Some demographic features such as age and sex can be compared (and indeed were very similar between countries), but differences observed in other factors, such as Charlson score, are likely to relate in part to differences in the accuracy with which these features are recorded in the different healthcare systems. Seventh, our findings from NYS may not be generalisable to the entire US healthcare system, in which the Veterans Association and Kaiser group may have varying coverage. Eighth, we have not quantified the details of treatment that may also have impact on outcomes, including the type of coronary artery graft (internal mammary or vein), type of stent (metal or drug eluting of first or second generation), type and duration of dual antiplatelet regimen, differences in door-to-balloon or ischaemia times and other differences in the management of patients with ST-elevation myocardial infarction (STEMI). Last, we have no data on socioeconomic status and this too is likely to influence outcomes.
Conclusions
This is the largest comparison of long-term clinical outcomes and costs after CABG and PCI in England and USA to date. We have found that total mortality was similar at 30 days and lower in England at 1 year. Costs were approximately fourfold higher in NYS.
References
Footnotes
Contributors FL and TQ: hypothesis, study design, data collection, data analysis, data interpretation and writing. FE: data collection and data analysis. CC and DMN: data collection, data analysis and data interpretation. PL and DR: data interpretation and writing.
Competing interests None declared.
Patient consent Section 251 of Healthcare Information Act.
Ethics approval Queen Elizabeth Hospital.
Provenance and peer review Not commissioned; externally peer reviewed.