Article Text

Abstract
Background Diagnostic accuracy is widely accepted by researchers and clinicians as an optimal expression of a test’s performance. The aim of this study was to evaluate the effects of disease severity distribution on values of diagnostic accuracy as well as propose a sample-independent methodology to calculate and display accuracy of diagnostic tests.
Methods and findings We evaluated the diagnostic relationship between two hypothetical methods to measure serum cholesterol (Cholrapid and Cholgold) by generating samples with statistical software and (1) keeping the numerical relationship between methods unchanged and (2) changing the distribution of cholesterol values. Metrics of categorical agreement were calculated (accuracy, sensitivity and specificity). Finally, a novel methodology to display and calculate accuracy values was presented (the V-plot of accuracies).
Conclusion No single value of diagnostic accuracy can be used to describe the relationship between tests, as accuracy is a metric heavily affected by the underlying sample distribution. Our novel proposed methodology, the V-plot of accuracies, can be used as a sample-independent measure of a test performance against a reference gold standard.
- diagnostic accuracy
- diagnostic tests
- study sample
This is an Open Access article distributed in accordance with the terms of the Creative Commons Attribution (CC BY 4.0) license, which permits others to distribute, remix, adapt and build upon this work, for commercial use, provided the original work is properly cited. See: http://creativecommons.org/licenses/by/4.0/
Statistics from Altmetric.com
Key questions
What is already known about this subject?
Diagnostic methods are often chosen by clinicians based on their published diagnostic accuracy against a reference gold standard. The diagnostic accuracy of a method is known to be affected by the underlying disease prevalence.
What does this study add?
Using a practical example, we demonstrate how the pattern of disease severity distribution (intermediate vs extreme values) can affect the diagnostic accuracy of a method beyond disease prevalence. We propose the use of a novel V-plot of accuracies to display diagnostic accuracy values, which is a sample-independent, universal measure of a method’s categorical agreement with a reference standard.
How might this impact on clinical practice?
Using the V-plot of accuracies, researchers can describe the categorical agreement between two methods of measurement, and physicians may immediately appreciate the upper and lower limits of a test’s accuracy to decide which diagnostic method to choose for their patients.
Introduction
Almost all clinically useful biological measurements are quantifiable continuous variables, such as arterial blood pressure, plasma glucose and serum cholesterol. For clinical convenience, however, many are interpreted qualitatively by a dichotomous classification into normal versus abnormal, based on a fixed cut-off. For instance, although serum levels of cholesterol can be quantified and displayed across a wide spectrum of values, patients are often labelled as having hypercholesterolaemia versus normal cholesterol based on an accepted cut-off value. Dichotomising results into positive versus negative is common in clinical practice because of the perceived pressure of information overload and with the reason given that often clinical decisions are themselves dichotomous (treat vs not treat, start or not a statin).
Qualitatively, the performance of a diagnostic test against a reference gold standard can be quantified by its diagnostic accuracy and the directly related sensitivity, specificity, predictive values, likelihood ratios and area under receiver operator characteristic (ROC) curve. 1 Among all such available measures, physicians often choose diagnostic methods based on their published accuracy, a demonstration that statistical concepts can directly influence patient care and healthcare policies.2 However, relying on a universal value of diagnostic accuracy as an idealised measure of a test’s performance is an approach with known limitations. First, accuracy values are known to depend on the prevalence of disease in the underlying sample, an extensively explored phenomenon.3 4 Second, beyond disease prevalence, how disease severity is distributed within a study sample independently affects a test’s accuracy, a phenomenon rarely discussed4 5 and schematically explained in figure 1. For any given quantitative diagnostic method and its reference comparison, diagnostic accuracy can have any value from approximately 50% up to 100%; this value will depend on the numerical agreement between the methods (how good a test is) and also on whether the sample studied is formed by intermediate (close to cut-off) or extremes (away from cut-off) forms of disease.
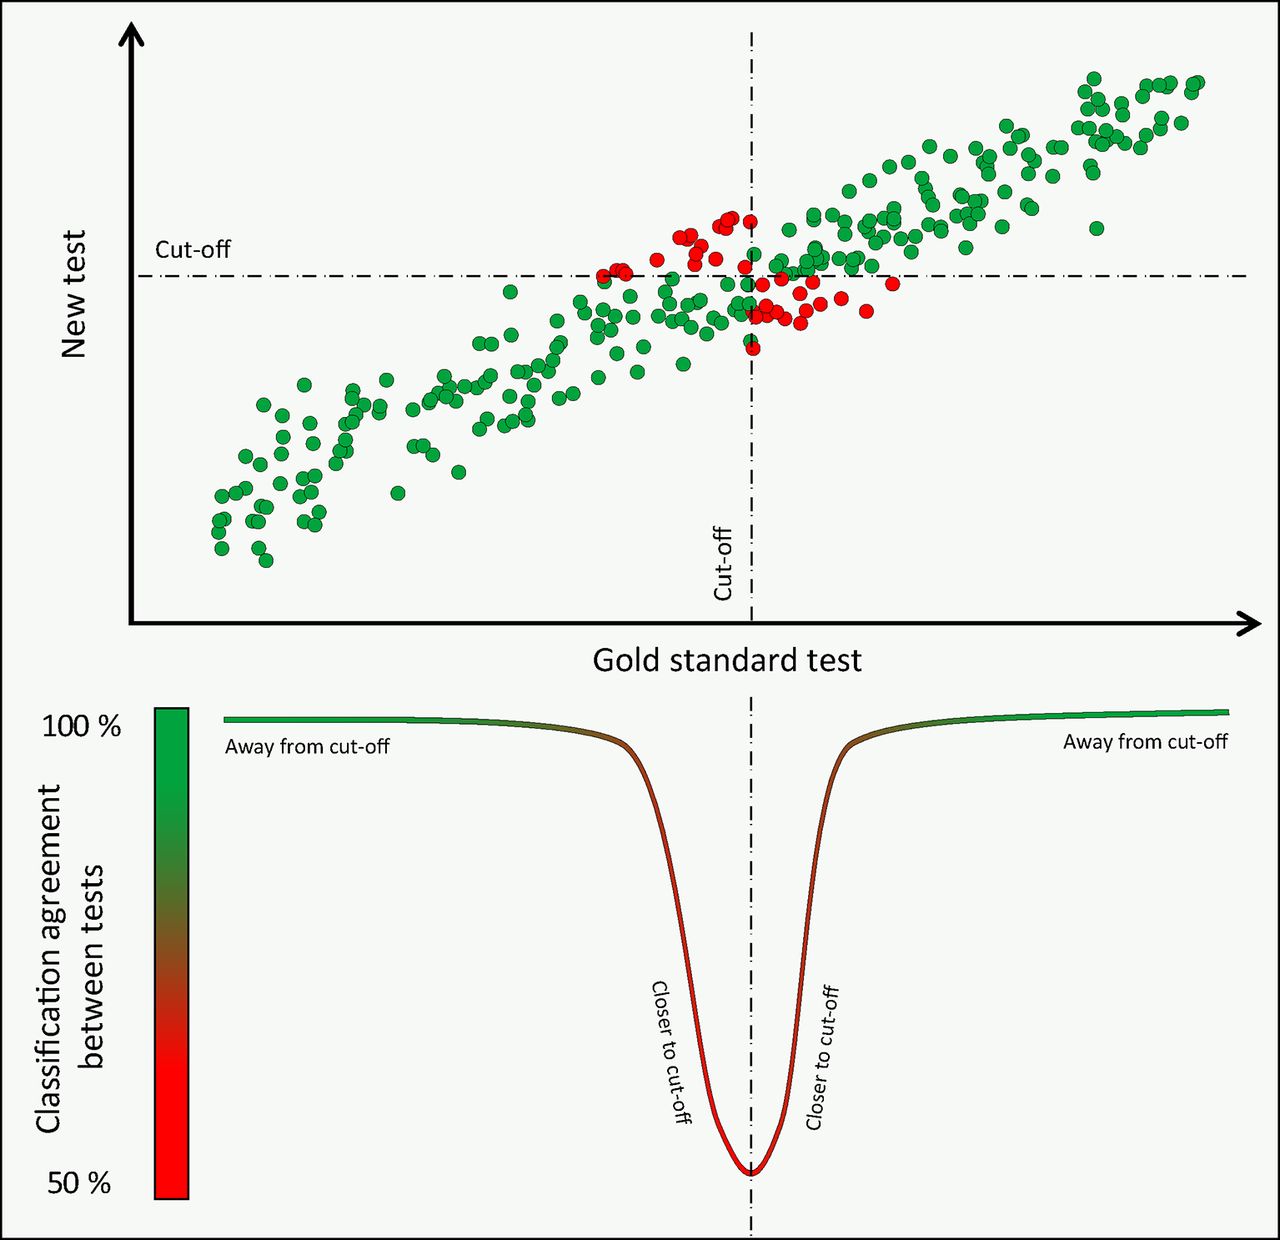
Disease severity and classification agreement between methods: schematic representation of the principle that classification agreement between two methods of measurement (or diagnostic accuracy if one is seen as a reference gold standard) varies across the range of disease severity. At the extremes of disease and health agreement is 100%. Close to the classification cut-off, around the intermediate range of disease severity, agreement falls, reaching a nadir close to 50%.
In the present study, we aim to explore the specific effect of disease severity distribution on values of diagnostic accuracy and related statistical measures. As a solution, we propose the use of the accuracy V-plot, a novel, sample-independent method to calculate and present accuracy values.
Methods
Hypothetical studies on a new method to measure serum cholesterol
This study used a hypothetical comparison between a new method to measure serum cholesterol (Cholrapid) and an established gold standard (Cholgold). The relationship between the two methods was compared in two different samples, artificially generated using statistical software (Mathworks, Natick, Massachusetts, USA):
Validation study sample: generated from 238 random values of cholesterol (Cholgold), not normally distributed, ranging from 2.9 mmol/L to 8.9 mmol/L, with a mean of 5.9 mmol/L.
Primary care, clinical study sample: generated from a narrower spread of 987 random, normally distributed values of cholesterol (Cholgold), ranging from 3.6 mmol/L to 7.6 mmol/L, with a mean of 5.8 mmol/L and SD of 0.58 mmol/L.
In both samples 1 and 2, Cholrapid values were randomly generated keeping the mean difference with Cholgold close to 0 (0.05 mmol/L for sample 1 and 0.02 mmol/L for sample 2) and using a fixed SD of the difference (SDD) between methods (SDD sample 1=0.36 mmol/L and SDD sample 2=0.35 mmol/L).
The relationship between the two methods (Cholrapid and Cholgold) was then compared in each sample using the following parameters:
Numerical relationship was evaluated using scatter plots and Bland-Altman plots.
Categorical relationship: diagnostic accuracy (or classification agreement between methods, defined as the total number of correctly classified data points divided by the total number of data points), sensitivity, specificity, positive and negative predictive values, positive and negative likelihood ratios and area under ROC curves. For the qualitative analysis, an arbitrary value of 5.7 mmol/L for Cholgold and Cholrapid values was defined as normal.
The V-plot of accuracies
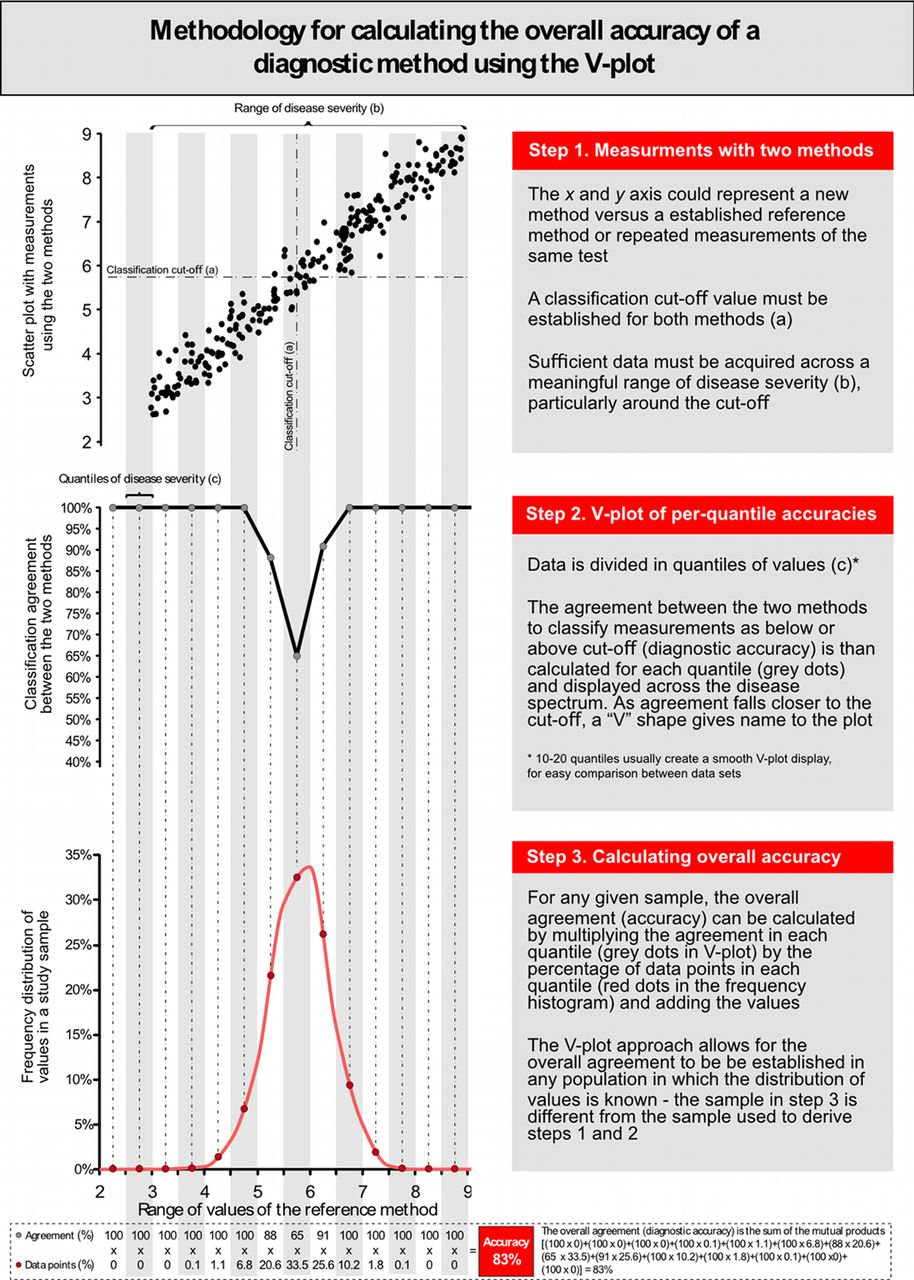
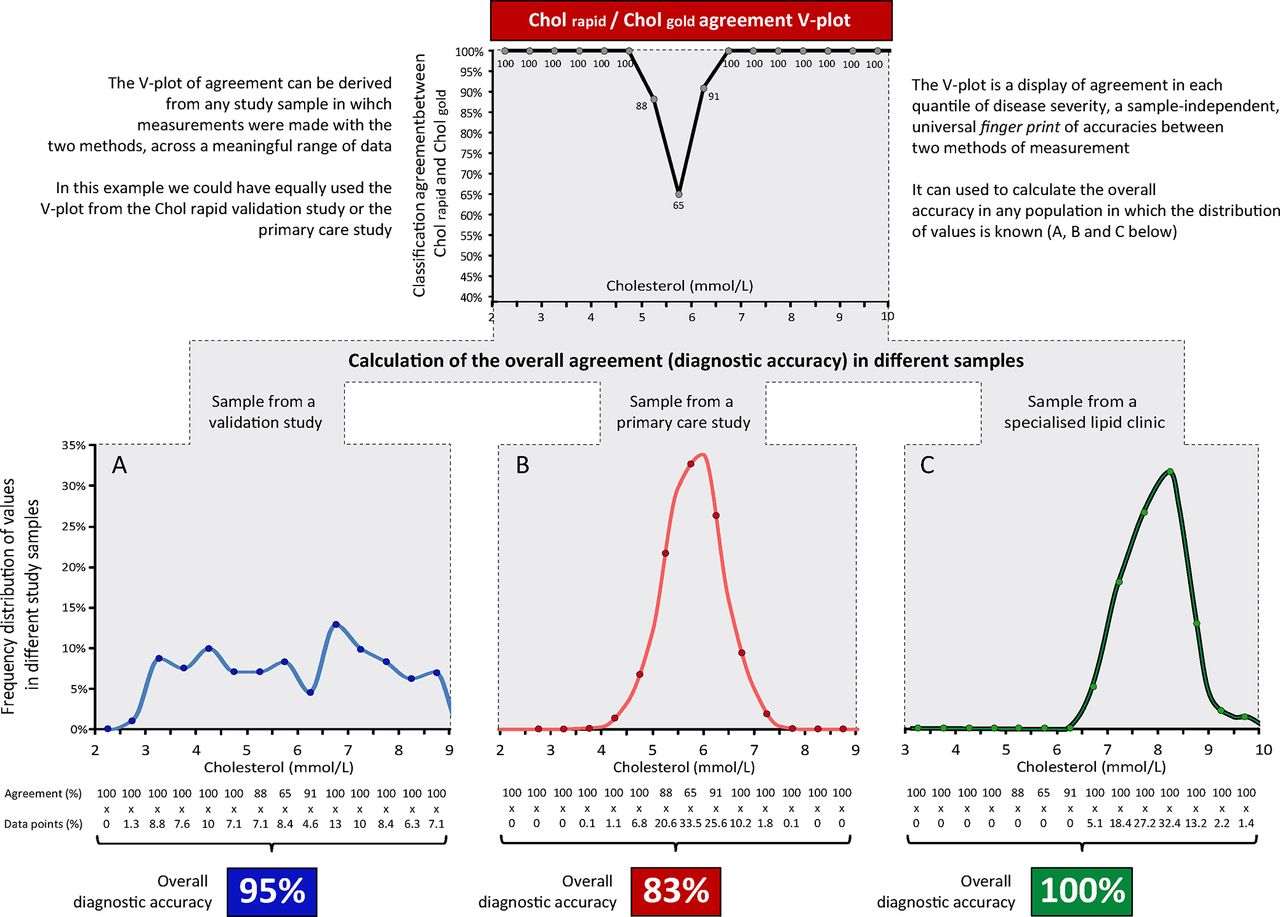
We introduce a novel methodology to calculate and present classification agreement (accuracy) between methods, whereby the accuracy of Cholrapid is calculated and displayed across multiple quantiles of disease severity (from 2 to 10 mmol/L in 1 mmol/L bands). Finally, we proposed a method to estimate the accuracy of Cholrapid in independent samples in which the frequency distribution of Cholgold is known (a detailed stepwise approach to V-plot derivation is presented in figures 6 and 7).
Results
The characteristics of the samples generated as well as the relationship between Cholrapid and Cholgold in each sample are presented as a series of hypothetical studies to facilitate the interpretation of our results into clinical practice.
A new diagnostic method for the screening of hypercholesterolaemia
Imagine investigators developed a new method to measure serum cholesterol that uses an infrared scan of the finger and yields an immediate value. The expectation was that this new test (Cholrapid) could be used in the primary care to screen for hypercholesterolaemia without the need for a needle or formal laboratory test and would enable identification of patients at high risk of cardiovascular events and lead to early initiation of therapy.
An initial large validation study was required before its implementation in clinical practice, so Cholrapid had to be tested against the gold standard method of measuring cholesterol in the biochemistry laboratory (Cholgold). The validation study tested Cholrapid performance across a wide range of cholesterol values. Therefore, 238 patients were recruited from multiple clinical settings: healthy young volunteers with no history of cardiac disease, patients with multiple risk factors from a cardiovascular clinic and patients from a specialised hyperlipidaemia outpatient service. For the purpose of diagnostic classification, a cholesterol result of 5.7 mmol/Lor above was considered hypercholesterolaemia.
The results of this initial study confirmed early expectations, with Cholrapid showing an accuracy of 95% to diagnose hypercholesterolaemia, with a sensitivity of 95% and area under the ROC curve of 0.99 and positive and negative likelihood ratios of 23.75 and 0.05, respectively. Figure 2A summarises Cholrapid diagnostic performance.
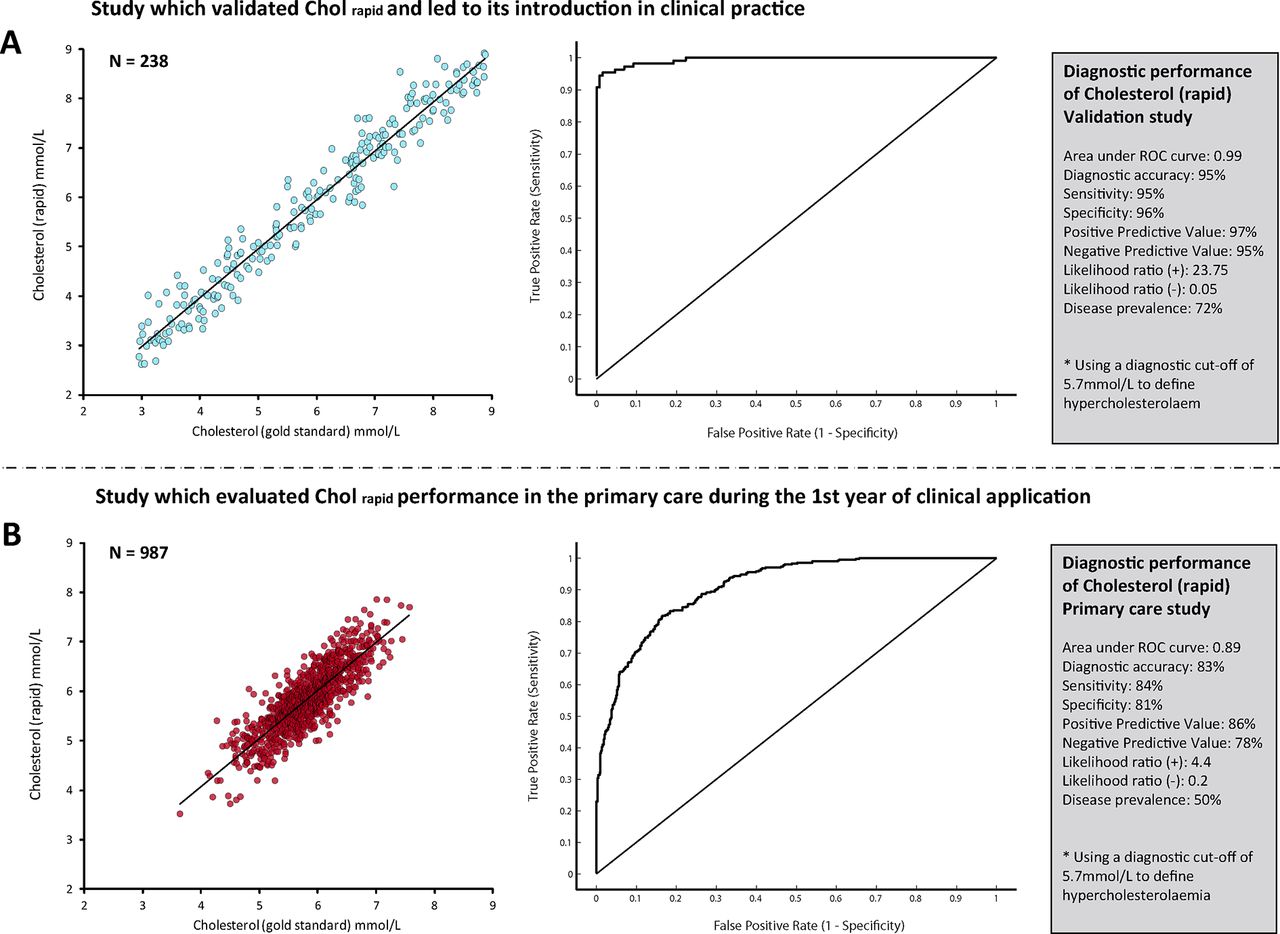
Diagnostic performance of the new cholesterol test. The performance of the new cholesterol test (Cholrapid) changed significantly between the two studies. The overall accuracy of Cholrapid to diagnose hypercholesterolaemia fell in the primary care retrospective cohort (B), when compared with the initial validation study (A). Values of area under ROC curve, sensitivity, specificity and predictive values were also largely different. ROC, receiver operator characteristic.
As a result, Cholrapid was approved to be implemented in a large primary care unit for a period of trial. For 1 year, patients from the community with at least one risk factor for cardiovascular disease started having their cholesterol measured with Cholrapid. During this initial clinical evaluation, however, blood samples were still sent for standard laboratory analysis (Cholgold), for a period of real-world comparison.
At the end of the first year of its utilisation, investigators re-evaluated Cholrapid diagnostic performance, comparing it against the same gold standard measurement Cholgold. The results of this second retrospective analysis were very disappointing. Cholrapid diagnostic accuracy to identify patients with hypercholesterolaemia fell to 83%, with a significant drop in sensitivity (84%), area under ROC curve (0.89) as well as a significant change in positive and negative likelihood ratios (4.4 and 0.2, respectively) (figure 2B). As a result, a primary care safety committee decided to temporarily withhold Cholrapid utilisation until a comprehensive assessment of its reliability was carried out.
The health authority looked into the reasons for such discrepancy between the final validation study and its first year of implementation but found nothing obvious: the technique applied was exactly the same, with comparisons made against Cholgold tested in the same biochemistry laboratory.
The fundamental relationship between Cholrapid and Cholgold remained unaltered in the two studies, as shown by the degree of vertical dispersion of values (raw measurement disagreement) in both scatter plots (figure 3A). The stable relationship between the two methods can also be demonstrated in the form of Bland-Altman plots (figure 3B), which reveals that the 95% limits of agreement were almost identical in the two studies.6
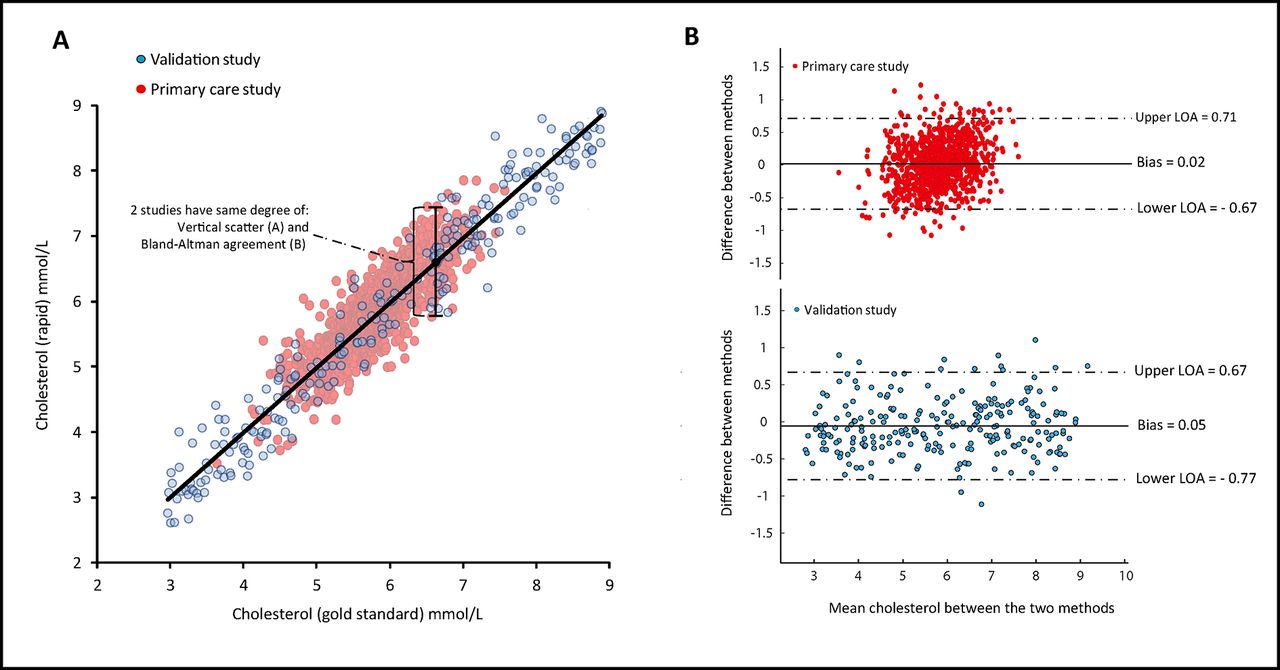
Numerical agreement between Cholrapid and Chogold is equal between studies. Despite different magnitudes of classification agreement (diagnostic accuracy) between Cholrapid and Cholgold in the two studies, the raw measurement disagreement between the two methods remained unchanged. This can be appreciated from measures of the vertical scatter such as the SE of the estimate (plot A) and from Bland-Altman plots (B). It can be inferred that the observed drop in Cholrapid performance in the primary care study cannot be explained by a change in its true measurement performance. LOA, limits of agreement.
Therefore, the significant reduction in Cholrapid diagnostic performance between studies (accuracy, ROC curve, sensitivity and so on) can be entirely explained by how differently cholesterol values were distributed in the two samples (figure 4). The specific explanation is that the studies differed significantly in what proportion of patients had cholesterol values close to the diagnostic cut-off of 5.7 mmol/L; while the initial validation study included patients with a wide range of cholesterol values (and so a large proportion of them far away from the cutpoint), the primary care study was mainly formed by patients with intermediate values of cholesterol, straddling the cut-off value, that is, the region where most disagreements occur. Differences in the distribution of cholesterol values, rather than in the actual measurement performance of Cholrapid, were responsible for the different accuracy values (figure 1).

Histograms of cholesterol values from both studies. While the validation study included patients with a wide range of cholesterol values, the primary care cohort was formed predominantly of patients with intermediate values of cholesterol. This difference was responsible for the significant drop in Cholrapid accuracy reported in the primary care study.
The V-plot: a per-range display of accuracy values
To circumvent the sample dependency of overall accuracy values, instead of simply calculating an overall value of diagnostic accuracy for the whole study population, we propose to calculate the classification agreement between methods in each part of the spectrum of disease severity. This results in several per-quantile values of accuracies, which can be displayed across the entire range of disease severity to generate a V-shaped plot, which gives name to the method (figure 5). The V-plot has this shape because the accuracy of tests is universally high at the extremes of disease severity (near 100%) but close to the classification cut-off agreement plunges to around 50%. The width of the mouth of the V can be used as a general measure of a test’s performance: the wider the V, the poorer the test ability to match a reference modality.

The V-plot of accuracies of Cholrapid. The V-plot permits a visual demonstration that the classification agreement between Cholrapid and Cholgold is equal in the two studies in each quantile of disease severity. The overall classification agreement (diagnostic accuracy of Cholrapid) could change between studies, depending on the proportion of patients in each quantile. The V-plot consistently identifies the range of cholesterol values within which the agreement between tests is lower than 90% (dashed lines).
The V-plot is, therefore, a universal fingerprint of per-quantile classification agreement between two methods of measurement, which can be expressed independently of the distribution of values of the underlying sample. This can be demonstrated by displaying the V-plot from the two Cholrapid studies (figure 5). Despite marked differences in the distribution of cholesterol values and very different diagnostic accuracies, the V-plots from the two studies are almost identical. This can be interpreted as the two studies showing the same degree of classification agreement between Cholrapid and Cholgold across the spectrum of cholesterol values. Figure 6 explains in details the steps for the display of the V-plot and for the calculation of the overall accuracy in a sample.

Methodology for the calculation of per-range agreement and V-plot display.
Using the V-plot to derive overall accuracy in independent samples
Once the V-plot has been established for the relationship between any two indices, the overall agreement between them can be projected to any other distribution of severity. For example, once a V-plot is derived from either of the two Cholrapid studies, it is possible to estimate the classification agreement between Cholrapid and Cholgold for a specialised outpatient lipid clinic, which is mainly formed by very high cholesterol levels (figure 7).

Calculating the overall accuracy in different samples using the V-plot. The V-plot agreement between Cholrapid and Cholgold can be derived from any study that compared the two methods (top panel). It can be used as a fingerprint of classification agreement to calculate the overall agreement between Cholrapid and Cholgold in any sample in which the distribution of cholesterol values is known (samples A, B and C).
The simple mathematical approach to the application of the V-plot is described in figure 6. We have also made a spread sheet available, which can derive the V-plot agreement between any two methods of measurement and calculate the overall accuracy in samples with different distributions of values (online supplementary appendix).
Supplementary file 1
Discussion
Choosing tests based on their reported accuracy
Classification agreement between two methods of measurement is called diagnostic accuracy if one test is considered the reference gold standard. The concept of accuracy is appealing, because it gives clinicians a standardised, dimensionless measure of how good a test is (the ideal test being 100% accurate).7 Neither measures of the vertical scatter in a correlation plot (the SE of the estimate, a measure of numerical disagreement) nor the calculation of limits of agreement using Bland-Altman plots is as instantly appreciated by all clinicians. For instance, busy clinicians would much more confidently adopt a test that is described as 95% accurate to detect hypercholesterolaemia than choose it based on a reported 0.35 mmol/L SE of the estimate against a reference method. However, our study demonstrates the limitations of adopting tests based on published high accuracy values, without knowing the sample from which accuracy was calculated.
Disease distribution, disease prevalence and diagnostic accuracy
The impact of disease prevalence on diagnostic accuracy and derived metrics has been previously explored.4 8 It is widely perceived that diagnostic metrics more closely reflect a test’s performance when disease prevalence is near 50%.4 Our hypothetical yet precisely controlled model of the relationship between two diagnostic methods brings interesting insights into this established statistical concept. First, our example confirms that accuracy, sensitivity, specificity and likelihood ratios are largely sample-dependent measures of a test performance. The values of all metrics changed largely between our two hypothetical samples, with less discriminative values found in the normally distributed sample formed by intermediate values of cholesterol and disease prevalence of 50% (figure 2). Second, our results highlight that the precise distribution of values across the disease spectrum (and not only the overall prevalence of disease) is what predominantly affects values of accuracy and related metrics. For instance, a sample formed by very severely diseased and very healthy individuals, away from the central cut-off (in a ‘case-control’ fashion), is likely to derive very high values of accuracy (close to 100%) with a disease prevalence that can be close to 50%.9 10 In contrast, samples formed by intermediate values of disease, near the boundary between normal and abnormal, can also demonstrate 50% disease prevalence yet much lower values of accuracy (figure 1). In practice, mixtures of patients from these types, and other types in between, can generate any degree of diagnostic accuracy from 100% down to approximately 50% for all diagnostic tests and definitions of severity.
Disease severity distribution varies widely between studies
Studies that first evaluate diagnostic methods are often performed in samples whose distribution is very different from the populations in which the test will be applied in clinical practice.11 12 Commonly, pioneering research is performed in patients who either definitely have or definitely do not have a condition, in a case–control fashion or using a much wider spread of patients than is found in routine clinical practice.13 Values of accuracy and related parameters of a newly proposed methodology are universally presented, most commonly without a precise description of sample distribution of values. Rarely a frequency histogram is presented. While the desire to examine the whole spectrum is understandable, researchers may unknowingly be presenting values of a test accuracy that cannot be extrapolated to other studies nor are applicable to routine clinical practice. Physicians should realise that clinical populations often have substantially more patients in the middle zone, which inevitably lowers the accuracy of diagnostic methods.14 Therefore, for the relationship between any two methods of clinical measurement, there are no universal values of diagnostic accuracy, sensitivity, specificity, predictive values, ROC curves or even likelihood ratios. These parameters are only meaningful to demonstrate the effects of the raw measurement disagreement between the two methods (vertical scatter; figure 3) in a specific sample when a specific classification cut-off is used to define what is normal/abnormal. Although the scientific community emphasises the importance of studying new diagnostic methods in clinically relevant samples,2 5 this matter is rarely debated when the accuracy of new diagnostic methods are published.15–17
Potential benefits of the V-plot of accuracies as a sample-independent display of the relationship between methods
In this study, we introduced the V-plot of accuracies, a simple visual approach that could help researchers and clinicians to better understand the relationship between diagnostic tests. First, the V-plot of accuracies allows interstudy comparisons, even if sample distributions differ (figure 5). For instance, if a new diagnostic method to measure cholesterol is developed, its V-plot of per-range accuracy against Cholgold can be immediately derived and compared with the previously published V-plot of Cholrapid. While the values of overall accuracy may not be directly compared if samples are different, using the V-plot one can immediately appreciate at which point within the spectrum of cholesterol values the diagnostic accuracy of the new cholesterol test falls below a certain standard. For instance, in our two studies, Cholrapid accuracy fell below 90% when cholesterol values were between 5.2 mmol/L and 6.3 mmol/L (figure 5). In practice, therefore, outside this window, Cholrapid could be seen as >90% reliable and used for clinical decision making, while Cholgold might still be requested in the 5.2–6.3 mmol/L uncertainty zone to confirm the diagnosis. Such hybrid approach to clinical diagnosis (trusting screening tests when results are very normal or very abnormal but requesting the gold standard in the middle zone) is often used in clinical practice instinctively.18 Our proposed V-plot methodology permits a formal statistical representation of such staged approach by establishing ranges of values outside which tests can be trusted to match a gold standard.
Also, as presented in figure 7, once one V-plot between methods has been established, the overall accuracy of the new test can be derived in any given sample, providing the frequency distribution of values is known. This method to derive overall accuracy in independent samples from a previous established V-plot is potentially useful if researchers or clinicians want to estimate the overall performance of new modalities without the need to collect new comparative data.
Online appendix for V-plot derivation
We have created an online appendix in Excel format to allow readers to apply the V-plot methodology to their own datasets. Readers can adapt the calculation steps to their needs and add CIs to each quantile accuracy.
Alternative derivations and future work on methodology
The V-plot of accuracies could be displayed in two alternative ways. First, the average between methods could be used to define disease range (the x-axis on the V-plot), if they are both felt to measure exactly the same quantity, in line with Bland-Altman plots. In our example, average values between Cholrapid and Cholgold could be used instead of Cholgold only. The limitation of such approach is that frequency distribution of values are normally presented using histograms of the establish method and not the average between the two tests, which would limit the applicability of the V-plot to other samples. Second, the new method could be used in x-axis to define the range and quantiles (Cholrapid in our example). This would allow a more directly applicable display of results as, in practice, clinicians are first faced with the results of the new test (before requesting the reference method if felt necessary). In our example, if the per-range accuracy of Cholrapid was displayed using the Cholrapid range of values in the x-axis, one would immediately appreciate at which point close to its cut-off it starts losing accuracy against Cholgold. This approach would also permit interstudy comparisons between different methods, providing the gold standard methodology was the same.
We specifically did not display CIs for each individual quantile accuracy. First, the aim of the V-plot was not to detect with precision each quantile accuracy, but instead to use the trend between quantiles to establish an overall pattern of accuracy loss from the extremes towards the intermediate range close to the cut-off. Second, the trend from the V-plot line between neighbouring quantiles act as external validity for each quantile accuracy, beyond the small sample of each quantile. As a result, to avoid overload of information to readers, we opted not to display CIs for each quantile when we first applied the methodology in real datasets.14 We have published an alternative V-plot methodology using logistical regression that derive 95% CIs using bootstrap.19 However, logistical regression is a modelling approach with intrinsic limitations, while the methodology presented in this manuscript is derived from accuracy values directly calculated in each quantile. Researchers can easily add CIs for each quantile in the spreadsheet provided (online supplementary appendix), simply by treating each quantile accuracy as a proportion and applying simple statistics.
Limitations
The V-plot is intended to display accuracy values of a new method of measurement when quantitative variables are categorically transformed into normal and abnormal according to a pre-established cut-off. It is therefore essential for least one of the methods to be numerical so that its range of values can be displayed in the x-axis.
The V-plot describes the accuracy of a new diagnostic test to categorically match a reference method. Therefore, it assumes the ‘gold standard’ test to be an appropriate and reliable representation of the underlying variable being measured (in our example serum cholesterol).
Also, although the present hypothetical study used an example in which the numerical relationship between methods was constant across the disease spectrum (homoscedasticity assumption), the V-plot methodology could also be applied to data when heteroscedasticity is found.
How to deal with quantiles with no data points? If a quantile has no data at the extremes of the distribution, investigators could simply (1) not display the V-plot values at that range or (2) assume in a reasonably normally distributed sample without major heteroscedasticity that the accuracy in that range will remain 100% if it is already 100% in the immediately neighbour inner range (such as for cholesterol values below 3 in our figure 6). If a quantile has no data points in the middle of the disease distribution, then investigators could (1) increase their sample size, (2) decrease the number of quantiles being used, so that the absent quantile becomes merged with neighbour quantiles or (3) visually interpolate the V-plot line between the neighbouring quantiles, assuming accuracy in the absent quantile will be roughly the average of its neighbours.
This study is based on a hypothetical research scenario, and the data were created using statistical software. While this approach has limitations as data were not actually collected from patients, it allowed for a precise isolation of statistical parameters of interest and permitted a very focused analysis of the effects of data distribution on accuracy values. The V-plot methodology has already been applied to real data previously.14 19
The present study does not aim to discuss the clinical merits of cholesterol treatment neither the appropriateness of using a fixed cut-off for clinical decision making. The hypothetical clinical scenario of a new test to measure cholesterol was chosen to illustrate a practical application of our methodology to a wide clinical readership.
Conclusions
For any given clinical test being compared with a gold standard, there is no universal value of diagnostic accuracy, sensitivity, specificity, predictive values, likelihood ratios or ROC curves. Accuracy will always vary progressively from almost 100% at the extremes (of health and disease) to approximately 50% (close to pure chance) near the diagnostic cut-point. Disease prevalence and the precise distribution of values in the underlying sample (extremes versus intermediate) can therefore completely control the obtained value for a test’s diagnostic accuracy. A test should not be chosen by clinicians based on a reported high accuracy value, unless the disease distribution of the study sample is known to be clinically relevant.
The V-plot of accuracies presented here exposes the variation of diagnostic accuracy along the spectrum of disease and is therefore a truly sample-independent display of categorical agreement between two methods of clinical measurement. Once derived for the relationship between two methods of measurement, the V-plot allows for the overall diagnostic accuracy to be estimated in separate samples where frequency distribution is known.
References
Footnotes
Contributors All authors contributed to the content of this study, including study design and critical review of final manuscript.
Funding RP is an NIHR Walport Clinical Lecturer and British Heart Foundation fellow (FS/11/46/28861). DPF (FS 04/079) is a British Heart Foundation fellow.
Competing interests None declared.
Provenance and peer review Not commissioned; externally peer reviewed.
Data sharing statement There are no additional data available for this article.