Article Text

Abstract
Objective Many patients with heart failure (HF) do not receive recommended treatments, resulting in suboptimal outcomes. We aimed to investigate the impact of implementing recommended HF therapies on health outcomes, and the costs and effectiveness of interventions for improving adherence.
Methods The health benefits of ACE inhibitor (ACEi), beta blockers and optimal therapy (ACEi and beta blockers if not contraindicated) following hospitalisation for HF were combined with evidence on uptake. The aim was to examine how much health was lost as a result of failure to follow guidelines, and how much could be gained using strategies to promote uptake.
The net health benefits of different treatments (measured in quality-adjusted life-years (QALY)) were estimated using a decision-analytic model and treatment effectiveness from the literature. Data on the number of patients who would have benefitted from the additional treatments were estimated from 2010 to 2013 using the National Heart Failure Audit.
Results Each recommended treatment was associated with positive net health benefit. In 2010, up to 4019 (38.3%) patients would have benefitted from additional treatments rising to 4886 patients in 2013 (although falling to 25.2% of patients). Failure to follow guidelines resulted in large health losses. In 2010, if all patients had received optimal therapy, 1569 QALYs would have been gained, implying a maximum justifiable investment in interventions to promote uptake of £31.4 million.
Conclusion Current gaps in translation of evidence to practise in hospitals are associated with significant health losses. Strategies to encourage uptake of guidelines could be effective and cost-effective.
- heart failure
- heart failure treatment
- beta blockers
- angiotensin converting enzyme
This is an Open Access article distributed in accordance with the Creative Commons Attribution Non Commercial (CC BY-NC 4.0) license, which permits others to distribute, remix, adapt, build upon this work non-commercially, and license their derivative works on different terms, provided the original work is properly cited and the use is non-commercial. See: http://creativecommons.org/licenses/by-nc/4.0/
Statistics from Altmetric.com
Key questions
What is already known about this subject?
Many physicians fail to follow clinical guidelines resulting in substandard care for patients and worse health outcomes.
Following discharge from hospitalisation for heart failure, many eligible patients do not receive recommended treatment with ACE inhibitors and beta blockers.
What does this study add?
This study combines evidence on the failure to follow guidelines in heart failure with evidence on the costs and effects of treatments to quantify the health lost as a result of poor adherence to guidelines.
The maximum that could be justifiably invested in strategies to improve adherence to guidelines is estimated.
How might this impact on clinical practice?
This study shows the importance of following evidence-based guidelines and the benefits of investing in strategies to improve adherence.
Introduction
Clinical guidelines are developed with the aim of improving the quality of care by providing physicians with advice on the most effective and cost-effective treatments based on the available evidence.1 However, evidence suggests that many physicians fail to follow clinical guidelines, resulting in potentially substandard care for patients and, therefore, worse health outcomes.2 3 Improving the uptake and implementation of effective and cost-effective health technologies is one of the priorities of the National Health Service (NHS).4 Implementation of guidelines can be encouraged with activities that address barriers to uptake and promote adherence to recommended forms of clinical management. Such implementation activities include audits and feedback, training, decision support systems and outreach activities.5 These implementation activities have varying costs and effectiveness6 and, as they use resources that could be used for other healthcare activities, they should be evaluated using methods that are consistent with those used to assess the value of healthcare interventions such as pharmaceuticals and medical devices. That is, the health benefits of the activities should be compared with the benefits of other healthcare activities which could be funded using the same resources (the health opportunity cost).
The National Heart Failure Audit (NHFA), which began in 2007, collects data on the management of patients with heart failure (HF) in England and Wales. It focuses on clinical indicators that have a proven link to improved outcomes and has accumulated information on over 200 000 records of HF hospital episodes.7 The NHFA suggests that not all patients with HF are receiving treatment according to guidelines.8 In particular, UK guidelines recommend that, following hospitalisation for HF, patients should receive ACE inhibitors (ACEi) and beta blockers (BB) as first-line therapy.9 A recent study of the NHFA has shown that, while treatment with ACEi and BBs has been improving over time, many patients are still not receiving these therapies: in 2013, only 81.7% of patients who were eligible were receiving BBs and 83.7% were receiving ACEi.8
The objective of this analysis is to understand the potential population health benefits of more fully implementing the recommended guidelines in HF and the costs and effectiveness of different methods of enhancing implementation. Specifically, we aimed to estimate the benefits of maximising the uptake of ACEi and BBs following discharge from hospital for HF in England and Wales.
Methods
Previous research has demonstrated how to assess the value of improving the uptake of treatments.10–16 Estimating the benefits of improving the uptake of ACEi and BBs following discharge from hospital for HF in England and Wales requires quantification of the health effects of the treatments to each patient; the total health that is lost across the population as a result of patients not receiving the treatments; and the potential improvements in health associated with different implementation strategies. To estimate these the following are required: (1) the value of the treatment (ie, the magnitude of its cost-effectiveness in terms of net health benefit (NHB)); (2) the scope for improving the treatment’s uptake (ie, how many patients are not currently receiving treatments that are defined as appropriate for them in guidelines?); and (3) the effectiveness and cost of strategies for improving uptake.15 These can then be used to make a number of assessments which are discussed below.
Net health benefit
The first assessment is the cost-effectiveness of the treatments themselves, defined here in terms of the incremental NHB. Health is measured using quality-adjusted life-years (QALY), a generic health outcome measure which captures both survival duration and health-related quality of life (HRQoL) reflected as weights between 1 (good health) and 0 (death).17 The NHB is the gain in health to the patient less the health lost as a result of any additional cost of the treatments which result in resources not being available for other patients’ care (the health opportunity cost). When the incremental NHB is positive, the treatment is cost-effective. The National Institute for Health and Care Excellence (NICE) considers a treatment to be cost-effective if it delivers greater health benefits than the forgone health associated with any additional cost displacing other activities elsewhere in the NHS, estimated using a cost-effectiveness threshold of £20 000–£30 000 per QALY18 (ie, more than 1 QALY must be gained for every £20 000–£30 000 extra spent as a result of treatment for it to be considered cost-effective). This implies that every £20 000–£30 000 expenditure in the NHS generates an additional QALY, although NICE thresholds may also seek to reflect other factors such as the value of innovation.18 Empirical research suggests that, as a measure of the health opportunity cost, the cost-effectiveness threshold may be lower than this range at about £13 000 per QALY.19
Expected value of perfect implementation
The second assessment relates to the gains from improving the uptake (or implementation) of treatments within the NHS. The expected value of perfect implementation is the maximum potential gain to the NHS of increasing uptake from its current level to one that includes all patients for whom it is recommended.12 It can be shown in terms of population health and this represents the QALYs that could be generated by full implementation. It can also be shown in monetary terms: the maximum justifiable investment in implementation activities for that intervention that the health system can consider cost-effective. Any activities costing more would represent a net loss of health and hence would not be cost-effective. The expected value of perfect implementation increases the greater the number of patients, the lower the current uptake rate of treatment and the greater the incremental NHB.
Expected value of specific implementation
The expected value of specific implementation is the gain associated with increases in utilisation that are related to specific implementation interventions. Again, it can be expressed in terms of population health as the net QALYs gained from an intervention. Or it can be shown in monetary terms as the maximum that the system can invest in those activities on a cost-effective basis. These increases in utilisation are unlikely to achieve full implementation. The value of the implementation activity represents the benefits of the activity over and above its costs and corresponds to the difference between the expected value of specific implementation and the cost of the implementation activity. The value of the implementation activity is higher the lower the cost of the implementation activity and the greater its effectiveness. These assessments are now considered in turn for the case of HF.
Evidence
Incremental NHB of treatment
To estimate the incremental NHB of treatments for chronic HF (CHF) a cost-effectiveness model was developed. This model evaluated the costs and benefits of treating patients with CHF discharged following a hospitalisation for HF with ACEi, BBs, aldosterone antagonists (AA) and combinations thereof. The health benefits patients experience result from reductions in the absolute risks of clinical events (such as mortality and hospitalisation) and are a function of the relative effects on those risks of the range of treatments used for HF. Therefore, AAs are included in the analysis to account for their impact on the health benefits of improving the prescribing of ACEi and BBs. The cohort reflected in the model is based on patients in the NHFA with a starting age in the model of 75 years for men and 80 years for women, with 44% of the cohort being women.
The model is based on an analysis undertaken by the NICE National Guideline Centre (NGC).20 Three health states were used to reflect patients’ prognosis posthospitalisation for acute HF (AHF): CHF, readmission for subsequent AHF and death. Patients begin in the CHF state and remain in this state until they are readmitted for subsequent AHF or they die. Patients readmitted for AHF may be discharged from hospital and re-enter the CHF state or they may die.
Survival rates were estimated for patients with left ventricular systolic dysfunction who survived to discharge with no treatment (4.2 years’ follow-up).21 Baseline readmission data were taken from a population-based study of hospitalisation in CHF.22 Relative treatment effects from clinical trials were then applied to these baseline survival rates to estimate the impact of treatment. Online supplementary appendix table A1 shows the relative treatment effects on mortality and readmission that were applied in the model based on a meta-analysis conducted by the NGC.20
Supplementary file 1
An HRQoL weight of 0.752 was used for patients with CHF based on the distribution of New York Heart Association functional classes (I–IV) in the BATTLESCARRED trial and HRQoL weights for each class from another study.23 24 A weight of 0.688 for patients with AHF was used based on unpublished data from the SHIFT trial.20 Costs of cardiology care, specialist follow-up and pharmaceutical treatments were included based on published costs.
Results are presented in terms of the incremental NHBs of treatment(s) compared with the comparator.17 The incremental NHB is determined by how patients would be treated otherwise (ie, the counterfactual: what the patient would receive if they were not treated with the intervention of interest). To reflect the health opportunity costs falling on other types of patients, the lower range of NICE’s cost-effectiveness threshold is used which indicates that 1 QALY is lost for other patients for an additional £20 000 of expenditure on HF treatments. The recent empirical estimate of 1 QALY lost per £13 00019 additional expenditure is used in sensitivity analysis.
Current uptake of treatment in England and Wales
To calculate the value of perfect implementation, estimates of the current uptake of treatment are required. Emdin et al have previously examined the adherence to treatment guidelines for patients discharged from hospital following admission for HF using NHFA data.8 As part of the current analysis, these data were reanalysed to establish the potential for improving uptake of ACEi, BBs and optimal therapy (one or both of ACEi and BBs if not contraindicated) for the years 2010–2013. Not all patients are clinically eligible to receive all these drugs as they may be contraindicated to one or more treatments. Contraindications were recorded in the NHFA and the analysis takes account of contraindications, so only benefits from treatments for which the patient is eligible are captured. For example, if a patient is on a BB and is contraindicated for ACEi, they are already considered to be receiving optimal therapy and have no capacity to benefit from changing treatment.
Effectiveness and cost of implementation activities
The effectiveness of interventions aimed at increasing the implementation of HF treatments depends on their design and specification. Limited evidence is available on the effectiveness and costs of different strategies and it is unclear whether the available evidence would be transferable to HF. Further, there is limited evidence on the duration of any effects. Therefore, the benefits of different absolute improvements in uptake over 1 and 5 years were estimated to demonstrate the maximum cost at which a strategy achieving these would be cost-effective (with 5-year estimates discounted to present value). It is assumed that the absolute proportionate increase in uptake is split among the different patient groups who could benefit from moving to optimal therapy based on the number in each group who could benefit (ie, those on no therapy, only on BBs or only on ACEi). Interventions are likely to have impact beyond the duration of any efforts involved and it is unclear how long the benefits of an intervention will last. By presenting results over 1 and 5 years a range of potential benefits are presented.
Results
The incremental NHB of treatment
Table 1 presents per patient NHB and net monetary benefit of the addition of ACEi or BBs to the possible alternatives. All treatments are cost-effective at both cost-effectiveness thresholds. One treatment addition (ACEi compared with no treatment) is actually dominant with a health gain and lower costs to the NHS resulting from the costs of the drugs being more than offset by the downstream cost savings from the reduced rate of clinical events.
Cost-effectiveness of treatment with ACE inhibitors or beta blockers among eligible but untreated patients in terms of net health benefit (QALYs)
Uptake of treatments and scope for improved treatment
Figure 1 presents information on the number of patients who would have benefitted from the addition of an ACEi, BBs or optimal therapy, and the number of patients who received no treatment or treatment with ACEi, BBs or both from 2010 to 2013. Throughout the period, the total number of patients discharged following hospitalisation for HF increased. However, the total number who would have benefitted from improved uptake remained relatively stable over time even as the total number of patients increased. In 2010, up to 4019 patients (38.3%) would have benefitted from one or more therapies. This increased to 4886 patients in 2014 although represented a smaller percentage of all patients (25.2%).
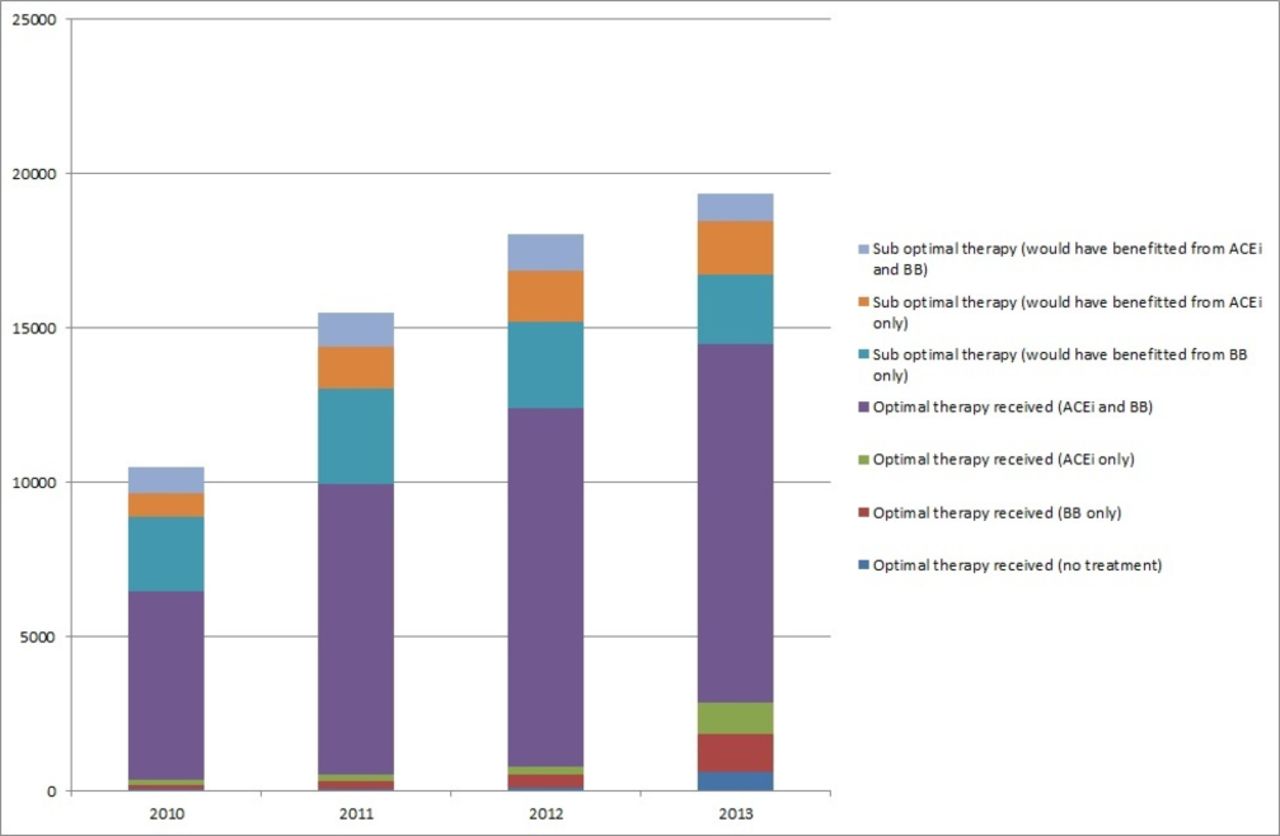
Number of patients who would have benefitted from addition of ACE inhibitor (ACEi), beta blockers (BB) or optimal therapy (one or both of ACEi and BB) and the number of patients who received no treatment or treatment with ACEi, BB or both from 2010 to 2013.
Expected value of perfect implementation
Figure 2 shows the value of perfect implementation for BBs, ACEi and optimal therapy, for 2010–2013, if all patients who were eligible received BBs, ACEi or optimal therapy. For example, in 2010, if all patients who had been eligible had received ACEi, there would be a population NHB of 393 QALYs, implying a maximum justifiable investment by the NHS in implementation activities of £7.9 million (based on a cost-effectiveness threshold of £20 000 per QALY). If all patients eligible had received BBs, the population NHB would have been 1305 QALYs, implying a maximum justifiable investment of £26.1 million. If all patients had received the optimal therapies they were eligible for, the population NHB would have been 1569 QALYs, implying a maximum justifiable investment of £31.4 million. In other words, failure to follow guidelines has resulted in losses in 2010 of 393 QALYs for not prescribing ACEi, 1305 QALYs for not prescribing BBs and 1569 QALYs for not following optimal therapy. Online supplementary appendix figure A2 presents the same information using a cost-effectiveness threshold of £13 000 per QALY.

Expected value of perfect implementation: population net health benefit and maximum justifiable investment if all patients who were eligible received beta blockers (BB), ACE inhibitors (ACEi) or optimal therapy (one or both of ACEi and BB) compared with what patients actually received from 2010 to 2013. QALY, quality-adjusted life-year.
Expected value of specific implementation
In 2013, the NHFA showed that, of 19 352 patients hospitalised for HF in England and Wales, 14 466 were already receiving optimal therapy on discharge. If the implementation initiatives were to result in an absolute increase in patients on optimal therapy of 5%, 968 patients would benefit. Ignoring any costs of the implementation initiative, this would lead to an increased cost to the NHS of £77 200 and would generate 340 additional QALYs, resulting in a population NHB of 336 QALYs. Expressed in monetary terms, if an activity to increase implementation achieved this level of benefit and could be implemented for a cost of less than £6 727 000, it would be considered cost-effective.
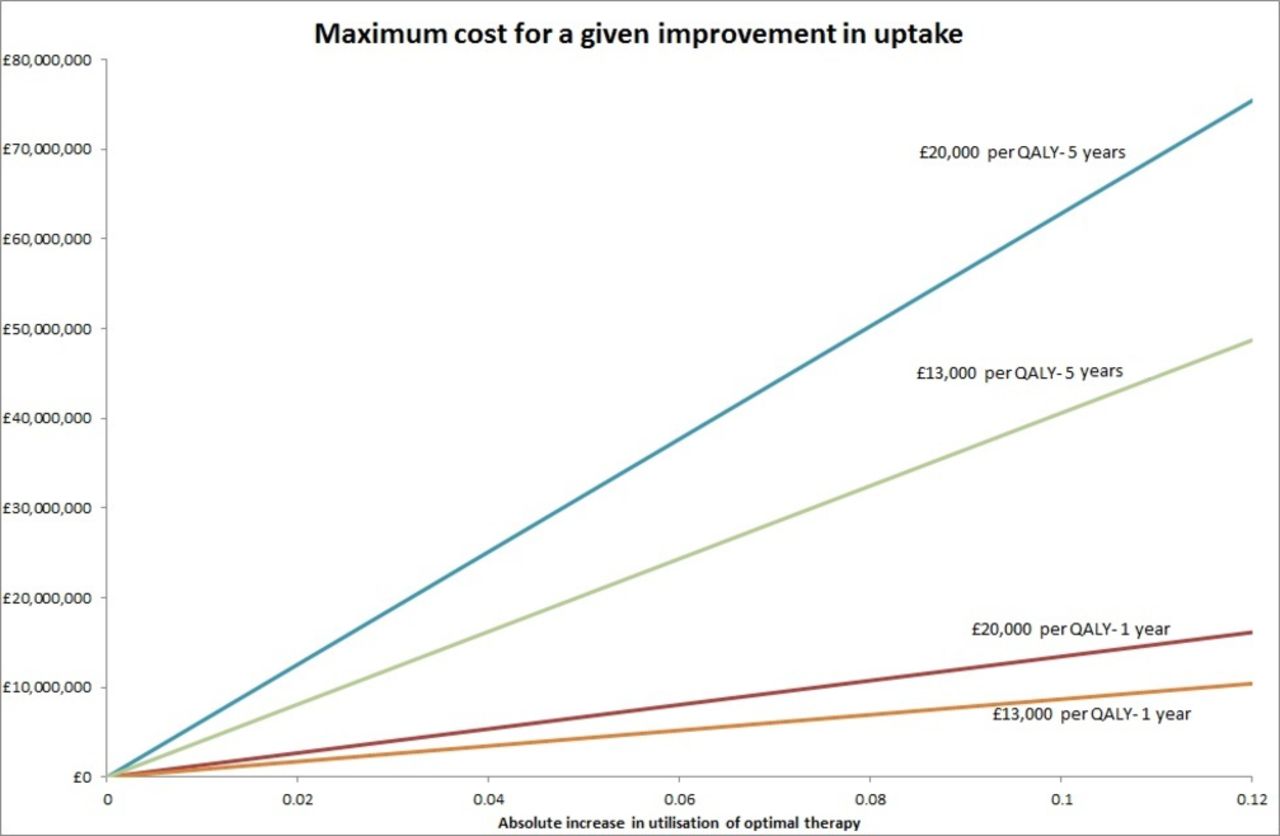
Figure 3 shows the maximum cost at which an implementation activity would be considered cost-effective for a given absolute increase in utilisation over 1 and 5 years at cost-effectiveness thresholds of £13 000 and £20 000 per QALY. Any implementation activities that could achieve an increase in utilisation (shown on the x-axis) at a cost (y-axis) below the relevant line would be considered a cost-effective use of resources. Evidence on the effectiveness and costs of implementation activities is limited and its transferability to this setting is questionable. A Cochrane review of educational outreach programmes found that the median reported absolute increase in utilisation resulting from such an intervention was 5%.25 If this could be achieved over 1 year it would be cost-effective to use such an intervention as long as it cost no more than £6.73 million (given a £20 000 per QALY cost-effectiveness threshold). If the benefit could be sustained over 5 years it would be cost-effective if the intervention cost no more than £31.44 million.
Maximum cost in England and Wales for an implementation initiative achieving a given level of increase in utilisation over 1 and 5 years. QALY, quality-adjusted life-year.
Discussion
Using data from the NHFA and evidence on the cost-effectiveness of relevant treatments, we have quantified the costs, in terms of forgone health, of the failure of the NHS to adhere to guidelines to prescribe ACEi and BBs following hospitalisation for HF from 2010 to 2013. In 2010, there were 4019 patients not receiving optimal therapy in England and Wales (both ACEi and BBs if not contraindicated), rising to 4886 patients in 2013. If all these patients had been treated optimally, the NHS would have gained 1569 QALYs in 2010 or 1698 QALYs in 2013. These represent real losses in population health. The study also considered the cost-effectiveness of potential implementation strategies if they had been used in 2013. If a study could have achieved an increase in utilisation of 5% over 1 year it would have been worth spending up to £6.73 million on it, increasing to £31.44 million if the increase could have been sustained over 5 years.
The study has a number of strengths. First, it shows the value of clinical audits in understanding historical failure in following recommended clinical practice. Second, it shows how this evidence can be combined with external evidence on the cost-effectiveness of recommended practice to estimate the health losses of this failure. By quantifying these benefits it is possible to demonstrate how much the NHS has lost and also how much it could afford to invest to rectify poor adherence while still representing a cost-effective use of NHS resources. Third, the study has appropriately taken into account that some patients are contraindicated to particular treatments, and that a failure to receive these interventions does not mean patients are receiving suboptimal therapy. Failure to account for contraindications would have resulted in an underestimate of adherence to guidelines and, therefore, an overestimate of the potential benefits of improved utilisation. Finally, the evidence on the cost-effectiveness of the treatments is taken from an economic model that has synthesised evidence from a number of different sources and made a number of assumptions. These are reported in detail elsewhere.20 This is the best evidence available on the costs and health outcomes associated with the use of these treatments in the NHS; but, as with all evidence, this is still subject to uncertainty.
There are a number of weaknesses and uncertainties relating to the study. First, there is a lack of evidence around the effectiveness and costs of different implementation initiatives. Therefore, we have not been able to estimate the cost-effectiveness of actual strategies for improving implementation and have instead focused on the effect these would need do demonstrate to be considered value for money. Second, we have only considered the benefits of improving adherence to guidelines over 1 and 5-year periods (although the benefits implied by this for the patients are calculated over 10 years). It is likely that any initiatives to improve adherence to guidelines would have benefits that persist beyond the 1-year period and, therefore, our results for 1 year may underestimate the benefits of such activities. However, the costs may also persist beyond 1 year and have a mitigating impact on this. Whether benefits would persist for 5 years is unclear. Third, related to the previous issue, the estimates of costs and QALYs assume that patients remain on treatment over 10 years; however, there is likely to be attrition over this period which may impact on these estimates. This is likely to be partly captured in the treatment effects taken from the clinical trials but may not fully reflect attrition over the 10-year period. Fourth, we have not captured the potential gains from increasing the uptake of second-line therapies including aldosterone receptor antagonists. These could also result in substantial reductions in mortality in HF. Finally, the uptake of guidance may already be improving and as such there may be less scope for gains from implementation activities in the future.
In conclusion, we have quantified the costs, in terms of forgone health, of the failure to adhere to guidelines to prescribe ACEi and BBs following hospitalisation for HF in the NHS.
References
Footnotes
Contributors SW, ES and MS conducted the analysis. NC, CAE and KR provided evidence on the uptake of the interventions. EG developed the original cost-effectiveness model of HF treatments. All authors contributed to the design of the study and writing of the paper.
Funding UK Department of Health Policy Research Programme.
Disclaimer This work was funded under the EconomicEvaluation Policy Research Unit (EEPRU) which receives funding from theDepartment of Health Policy Research Programme. EEPRU is a collaborationbetween researchers from two institutions (Centre for Health Economics,University of York and School of Health and Related Studies, Universityof Sheffield). The views expressed in this article are those of the authorsand not necessarily those of the Department of Health.
Competing interests None declared.
Provenance and peer review Commissioned; internally peer reviewed.
Data sharing statement Data used in this article is all published and publicly available.