Article Text

Abstract
Background It is unknown how the creatinine-based renal function estimations differ for dose adjustment cut-offs and risk prediction in patients with heart failure.
Method and results The renal function was similar with the Chronic Kidney Disease Epidemiology Collaboration (CKD-EPI) (median 59 mL/min/1.73 m2, IQR 42 to 77) and Modification of Diet in Renal Disease Study (MDRD) (59 mL/min/1.73 m2, IQR 43 to 75) and slightly lower with the Cockcroft-Gault (CG) equation (57 mL/min, IQR 39 to 82). Across the commonly used renal function stages, the CKD-EPI and the MDRD classified patients into the same stage in 87.2% (kappa coefficient 0.83, p<0.001); the CKD-EPI and the CG equation agreed in 52.3% (kappa coefficient 0.39, p<0.001). Hence, a differing number of patients will receive dose adjustment depending on which formula is used as cut-off. The CG equation predicted worse prognosis better (c-statistics 0.740, 95% CI 0.734 to 0.746) than CKD-EPI (0.697, 95% CI 0.690 to 0.703, p<0.001) and MDRD (0.680, 95% CI 0.734 to 0.746). Using net reclassification improvement (NRI), the CG identified 12.8% more patients at higher risk of death as compared with the CKD-EPI equation.
Patients registered in the Swedish Heart Failure Registry (n= 40 736) with standardised creatinine values between 2000 and 2012 had their renal function estimated with the CKD-EPI, the MDRD and the CG. Agreement between the formulas was compared for categories. Prediction of death was assessed with c-statistics and with NRI.
Conclusion The choice of renal function estimation formula has clinical implications and differing results at various cut-off levels. For prognosis, the CG predicts mortality better than the CKD-EPI and MDRD.
- heart failure
- register
- creatinine
- renal function estimation
- application
- prognosis
This is an Open Access article distributed in accordance with the Creative Commons Attribution Non Commercial (CC BY-NC 4.0) license, which permits others to distribute, remix, adapt, build upon this work non-commercially, and license their derivative works on different terms, provided the original work is properly cited and the use is non-commercial. See: http://creativecommons.org/licenses/by-nc/4.0/
Statistics from Altmetric.com
Key questions
What is already known about this subject?
It is well-known that the underlying renal function is best estimated with the Chronic Kidney Disease Epidemiology Collaboration (CKD-EPI) formula. This is also the formula recommended by current guidelines when renal function is to be assessed. However, for a few of the drugs used in cardiology, for example, non-vitamin K antagonist oral anticoagulants, the Cockcroft-Gault formula (CG) is still recommended.
What does this study add?
This study compares CKD-EPI, Modification of Diet in Renal Disease Study and CG for predicting prognosis and the agreement between the formula at different cut-offs.
How might this impact on clinical practice?
There are two main implications of this study. First, the prognostic information is different between the three different renal function formulas. Second, this study shows the effect of cut-off levels and the number of patients that will be affected, depending on which one of the three renal function formulas is used. The physician has to be cautious in his choice of renal function formula depending on the purpose in clinical practice.
Introduction
In the last decades, several new renal function estimation equations based on creatinine level and demographic variables have been introduced. The most commonly used are the Cockcroft-Gault formula (CG),1 the Modification of Diet in Renal Disease Study (MDRD)2,3 and the most recent Chronic Kidney Disease Epidemiology Collaboration (CKD-EPI)4 equation. The ready availability of these renal function estimations, either estimated directly in the laboratory report or easily obtained through free online renal function estimation calculators, demands an in-depth knowledge about the differences between them, and which formula to use for which purpose. The renal function estimation equations have three main uses: for diagnosing and classifying chronic kidney disease, to adjust medication doses and for predicting adverse prognosis.5-7 For the first purpose, in diagnosing renal dysfunction, Kidney Disease Improving Global Outcomes recommends the CKD-EPI equation as it gives the most accurate renal function estimate compared with the measured glomerular filtration rate (GFR)4,8. However, for guiding dose adjustments and for predicting prognosis, the choice of formula is less clear.
Renal function estimation is important when treating patients with drugs with a major renal elimination. Potentially serious adverse drug reactions could be expected if the therapeutic range is exceeded. Several of the commonly used medications in patients with heart failure require dose adjustment according to renal function,9 for example, ACE inhibitors, sotalol and the four novel oral anticoagulants (NOAC). Also other drugs, such as antidiabetics (sitagliptin), anticonvulsive (levetiracetam), antibiotics (levofloxacin) and antivirals (sofosbuvir) need a dose adjustment to renal function.
The presence of renal dysfunction in patients with heart failure signifies a worse prognosis, regardless of the underlying kidney disease. A low GFR is present in up to 50% of patients with heart failure.10,11 Whether one formula should be preferred over another in predicting outcomes, could depend on the underlying population, but most studies in heart failure populations support the use of the CG equation.12-14 Also, few of these studies used standardised creatinine.
The aim of this study was to assess how the three most commonly used renal function estimation equations applied to a creatinine measured by a standardised method affects (1) thresholds for dose adjustments in one illustrative clinical scenario of those patients with heart failure who have a concomitant atrial fibrillation and (2) prediction of 1-year mortality.
Methods
Study population
The nationwide Swedish Heart Failure Registry (SwedeHF)15,16 provided the study population and baseline clinical characteristics and medications. Inclusion criteria were clinician-judged heart failure. In 2012, 66 out of 75 hospitals in Sweden were including inpatient hospitalisations and outpatient visits, and about 100 of 1000 primary care clinics entered outpatient data into the registry. About 80 variables were recorded at discharge from hospital or at the end of an outpatient visit into a web-based case report form and database. Among these variables, creatinine, weight and height were registered. The registry is updated monthly with the vital status of patients through a merger with the Swedish population registry. The protocol, registration form and annual reports are available at www.SwedeHF.se. In the registry, individual patient consent is not required, but patients are informed of entry into national registries and allowed to opt out. The registry and this study conform with the Declaration of Helsinki and were approved by a multisite ethics committee.
Coverage in 2012 was 55%. This was defined as the number of individuals reported to the registry divided by the sum of individuals with clinical heart failure encountered in Sweden according to International Statistical Classification of Diseases (ICD)-10 code for heart failure plus those reported to the registry (to capture those few who may have been missed by ICD-10 code).
In this study, unique patients with the first recorded standardised creatinine measurement between 11 May 2000 and 3 October 2012 were included (figure 1). Each patient had only one creatinine measurement. This creatinine measurement was either obtained from the time of hospitalisation or from the outpatient clinic, depending on where the patient was treated. The creatinine value entered into the registry was the last available, at the time of enrolment into the registry. This creatinine value was either from in-hospital admissions (at the point of discharge) or outpatient visits (measured at or prior to the visit). From the date of creatinine measurement, the patients were followed for 1 year with complete data on vital status. Patients were excluded if they had missing values on the demographic variables required to estimate GFR from creatinine.

Flow chart of selection of patients from the Swedish Heart Failure Registry. CKD-EPI, Chronic Kidney Disease Epidemiology Collaboration; MDRD, Modification of Diet in Renal Disease Study.
Renal function estimation equations
Serum creatinine (µmol/L; measured by Isotope Dilution Mass Spectrometry(IDMS) standardised method) was used to estimate renal function for each patient. The formulas for estimating the glomerular filtration rate (eGFR) by the CKD-EPI4, MDRD2,3 and creatinine clearance (CrCl) with the CG1 equation are shown below. The two former equations estimate a relative renal function, which is standardised to a body surface area (BSA)17 of 1.73 m2, whereas the CG provides a measure of absolute renal function. Since height was not available for many patients, the renal function could not be transformed from a relative to absolute estimate, or vice-versa.
CKD-EPI (mL/min/1.73 m2) = 141 (Scr/κ.1)α*max(Scr/κ.1)−1.209*0.993Age *1.018 (if female)* 1.159 (if black)
MDRD (mL/min/1.73 m2) = 30849*Scr−1.154 *age−0.203 *0.742 (if female) *1.212 (if black)
CG (mL/min) = [(140 − age) *weight*1.23/ Scr] * 0.85 (if female)
Where Scr=creatinine divided by 88.4 for use with µmol/L; α=0.329 for females and -0.411 for males; κ=0.7 for females and 0.9 for males; min=minimum of Scr/κ or 1; max=maximum of Scr/κ or 1; race is not collected in SwedeHF, and everyone was assumed to be non-black; weight (kg).
Statistical analysis
Baseline characteristics are presented as median with IQR for continuous variables and as n (%) for categorical variables.
The agreement between CKD-EPI, MDRD and CG renal function categories was tested with the kappa coefficient. Modified CKD stages with seven renal function categories were used, incorporating the recommended six stages with one additional category for hyperfiltrators, eGFR >150. The Bland-Altman test18 was used to graphically illustrate the limits of agreements between the formulas, although the data were not normally distributed.
The association between renal function estimations and 1-year mortality was assessed by receiver operating curve (c-statistics) with statistical comparisons of the area under the curve.19 In the receiver operating curve, the sensitivity for 1-year mortality is plotted against the 1−specificity. Net reclassification improvement (NRI) and integrated discrimination improvement were calculated20 using 1-year mortality cut-offs (<6%, 6%–20% and >20% risk of mortality) and for NRI also as a continuous risk. The renal function estimates obtained with the CKD-EPI equation was used as the main reference to which the results obtained with the MDRD and CG equation were compared.
All analyses were performed with SPSS (V.22.0 for Mac; IBM, Armonk, New York, USA) or R V.3.1.3 (R foundation for statistical computing, Vienna, Austria).
Results
The Swedish Heart Failure Registry population
In total, there were 40 736 patients with heart failure and a standardised serum creatinine registered between 2000 and 2012 in the Swedish Heart Failure Registry (figure 1). Patients had a median age of 77 (IQR 67 to 84), were less often female (38.2%), about half had a known heart failure duration of <6 months, a quarter were diabetics (25.2%) and about two -thirds were registered while being treated as an in-patient (66.6%) (table 1). Regardless of formula used, patients with a reduced renal function were older, more often female, had more often comorbidities such as diabetes, hypertension and atrial fibrillation and were more often treated as inpatients (see online supplementary table 1).
Baseline characterisics for all patients and divided according to eGFR with the CKD-EPI equation
Agreement between renal function estimations in patients with heart failure
Compared with the CKD-EPI patients, the median of patients’ renal function estimated with the CG was lower (median 59 mL/min/1.73 m2, IQR (42 to 77) vss 57 mL/min IQR (39 to 82)), whereas the median with the MDRD equation was similar (median 59 mL/min/1.73 m2, IQR (43–75)). However, there were more patients who had a higher eGFR with the CG than with the CKD-EPI (figure 2A–C). The distribution of eGFR estimated with the MDRD equation was closest to the estimates with the CKD-EPI.

(A) Distribution of patients according to the three renal function formulas. Number of patients at different level of renal function estimated by Chronic Kidney Disease Epidemiology Collaboration (CKD-EPI), Modification of Diet in Renal Disease Study (MDRD) and Cockroft-Gault (CG). (B) Bland-Altman plots of CKD-EPI versus MDRD. (C) Bland-Altman plot of CKD-EPI versus CG.
With categorisation using a modified version of the CKD staging that included patients with hyperfiltration (eGFR >150 mL/min/1.73 m2 or CrCl >150 mL/min), there were 52.3% (kappa coefficient 0.39, p<0.001) of patients who were in the same category with both the CKD-EPI and the CG estimations. The agreement was higher (87.2%, kappa coefficient 0.83, p<0.001) between CKD-EPI and MDRD (see online supplementary Table 3). The Bland-Altman plots (figure 2A–C) illustrate the disagreements of eGFR estimations between formulas. A line of best fit (using the Loess function) has been added to the Bland-Altman graphs. In particular, the CG estimate shows lower values at the higher range when compared with the CKD-EPI equation.
Dose adjustment in patients with heart failure with atrial fibrillation—a clinical application
In the Swedish Heart Failure Registry, about half (51.4%) of all patients had atrial fibrillation. Of these, over half (56.5%) had at least a moderately reduced renal function as estimated by the CKD-EPI equation.
Dose adjustments for the novel oral anticoagulants are recommended at specific renal function estimates at <50, <30 and <15. When all three equations are used, they together identify 51.4% (n= 10 789) patients with estimate <50. However, the same unique patient will be identified by all three renal function formulas in only 63.6% (n=6756) of patients (figure 3A–D). Similarly, there are 16.1% (n=3385) of patients who have a renal function estimate <30, but only 46.9% (n=1588) of these are recognised by all three formulas. At the level of <15, no novel anticoagulant is recommended, and below this threshold there are only 1.7% (n=375) of all patients, but only 44.0% (n=165) of these are recognised by all three formulas.
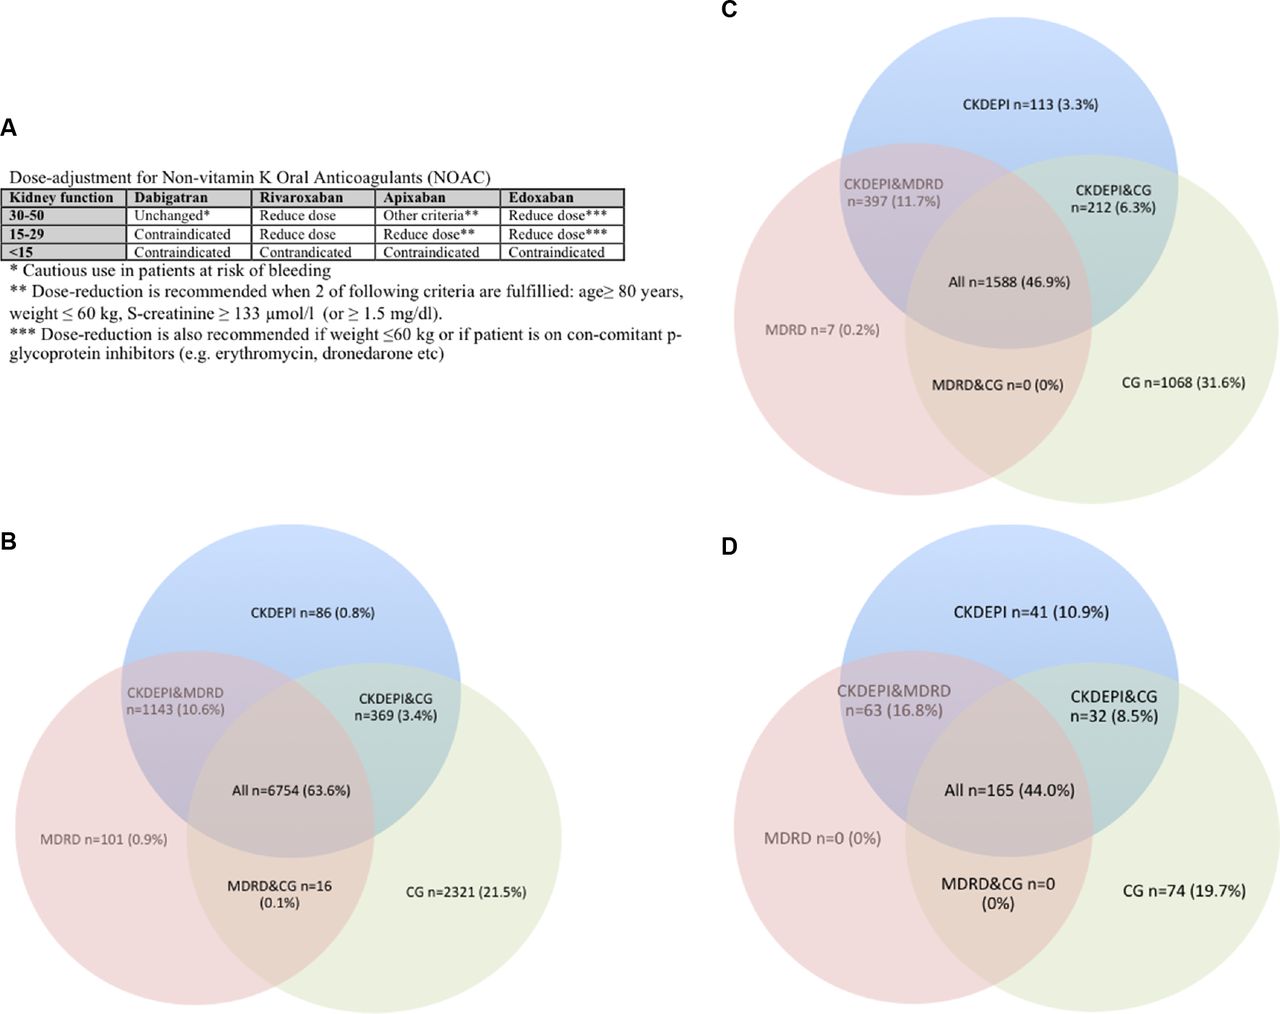
Dose adjustment at different levels of renal function according to estimates with the Chronic Kidney Disease Epidemiology Collaboration (CKD-EPI), Modification of Diet in Renal Disease Study (MDRD) and the Cockcroft-Gault (CG) formula. Overlap between formula means that all three formulas agree and suggest a dose reduction at the specific renal function cut-off. Non-overlap means that only one or two of the formulas suggest a dose reduction. (A) Table with suggested cut-off levels for the currently available non-vitamin K oral anticoagulants. (B) Cut-off eGFR < 50 mL/min/1.73 m2 by CKD-EPI or MDRD, or CrCl <50 mL/min with the CG formula among patients with known atrial fibrillation in SwedeHF. There were in total 20 975 patients with atrial fibrillation, of which 10 789 (51.4%) had an eGFR <50 mL/min/1.73 m2 or CrCl <50 mL/min obtained by any of the three formulas. Of these, 77.4% were identified by using only the CKD-EPI. CG identified 9459 (87.7%) and MDRD identified 8013 (74.3%). (C) Cut-off eGFR <30 mL/min/1.73 m2 by CKD-EPI or MDRD, or CrCl < 30 mL/min with the CG formula among patients with known atrial fibrillation in SwedeHF. Among the total 20 975 patients with atrial fibrillation, there were 3385 (16.1%) who had an eGFR <30 mL/min/1.73 m2 or CrCl <30 mL/min by any of the three formulas. Of these, 2310 (68.2%) were identified using the CKD-EPI formula alone. CG identified 2868 (79.4%) and MDRD identified 1992 (58.8%). (D) Cut-off eGFR <15 mL/min/1.73 m2 by CKD-EPI or MDRD, or CrCl <15 mL/min with the CG formula among patients with known atrial fibrillation in SwedeHF. Among the total 20 975 patients with atrial fibrillation, there were 375 (1.7%) who had an eGFR <15 mL/min/1.73 m2 or CrCl <15 mL/min by any of the three formulas. Of these, 301 (80.3%) were identified by using only the CKD-EPI. CG formula identified 248 (72.3%) of these and the MDRD and 228 (60.8%) using only the MDRD.
Renal function formula and prediction of 1-year mortality
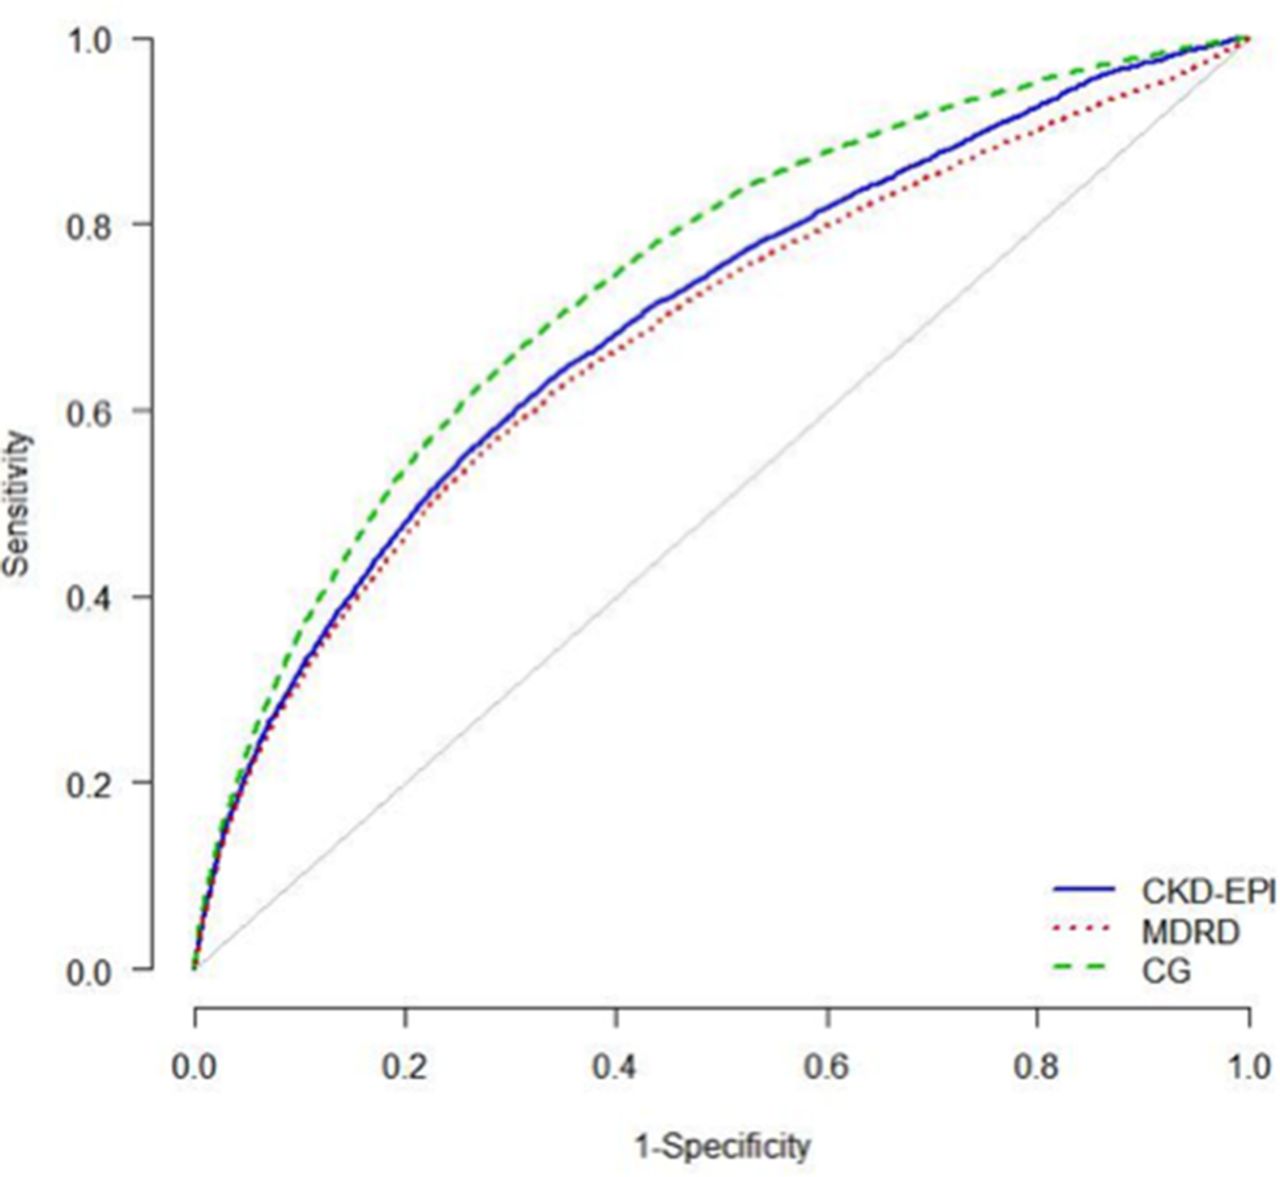
In total, 1-year mortality was 20.2% (n=8231) in the Swedish Heart Failure Registry. Mortality increase with lower estimated renal function estimated by any formula. The best prediction of 1-year mortality was obtained with the CG (c-statistics 0.740, 95% CI 0.734 to 0.745), which was significantly (p<0.001) better than the CKD-EPI (c-statistics 0.678, 95% CI 0.690 to 0.703). The CKD-EPI was significantly better than the MDRD (c-statistics 0.680, 95% CI 0.673 to 0.687) (figure 4).

Receiver operating curve analysis for Chronic Kidney Disease Epidemiology Collaboration (CKD-EPI), Modification of Diet in Renal Disease Study (MDRD) and Cockcroft-Gault (CG) renal function formula for 1-year mortality in the Swedish Heart Failure Registry.
Using net reclassification and integrated discrimination improvement there were more patients with the CG estimate who were identified in a higher risk category of dying within 1 year as compared with the CKD-EPI equation (table 2). With the CG estimation, there were 12.8% more patients with an event who were correctly classified into a higher risk category with the CG estimation ((31+1023)/8231, table 2, see online supplementary table 2). Similarly, CKD-EPI improved classification of patients with events and no-events when compared with the MDRD estimates.
Net reclassification improvement. Comparison with the CKD-EPI renal function estimation as the original model. The numbers show that CG improved classification of patients who died as compared with the CKD-EPI formula, whereas the CKD-EPI was slightly better at identifying high-risk patients than the MDRD equation (see online supplementary table 2 for reclassification table)
Discussion
In this study, comparing renal function formulas using standardised creatinine values in a large unselected heart failure cohort, we showed that (1) a moderately or severely reduced renal function affected 50% of the population and that there was often disagreement between the three renal function estimates, which can have implications for dose adjustment of medications, and (2) that the CG more accurately predicted mortality than did the CKD-EPI or the MDRD formulas.
Renal function formulas and implications for medication dose adjustment
Dose adjustment according to renal function is mandated for many categories of medications, such as for novel oral anticoagulants, dosing of glycoprotein-2b/3a inhibitors (tirofiban and eptifibatide), ACE inhibitors and antibiotics such as gentamycin. This is of particular concern in heart failure where renal insufficiency and other comorbidities are common and entails indications for and use of many medications. This may in turn result in drug interactions and toxicity both exacerbated by and exacerbating renal insufficiency. This was illustrated by the example of potential novel anticoagulants use for the over 50% of patients that had concomitant atrial fibrillation. When only one of the three renal function formulas was used to identify patients with either an eGFR <50 mL/min/1.73 m2 or CrCl <50 mL/min and compared with if all three formulas were used (figure 3A–C), then the CKD-EPI classified 77.4%, the MDRD classified 74.3% and the CG classified 87.7% of patients to the lower renal function. Hence, compared with when all three renal function formulas were used, up to 25.7% fell in different dose adjustment or contraindication categories at this threshold. All randomised clinical trials evaluating the safety and efficacy of the novel oral anticoagulants based their dose-adjustment thresholds on the CG andexcluded patientswith CrCl <30 mL/min21,22 or 25 mL/min.23 In our study, even though the number of patients that should receive a dose adjustment between formulas is comparable between the three renal function formulas, the unique individuals are not the same. This may have clinical implications, as the risk of bleeding and excess dosing may be higher depending on formula used. As the introduction of NOACs has affected only recent registrations in SwedeHF, we did not study NOAC use or clinical outcomes. However, Melloni et al24 showed in patients with an acute coronary syndrome that the group with the highest risk of bleeding were those patients who had the lowest renal function captured by both the CG and MDRD formula, followed by the CG alone.
In our study, there was considerable disagreement between formulas across the entire range of renal function categories of up to 50% of patients between the CKD-EPI or MDRD and the CG. If other renal function formulas were used, this would lead to different NOAC decisions. This is consistent with a recent study in a myocardial infarction population treated with percutaneous coronary intervention, in which the agreement between CKD-EPI and CG equations across the entire range of renal functions was similar.25 Based on our study, when patients are considered for treatment with one of the NOACs, dose adjustment based on the CG would be more conservative approach for avoiding drug exposure and potentially an increased risk of bleeding.
Predicting mortality
Prognostication using renal dysfunction has been explored in several populations and conditions, where it by using various unadjusted measures of statistics such as area under the curve analysis, net reclassification indices or adjusted Cox regression analysis that accounts for the presence of comorbidities, has been shown that the CG equation predicts outcome better than either the CKD-EPI or the MDRD equation. A clinician may be more likely to use the renal function estimates directly without adjustment for other comorbidities. With the CG, when categories of mortality were used, 12.8% of patients who died were correctly reclassified into a higher risk category, as compared with the CKD-EPI. In comparison, the CKD-EPI performed better than the MDRD formula. When it comes to prognostication for mortality at least in a heart failure population, our study is in line with previous publications.12-14,26 In this study, we only explored the association with 1-year mortality; however, other studies in patients with heart failure trial have found better NRI for several cardiovascular events, such as cardiovascular death, recurrent myocardial infarction, heart failure or stroke 13.
The reason for the differences between the eGFR formulas in mortality prediction is unclear. They may be related to the non-GFR determinants of the equations and their inter-relationships. The heart failure population may be especially sensitive to such non-GFR determinants (eg, serum creatinine may be a marker of renal function and muscle mass and indirectly severity of heart failure), especially in the setting of overhydration and underhydration. The derivation population differs.1,2,4,27 CG was created to estimate the absolute CrCl. In contrast, both the CKD-EPI and the MDRD equation estimate the GFR normed to an average BSA of 1.73 m.2 However, this estimate of the BSA of 1.73 m2 approximates an individual with a height of 170 cm and weight of 60 kg, which may not be representative of current patients. It should be noted that the CG is an individual estimate of renal function, which among the other variables included is based on each individual’s weight. In contrast, both the MDRD and the CKD-EPI estimate represent a standardised eGFR, which is normalised to a BSA of 1.73 m2. To calculate an individual eGFR with the MDRD or CKD-EPI formula, the estimate has to be multiplied by the individual’s BSA and divided by 1.73 m2. BSA can be estimated with several formulas, the most commonly used is the DuBois and DuBois formula,17 which is based on weight (kg) and height (cm) (BSA=(weight0.425xheight0.725)x0.007184). While it is not straightforward to compare an absolute and a relative renal function, nor a CrCl with a GFR, in clinical practice these equations are often used interchangeably as a measure of renal function. This would be reasonable practice among patients with a BSA of 1.73 m2, otherwise a correction for the individual’s BSA should be used. However, in this study, we chose to compare the three equations as used by the clinician.
Strengths and limitations
This study represents one of the largest and most unselected cohorts of patient with heart failure and used standardised creatinine values. However, our renal function estimate is based only on a single creatinine measurement, whereas clinicians are more likely to make a decision based on serial creatinine measurements. We did not have a golden standard, and therefore we could not assess the real underlying renal function. The golden standard is the measured GFR by using iohexol or another exogenous marker. However, others have found that the CKD-EPI is the most accurate equation when compared with one of the golden standard methods,28,29 even in patients with severe renal dysfunction. 30
Conclusion
In heart failure, the choice of renal function estimation formula had a major impact on which patients fall into categories where medication dose adjustment is mandated. The CG more conservatively identified patients for dose adjustment or drug discontinuation or avoidance. The CG equation also most accurately predicted mortality.
Acknowledgments
The authors thank all local centre study personnel for data collection and entry in the Swedish Heart Failure Registry.
References
Footnotes
Contributors KS: statistical analysis; analysis and interpretation of data; critical revision manuscript. ME: study concept and design; interpretation of data; critical revision manuscript. LB: statistical anlalysis; analysis and interpretation of data. UD: founder of and registrar for the Swedish Heart Failure Registry; study concept and design; interpretation of data; critical revision manuscript; funding; administrative support; technical and material support. UA, JJC: study concept and design; interpretation of data; critical revision manuscript. LHL: study concept and design; acquisition of data; analysis and interpretation of data; drafting of manuscript; funding; administrative support; supervision.
Competing interests KS: lecture fee AstraZeneca and Aspen; ME: Lecture fee from Amgen; UD: Research grants to author’s institution, speaker’s/consulting fees: Astra-Zeneca, Novartis, Vifor Pharma; UA and LB: reports no conflict of interest; LHL: Research grants to author’s institution, speaker’s/consulting fees: Astra-Zeneca, Novartis, Vifor Pharma, Boston Scientific; JJC: No conflit of interest.
Ethics approval Ethics Committee in Stockholm.
Provenance and peer review Not commissioned; externally peer reviewed.