Article Text

Abstract
Background We aimed to study left ventricular (LV) geometry assessed by length (LVWL), external diameter (LVEDD) and relative wall thickness (RWT) in relation to age, body size and gender in healthy individuals.
Methods 1266 individuals underwent echocardiography in the Nord-Trøndelag Health Study (HUNT3), Norway. Septum thickness (IVS), posterior wall thickness (LVPWd) and end-diastolic internal diameter (LVIDD) were measured in M-mode, and LVEDD was calculated as the sum. Myocardial wall lengths were measured in a straight line from apex to the mitral ring in apical views at end diastole and averaged to LVWL. RWT ([IVSd+LVPWd]/LVIDD) and the ratio between length and diameter (L/D) were calculated.
Results Normal age-related and gender-related values are provided. Conventional measures conform to previous studies. All measures correlated with body surface area (BSA) (r 0.29–0.60), and BSA indexed values were higher in women. Wall thickness (WT) and LVEDD, but not LVIDD, were higher with higher age. LVWL and L/D were lower with increasing age, but L/D was independent of BSA and similar in women and men (1.41 vs 1.40). RWT correlated with BSA and age (r 0.17 and 0.34).
Conclusions LV WT increases and LVWL decreases with higher age. Excluding length in LV mass calculations increasingly overestimates mass with ageing. L/D is a BSA independent measure of LV age-related geometry and may be useful as a body size independent measure in LV hypertrophy. RWT depends on body size and age, and a single cut-off value is not warranted.
- IMAGING AND DIAGNOSTICS
- CARDIAC FUNCTION
This is an Open Access article distributed in accordance with the Creative Commons Attribution Non Commercial (CC BY-NC 4.0) license, which permits others to distribute, remix, adapt, build upon this work non-commercially, and license their derivative works on different terms, provided the original work is properly cited and the use is non-commercial. See: http://creativecommons.org/licenses/by-nc/4.0/
Statistics from Altmetric.com
Key questions
What is already known about this subject?
The present study gives age-related and gender-related normal values for left ventricular (LV) wall thickness and chamber diameter, which are in accordance with previous studies, showing an increase in wall thickness, but with unchanged diameter and fractional shortening. Wall thicknesses and chamber diameter, but not fractional shortening (FS), are body size dependent.
What does this study add?
LV external end-diastolic diameter (LVEDD) is computed in this study, showing the obvious increase with age and body size, as opposed to LV internal end-diastolic diameter (LVIDD). LVWL is a new measure; normal age-related and gender-related values are provided. LVWL increases with body size but decreases with age. The ratio L/D of LV wall length (LVWL) and LVEDD is body size independent, while relative wall thickness (RWT) is not. L/D decreases with age; normal age-related and gender-related values are provided. RWT increases with age and also has a fairly high variability; normal age-related and gender-related values are provided.
How might this impact on clinical practice?
LV mass calculations should take LV length into consideration. The supposition that LV mass increases with age may be unfounded due to this. L/D is a new body size independent index of LV hypertrophy in ageing and may be useful also in hypertrophy/remodelling. Relative wall thickness, on the other hand, should be normalised for body size and age, and normal values are wider that reflected in current guidelines.
Introduction
The normal ranges for left ventricular (LV) wall thickness and internal diameter have been provided by many studies.1–3 Two-dimensional (2D) measurements are superior to M-mode measurements. However, due to the easy performance and robustness M-mode is more feasible for large studies, which may provide the largest normal materials. Wall thickness and chamber diameter have been shown to increase linearly with body surface area (BSA).2 ,3
Normal studies have found a moderate increase in wall thickness or LV mass by age, although the impact of age varied between studies.1–7 On the other hand, LV internal diameter and fractional shortening (FS) have been shown to be reasonably constant with age4–7 while LV end-diastolic volume decreases with age.2 Thus, relative wall thickness (RWT) has to increase with age as described by Ganau et al.8 As the LV volume decreases with age,2 while LV internal diameter remains unchanged, LV length must decrease with age. The length of the LV has received little attention but is included in echocardiographic calculations of LV volume and mass.
The aim of this paper was to investigate the geometric relations of LV length and diameter, as well as the associations of RWT with age and body size in the largest normal material to date.
Methods
Study individuals
The study population has been extensively described previously.9 Study individuals were recruited from the third wave of the Nord-Trøndelag Health Study (HUNT3) in Norway where 50 839 participated. Participants with a history of heart disease, hypertension or diabetes were excluded. From the remaining population, a randomised sample was drawn and invited to the echocardiography substudy. A total of 30 patients were excluded because of significant pathological findings by echocardiography, giving a remaining total study group of 1266 individuals. Population characteristics are presented in table 1.
Characteristics of the population
The mean blood pressure was 127/71 in women and 133/77 in men.
Echocardiography
One experienced physician echocardiographer (HD) conducted all examinations. The individuals were examined in the left lateral supine position with a Vivid 7 scanner (version BT06; GE Vingmed Ultrasound, Horten, Norway). The transducers were phased-array matrix transducers (M3S and M4S). The echocardiographic examinations included parasternal long-axis and short-axis views, parasternal M-mode and three standard apical views. For each view, at least three consecutive cardiac cycles were recorded during quiet respiration. The mean B-mode frame rate was 44 frames per second (FPS). Measurements of LV internal end-diastolic diameter (LVIDD) and septal and posterior end-diastolic wall diastolic thicknesses (IVSd and LVPWd), respectively, were carried out in a parasternal long-axis view and according to the ASE/EAE standard.3 RWT was calculated in end diastole as [IVSd+LVPWd]/LVIDD. LV external end-diastolic diameter (LVEDD) was calculated per patient as LVEDD=LVIDD+IVSd+LVPWd. Wall lengths (WLs) were measured in end diastole in apical two-chamber and four-chamber views and in apical long-axis view. Measurements were carried out in a straight line from apical epicardium to the mitral ring points in all three apical planes, as shown in figure 1. This underestimates the true length of the curved wall but is easier to standardise than the curved line. The mean LV wall length in end diastole (LVWL) was calculated as the mean of all six walls. The ratio between LVWL and LVEDD (L/D) was calculated for each patient. Measurements were indexed for BSA at the individual level.

Measurement of WLs. Lengths were measured in a straight line from apex to the mitral ring (cyan continuous lines). The mean WL, on the other hand, overestimates the LVL (yellow continuous line), but again the mitral ring points are better landmarks than the middle of the annulus, so the measures will be more robust. In the present study, WL is used as measurement of LVWL in the analyses. LVL, left ventricular length; LVWL, left ventricular wall length; WLs, wall lengths.
Reproducibility of LV wall lengths and mean length was tested by repeated measurements in the same recordings (inter analyser) by another analyser in a subset of 46 individuals.
Repeatability of the cross-sectional measures has been comprehensively presented by Thorstensen et al.10 Shortly, the inter analyser (same recordings) test–retest mean error was 10% for both wall thicknesses and 5% for LV diameter. Coefficients of repetition (CoR) were 1.8 mm for IVSd, 2.4 mm for LVPWd and 5.4 mm for LVIDd.
Calculations and statistics
Calculations and statistics were performed in SPSS (IBM, USA). Mean and SDs are given, as all measures were near normally distributed. Differences between genders were tested by independent samples Student's t-test, differences between age groups by one-way ANOVA, differences between walls by within individual (repeated measurement) ANOVA, both with Bonferroni post hoc comparisons. Correlations were tested by Pearson's correlation coefficient. Normalcy was tested by the Shapiro-Wilk test. Test–retest variability of WL measurements are presented by Bland-Altman statistics (CoR=2×SD of the differences between repeated measurements) and mean error (%).
Results
The overall dimensions in this population have been published previously9 and the age-related and gender-related values are given in supplementary tables of that paper, but the measures indexed for BSA have not been published. Conventional cross-sectional dimension measures and measures indexed for BSA are shown in table 2.
Conventional cross-sectional left ventricular measures and relation to body size
Wall thicknesses and LVIDD were slightly skewed as shown by the histograms (figure 2).
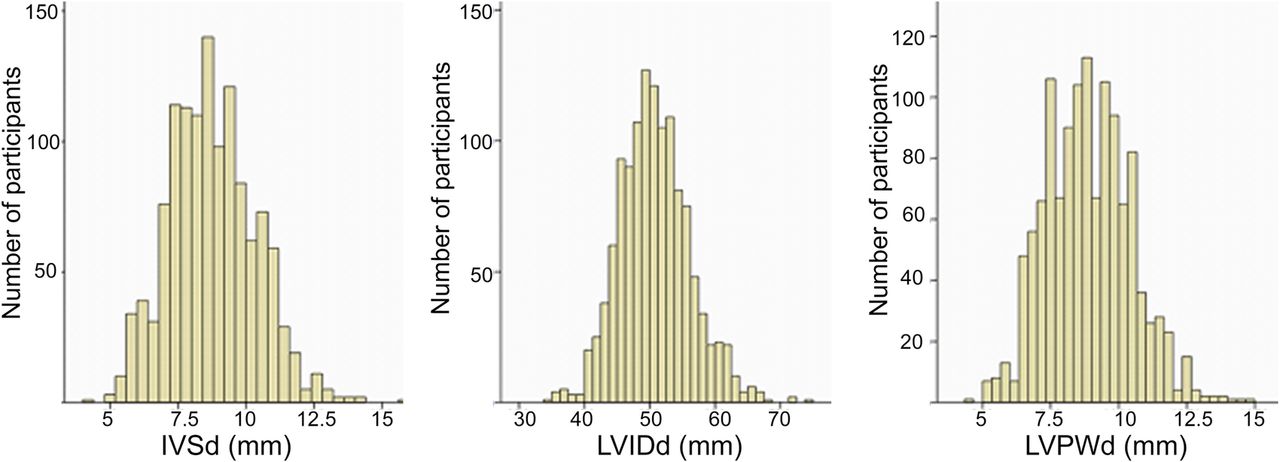
Distribution of left ventricular cross-sectional measures in the study population. IVSd, end-diastolic septum thickness; LVPWd, left ventricular end-diastolic posterior wall thickness. LVIDd, left ventricular end diastolic internal diameter.
IVSd, LVPWd and LVIDD correlate with BSA, with r-values between 0.41 and 0.48, but FS did not. All dimensions were significantly larger in men (p<0.001). Indexed wall thicknesses remained significantly higher in men (p<0.01), although gender differences were substantially smaller. However, indexed LVIDD was higher in women (p<0.01). Wall thickness was significantly higher with higher age (p<0.01, r=0.33). FS did not differ between gender, and neither LVIDD (p=0.22) nor FS (p=0.93) were influenced by age. Indexed wall thicknesses correlated with age with r 0.41 and 0.35 for indexed thickness of the septum and posterior wall, respectively.
WLs (N=1266) and variability by repeated measurements (N=46) are shown in table 3. There were differences between the walls, and the differences were significant (all p<0.001) overall. Pairwise comparisons of differences between walls were in general significant, but small, except that the septum and anteroseptum were shorter, and inferolateral wall was longer. Differences among the mean of two, four and six walls were all significant (p<0.001), but the differences were negligible. Mean errors in repeated measurements ranged from 3% for septal and lateral walls through 5% for anterior and inferior walls and was highest for the anteroseptal wall (8%). Biases between the two analysers ranged from 0.03 cm for the septal and lateral walls to 0.6 cm for the anteroseptal wall. CoR ranged from 0.8 cm for septum to 1.3 cm for the anteroseptal wall. Taking the means of two or more walls reduced the variability (CoR 0.7–0.8).
End-diastolic lengths (N=1266) and variability by repeated measurement in a subset of 46 individuals of myocardial wall measurements
LVEDD, RWT and LVWL and measures normalised for BSA are shown in table 4. As shown in figure 3, LVWL and LVEDD were near normally distributed.
Left ventricular external diameter, RWT and length

Distribution of mean left ventricular wall length (LVWL) and external diameter (LVEDD). LVWL, left ventricular wall length; LVEDD, LV external end-diastolic diameter.
LVEDD, LVWL and RWT were all significantly higher in men (all p<0.001). The L/D ratio was not significantly different between sexes (p=0.08). LVEDD, LVWL and RWT correlate with BSA (r=0.60, 0.29 and 0.18, respectively), while L/D do not. LVEDD, LVWL and RWT indexed for BSA were all higher in women than in men (p<0.001). L/D indexed for BSA was 0.08 in women and 0.07 in men, independent of age groups, but the difference was significant (p<0.001).
LVEDD correlated moderately with age (r=0.11) and LVWL and L/D decreased with age (r was −0.12 and −0.17, respectively). The differences between age groups were significant. RWT and RWT/BSA also correlated with age (r was 0.34 and 0.36, respectively).
Discussion
The main findings in this study are reduction of LV length by age and increase of the LV external dimension with age. This results in a reduced ratio between length and external diameter by higher age. Thus, the L/D ratio is an index of age-related LV remodelling. At the same time, this index is independent of body size measured by BSA. Normal age-related and gender-related values are provided. Furthermore, the findings confirm previous studies showing that RWT is age dependent; we also show it to be a BSA-dependent measure.
Relation to other studies
The conventional data are in general in accordance with previous studies, although with somewhat wider ranges due to larger SDs. This will tend to move upper and lower normal limits. Compared to the normal values given by Kou et al2 and Lang et al,3 which are derived from 2D echo, the presented values are slightly higher. This is consistent with the overestimation statistically present in M-mode recordings. The presented associations of wall thickness and cavity dimensions with BSA and gender, as well as wall thickness, but not cavity dimensions or FS with age are in line with previous studies. Thus, the material is fairly representative.
Interestingly, all measures of LV size related to BSA are higher in women. It may reflect that BSA is an imperfect measure of lean body size.
Variability and normal ranges
Normal range is generally accepted as the range from 2.5 to 97.5 centiles or mean±2 SD, comprising 95% of the normal population. The total variability will be a result of biological and measurement variability. From the study by Thorstensen, the SDs (CoR/2) of cross-sectional measurements were 0.9 mm, 1.2 mm and 2.7 mm for IVSd, LVPWd and LVIDD, respectively. Comparing with the overall SDs given in table 2, this is between 50% and 75% of the total variability in the study. The mean error of 10% in wall thickness measurements, however, corresponds to ca. 1 mm, which is the lower limit for measurement accuracy. WLs show somewhat less-relative measurement variability as shown in table 3, with mean errors of 3%, but with CoR of 0.8–1.3 cm. The main issue here is mean LV wall length, and taking mean measures somewhat reduces the variability, and the mean wall lengths had a CoR of 0.8, or about 25% of the total variability. Interestingly, means and mean error remained very similar for the mean of two, four and six walls.
The variability of single measures has consequences for composite measures. LVEDD and RWT are composites of three measures, L/D of two. In general, this means that the relative error of measurements will be thrice and twice that of single measures. On the other hand, the biological variation will be expected to show substantial covariation, thus increasing the measurement variability part of the total. Still, in the present study, they remained below the total population variability, as shown by the significant relations to BSA and age.
LV length and external diameter
LV wall length varies between walls. The main differences were a significantly longer inferolateral wall and significantly shorter septum and anteroseptum. Differences between the other walls were small. This has an important corollary that global LV wall length should be averaged from more than one measure. However, the differences between the average of two (from four chamber), four (from two and four chamber) and six (from all three views) were negligible. LV length relates to heart size and thus to body size. The decreasing LV length by age seems to be a measure of age-dependent remodelling, which previously has received little attention. Thus, the present study confirms a decrease in at least one dimension of heart size with age, which is in accordance with the recent finding of a reduction of LV cavity volume by age.2 ,3 However, LV length is still body size dependent.
LV external diameter is not a ‘new’ measure, as it is easily inferred in any previous material from LVIDD and wall thickness. As most studies find increase in wall thickness and increasing or unchanged cavity diameter by larger body size,2 ,3 the increase in LVEDD with body size is well documented, although little commented. Giving the fact that LVEDD is the composite of cavity diameter and combined wall thickness, it is not surprising that this measure shows the highest correlation with body size.
The constant ratio between LV length and external dimension for body size is, to the best of our knowledge, not described previously. In this study, the L/D ratios were the same for all body sizes, although slightly higher in women, but the gender difference was small. Thus, it seems that normalisation for body size can be substituted by the diameter–length ratio.
Thus, the normal LV geometry in normal individuals seems to be fairly constant for any given age. This ratio differs from the sphericity index as it incorporates wall thickness in the dimensions. The age-related L/D ratio may be another measure of LV hypertrophy, without the need for normalisation for body size. As a corollary, the LV mass calculated from wall thickness and cavity diameter alone will overestimate LV mass increasingly with increasing age as LV length is reduced by higher age. A formula based on M-mode measurements should incorporate LV length in a more ellipsoidal model of the LV, but arguably, echocardiographic measurement of the LV mass should be carried out in either 2D or three-dimensional (3D) mode, taking the true shape into account. However, 2D measurements have limitations related to foreshortening, while 3D echocardiography has the limitation of lower resolution in time and space (especially in the basal part of the LV), which may lead to the overestimation of LV thickness, especially basally.
Relative wall thickness
Even small misalignments of the M-mode lines will lead to an increase in the estimated chamber diameter and wall thickness. This may result in an overestimation, due to the proportion of less than perfect measures. RWT, on the other hand, will be less influenced by geometric skewness, as all measures are affected approximately to the same degree. Measurements of the RWT were equal using the true sum of the thickness of the septum and posterior wall and by the previously described method using two times the posterior wall thickness.11
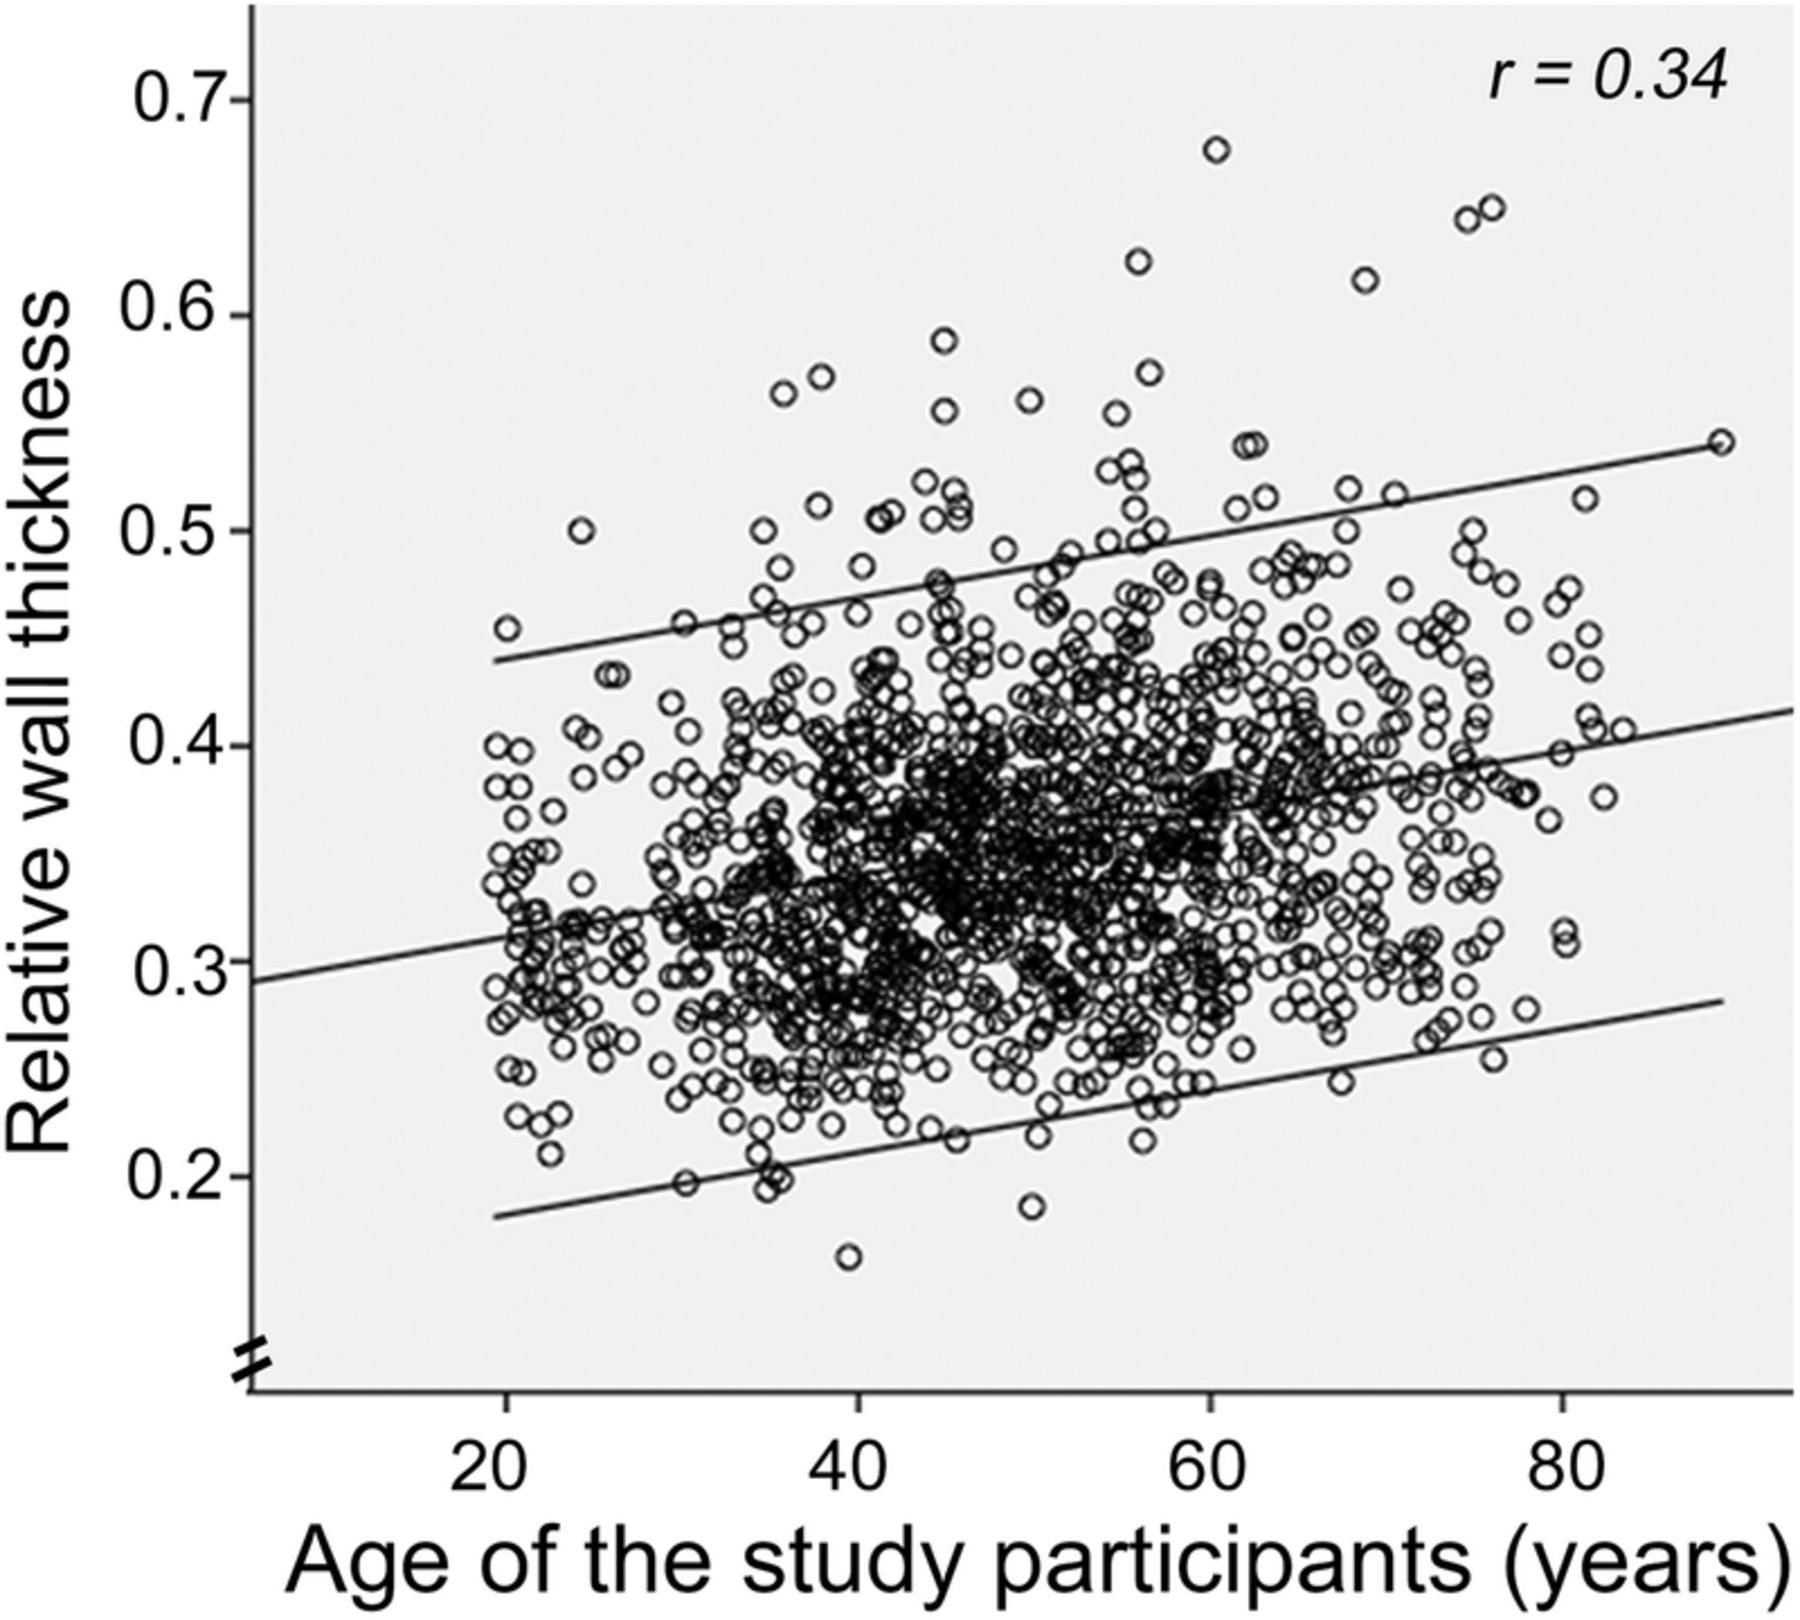
Most studies show that while wall thickness increases with age, cavity diameter is less affected. Thus, RWT has to increase with age, as shown by Ganau et al.8 As RWT is a composite measure, the SD was wider than for isolated wall and cavity measures, respectively, as discussed above. In the present study, the upper normal limit (mean+2 SD) for RWT was 0.49 for the whole population. Mean (SD) ranged from 0.33 (0.06) in the lowest age group, through 0.36 (0.06) in the middle, to 0.38 (0.07) in the upper age group. This means that age-specific upper normal limits would range from 0.45 to 0.52 (figure 4), taking the common accepted definition of normal range (mean±2 SD). As wall thickness and chamber diameter increase with BSA, RWT has been assumed to be independent of body size, but the present study shows that it is not. RWT also differs between genders, being higher in men than in women.
The association of RWT with age. RWT, relative wall thickness.
Limitations
The main limitation is that LV wall thickness and diameter are measured by M-mode. This was a practical solution as simple measurements with good repeatability were preferred due to the large number of individuals in the study. By M-mode, the lines may be slightly misaligned, thus overestimating wall thickness and chamber diameter. This will have less influence on the RWT, as the ratio will remain more or less unchanged. However, the large size of the study population and the robust measures are the strengths of the study, giving age-specific and gender-specific values for a large range of measurements. The main findings in this study are not the normal values per se, but the variations with BSA, age and gender. Length measurements from 2D echocardiography are vulnerable to foreshortening, and most studies will have a percentage of foreshortened measures, thus introducing a systematic underestimation in the basic values. Using multiple planes will reduce this.
The study population is ethnically homogeneous, and thus, variations due to ethnical differences are not covered. The study is cross sectional, thus findings are related to cohorts, and not true observations of ageing. However, the normal values reflect the framework of the present population as it is.
Conclusions and clinical implications
The main finding is that the L/D ratio is a measure of age-dependent remodelling, which gives new insight into the physiology of age-related remodelling. The L/D ratio is on the other hand independent of BSA. This is physiologically interesting, suggesting that LV geometry is fairly constant over a wide range of body sizes and across genders. Further studies could ascertain the relation of the ratio to various conditions with change in LV geometry, especially hypertrophy and remodelling, as this may provide a tool for assessing hypertrophy and remodelling, independent of BSA-normalised measures. Second, RWT has been found to be BSA dependent, despite being a measure relative to heart size. RWT is also age dependent, and age-specific and gender-specific normal values for defining concentric geometry should be warranted. Also, normal limits seem to be fairly wide, so an upper cut of limit based on mean+2 SD is higher than previously reported. Thirdly, LV mass calculations based on cross sectional measures only, over estimates LV mass with increasing age.
Acknowledgments
The HUNT Study is collaboration between HUNT Research Centre (Faculty of Medicine, Norwegian University of Science and Technology NTNU), Nord-Trøndelag County Council and The Norwegian Institute of Public Health. The authors thank the people of Nord-Trøndelag for endurance and participation.
References
Footnotes
Twitter Follow Asbjørn Støylen at @strain_rate
Contributors No persons except the authors contributed specifically.
Funding The study was fully sponsored by the Norwegian University of Science and Technology, as a PhD grant, as well as the HUNT Study providing the infrastructure for the Echo Substudy.
Competing interests None declared.
Patient consent No.
Ethics approval Ethical committee, health region mid-Norway.
Provenance and peer review Not commissioned; internally peer reviewed.
Data sharing statement All data are available in the Central HUNT database and are accessible to applicant in the HUNT study.