Article Text

Abstract
Purpose Cardiac MR (CMR) is the gold standard for left ventricular (LV) quantification. However, two-dimensional echocardiography (2DE) is the most common approach, and both three-dimensional echocardiography (3DE) and multidetector CT (MDCT) are increasingly available. The clinical significance and interchangeability of these modalities remains under-investigated. Therefore, we undertook a systemic review to evaluate the accuracy and absolute bias in LV quantification of all the commonly available non-invasive imaging modalities (2DE, CE-2DE, 3DE, MDCT) compared to cardiac MR (CMR).
Methods Studies were included that reported LV echocardiographic (2DE, CE-2DE, 3DE) and/or MDCT measurements compared to CMR. Only modern CMR (SSFP sequences) was considered. Studies involving small sample size (<10 patients) and unusual cardiac geometry (ie, congenital heart diseases) were excluded. We evaluated LV end-diastolic volume (LVEDV), end-systolic volume (LVESV) and ejection fraction (LVEF).
Results 1604 articles were initially considered: 65 studies were included (total of 4032 scans (echo, CT, MRI) performed in 2888 patients). Compared to CMR, significant biased underestimation of LV volumes with 2DE was seen (LVEDV—33.30 mL, LVESV −16.20 mL, p<0.0001). This difference was reduced but remained significant with CE-2DE (LVEDV −18.05, p<0.0001) and 3DE (LVEDV −14.41, p<0.001), while MDCT values were similar to CMR (LVEDV −1.20, p=0.43; LVESV −0.13, p=0.91). However, excellent agreement for echocardiographic LVEF evaluation (2DE LVEF 0.78–1.01%, p=0.37) was observed, especially with 3DE (LVEF 0.14%, p=0.88).
Conclusions Comparing imaging modalities to CMR as reference standard, 3DE had the highest accuracy in LVEF estimation: 2DE and 3DE-derived LV volumes were significantly underestimated. Newer generation CT showed excellent accuracy for LV volumes.
- CARDIAC FUNCTION
- IMAGING AND DIAGNOSTICS
This is an Open Access article distributed in accordance with the Creative Commons Attribution Non Commercial (CC BY-NC 4.0) license, which permits others to distribute, remix, adapt, build upon this work non-commercially, and license their derivative works on different terms, provided the original work is properly cited and the use is non-commercial. See: http://creativecommons.org/licenses/by-nc/4.0/
Statistics from Altmetric.com
Key questions
What is already known about this subject?
Anecdotally, clinicians understand that different imaging methods give different results. For example, echo is known to underestimate LV volumes compared with MRI and these differences are ameliorated with the addition of contrast or 3D echo.
What does this study add?
This study compares all imaging modalities to provide an overall picture of the differences that might be anticipated. Previous studies have evaluated and presented the bias (in percentage units) between echo and MRI, but not the actual values. A unique feature of this meta-analysis is that bias is presented in terms of millilitres (for volumes) and percentage points for ejection fraction; values that translate into clinical practice easily.
How might this impact on clinical practice?
Increasingly, multi-modality imaging is being used to determine left ventricular volumes and ejection fraction. Since these measurements are essential components of clinical management, understanding the anticipated differences that may arise due to different imaging techniques alone, and differentiating these from potential clinical changes, is a key component of clinical management.
Introduction
In the modern era of cardiovascular multimodality imaging, accurate assessment of left ventricular (LV) function is of paramount importance: LV volumes and ejection fraction (LVEF) are crucial parameters in clinical decision-making, diagnosis and outcome and are included in the main guidelines and trials.1–5 The absolute LV parameters, derived from imaging, and their variation over time, are used to guide surgical timing, device implantation and medical therapy introduction.1 ,2 Although several imaging methods are widely available for LV quantification, cardiac MR (CMR) is considered the most accurate modality and is recognised as the gold standard.6 Nevertheless, non-contrast two-dimensional echocardiography (2DE) is still the most widespread method used in clinical practice, mainly due to feasibility, wide distribution and rapid acquisition.7 However, 2DE has several intrinsic weaknesses, it is: user-dependent; affected by geometrical assumptions; often subject to foreshortening and limited by poor endocardial definition. By reducing these limitations, three-dimensional echocardiography (3DE) has been reported as a more reproducible and accurate modality for LV volume assessment.8–10 In addition, multidetector CT (MDCT) is increasingly available for its clinical applications and as a possible alternative in those patients for whom echocardiography may be unreliable or CMR contraindicated.11 In the past few years, the development of newer MDCT generation scanners has significantly lowered radiation exposure, which is gradually leading to increased adoption.12 ,13
However, the use of resource-consuming modalities requires evidence of additive impact on clinical management. It is still not clear if the quantitative advantages of these newer modalities have clinical significance. The physician should be aware of the difference between modalities when applying the common cut-off for evaluation and follow-up of patients who frequently undergo different types of tests. Moreover, the advances in multi-imaging may have recently been granted higher accuracy due to technical improvements and greater experience. These are the reasons why we sought to assess the difference in absolute values of bias in volumetric and functional LV quantification that may help clinical evaluation. Thus, the aim of our systematic review was to investigate the accuracy of LV assessment by different non-invasive imaging modalities, with a focus on the measurements adopted for patient management.
Materials and methods
The meta-analysis conforms to the Meta-analysis Of Observational Studies in Epidemiology (MOOSE) guidelines.
Search strategy
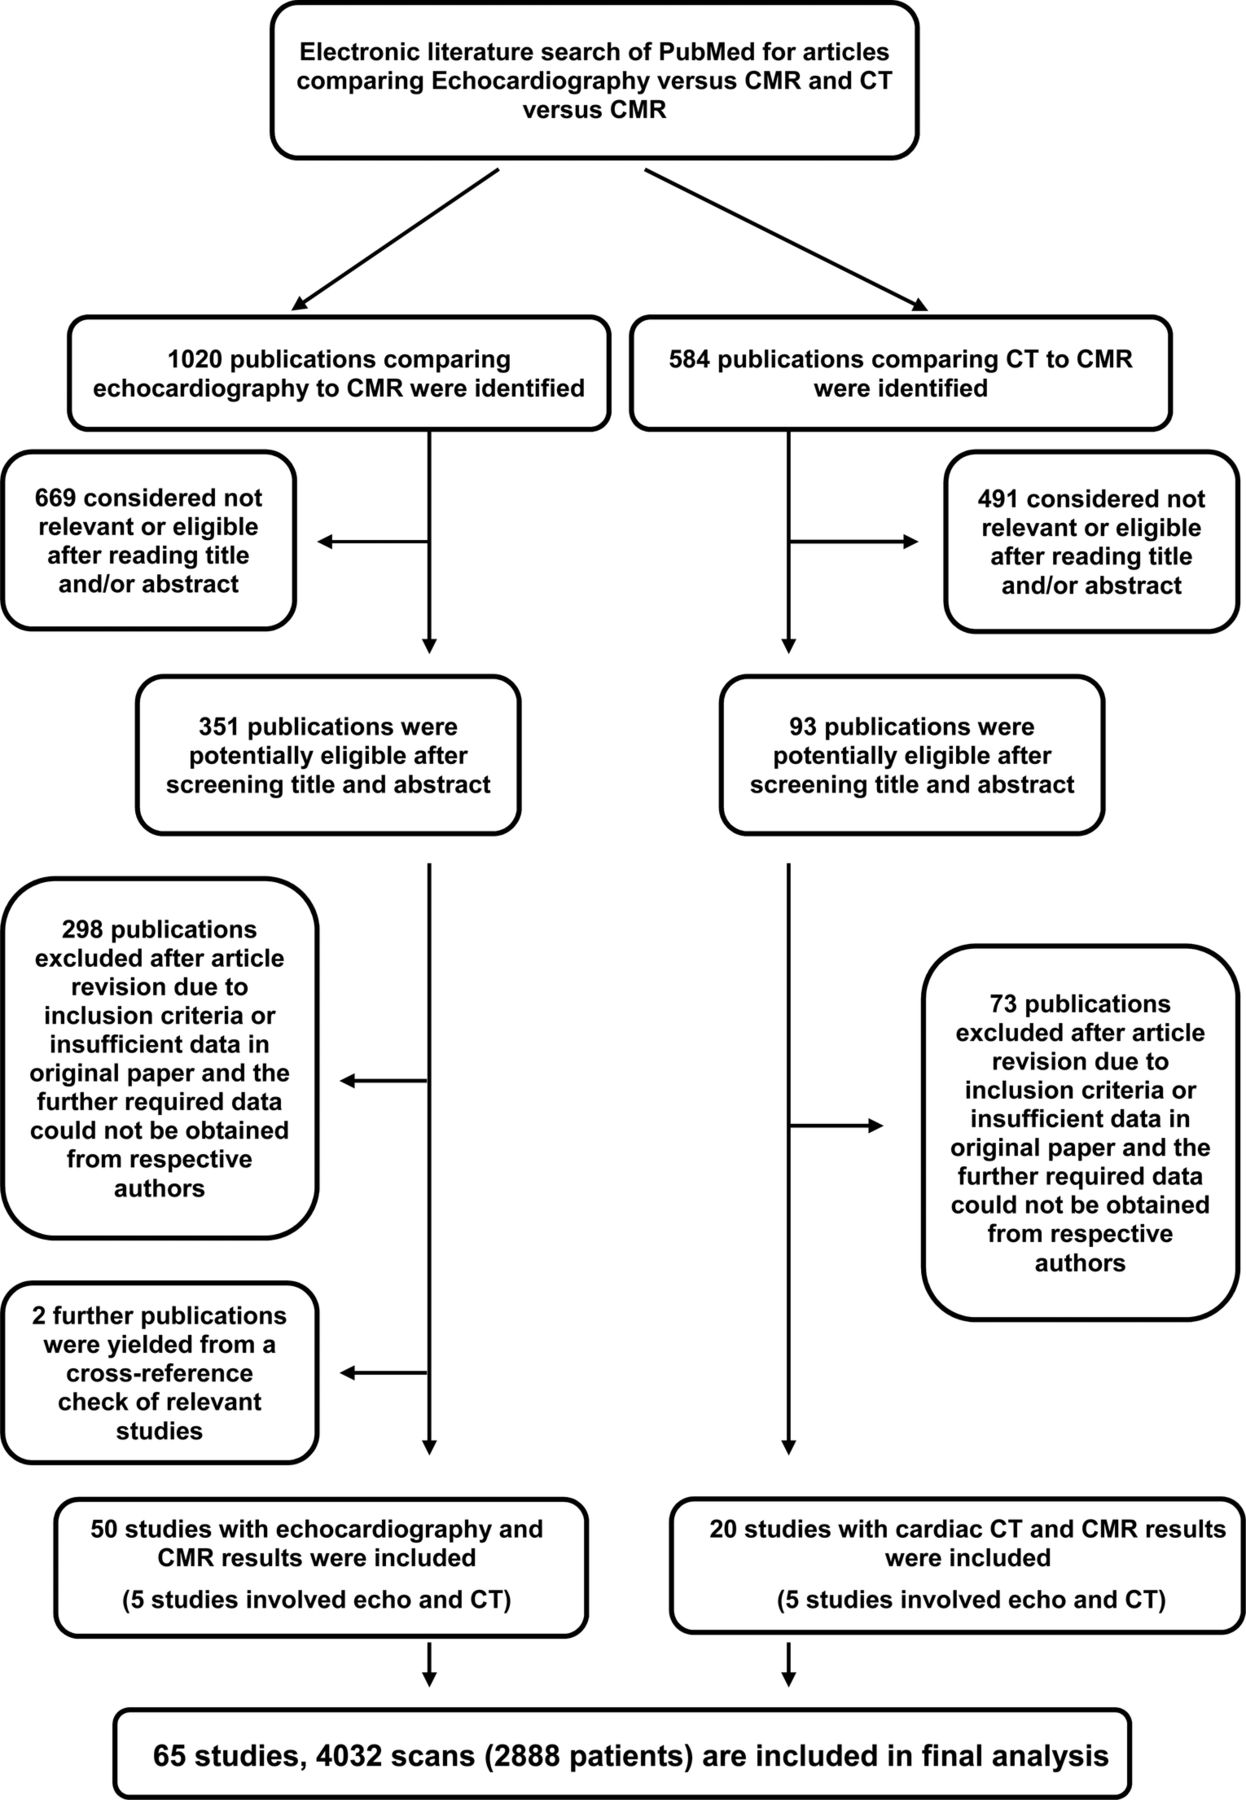
The authors developed these strategies for database searching: the MEDLINE/PubMed database was searched from January 1995 in consideration of the fact that the steady state free precession (SSFP) MRI technique that is currently used for CMR cine images acquisition was only available in the late 1990s. The literature search was limited to human adults in order to exclude studies involving children with congenital heart disease and consequent abnormal cardiac geometry. Abstracts and articles published in languages other than English were not excluded. A total of 1604 articles published over a period of 19 years were identified for initial review: 1020 and 584 in the echocardiography and CT groups, respectively.
Echocardiographic modalities versus CMR search
The search strategy was determined (by GW and JC) and the first initial literature search carried out (by SA), and an updated version (by MR) was then performed, using the following search terms: heart OR heart ventricles OR ventric*.mp AND left.mp AND cardiac volume OR heart volume OR cardiac output OR ventricular function OR ventricular dysfunction AND echocardiography OR echo.mp OR echocardiogram*.mp AND MRI OR magnetic resonance spectroscopy OR MRI.mp OR MR scan.mp OR magnetic resonance scan*.mp. The titles and abstracts of all studies identified were initially screened (by SA and MR) and reviewed (by MR and GW).
CT versus CMR search
The initial search for volumetric comparison between CT and CMR was conducted using the following search terms: heart OR cardiac OR ventricular OR ventricle OR cardiovascular AND volume OR volumes OR volumetric OR function OR dysfunction OR cardiac output AND magnetic resonance OR MRI OR MR OR MRI AND CT OR CT OR dual-source OR multi-detector OR MDCT. The titles and abstracts of all studies identified were initially screened (by SA) and reviewed (by MR and GW).
All modalities
A cross-reference process was undertaken (by SA) to search and the studies initially identified in the separate searches and the final papers were reviewed by the other authors (MR and GW). The reference lists were manually searched for potential other studies, and duplicate studies were identified and excluded.
Criteria for study selection
We excluded individual case reports, studies involving a sample size of <10 patients and those that included patients with unusual geometry (eg, congenital heart disease, Takotsubo and hypertrophic cardiomyopathy). Only newer generation CT scanners were included: at least MDCT 64 slice or dual source CT (DSCT) 2×32 slice for their improved temporal resolution and Z-axis coverage. Following these exclusions, 351 echocardiography and 93 MDCT articles were available for full review.
Data extraction
Data were extracted and recorded in an electronic database including: number of patients who received echocardiography, CT and MRI; and group mean values and SDs for LV end-diastolic volume (LVEDV), LV end-systolic volume (LVESV) and LVEF. Where the article content was insufficient, the corresponding or senior authors of the studies were contacted for further information. In the case of potential duplicate publications, clarification was sought from the authors and the largest single published data set was used for the systematic review. At the same time, additional references to either published or unpublished studies were sought.
Statistical analysis
Analyses of the collected data were performed using the Cochrane Collaboration Program Review Manager V.5.2 software. Data were collected from individual studies and weighted according to number of patients in the sample. Mean LVEDV, LVESV, LVEF and correspondent SD were used to calculate a pool estimate of the three parameters. The χ2 test was adopted to determine heterogeneity. Study variation due to heterogeneity was evaluated with inconsistency (I2). I2 values >30% were considered as significant variation. Funnel plots were used to evaluate study-level and publication bias. Absolute pooled mean values and CIs (95%) were tested with the fixed effect model of Mantel-Hanszel in case of homogeneity, and with the random effect model of DerSimonian-Laird if heterogeneity was reported. A p value <0.05 was considered significant.
Results
We identified 1020 echocardiography and 584 CT publications. Of these, 351 and 93 were considered potentially eligible. Two additional studies were found from a cross-reference check of relevant studies. After screening the full-text articles for relevance and eligibility, 50 articles comparing echocardiography to MRI and 20 studies comparing CT to MRI remained (figure 1). Owing to the overlap of five studies that analysed both echocardiography and CT versus MRI, the total number of studies included was 65 (table 1, reference list is available as online supplementary data). All the articles or abstracts were published in peer-review journals.
Supplemental material
Included studies

Study selection for inclusion.
2D Echocardiography and CMR comparison
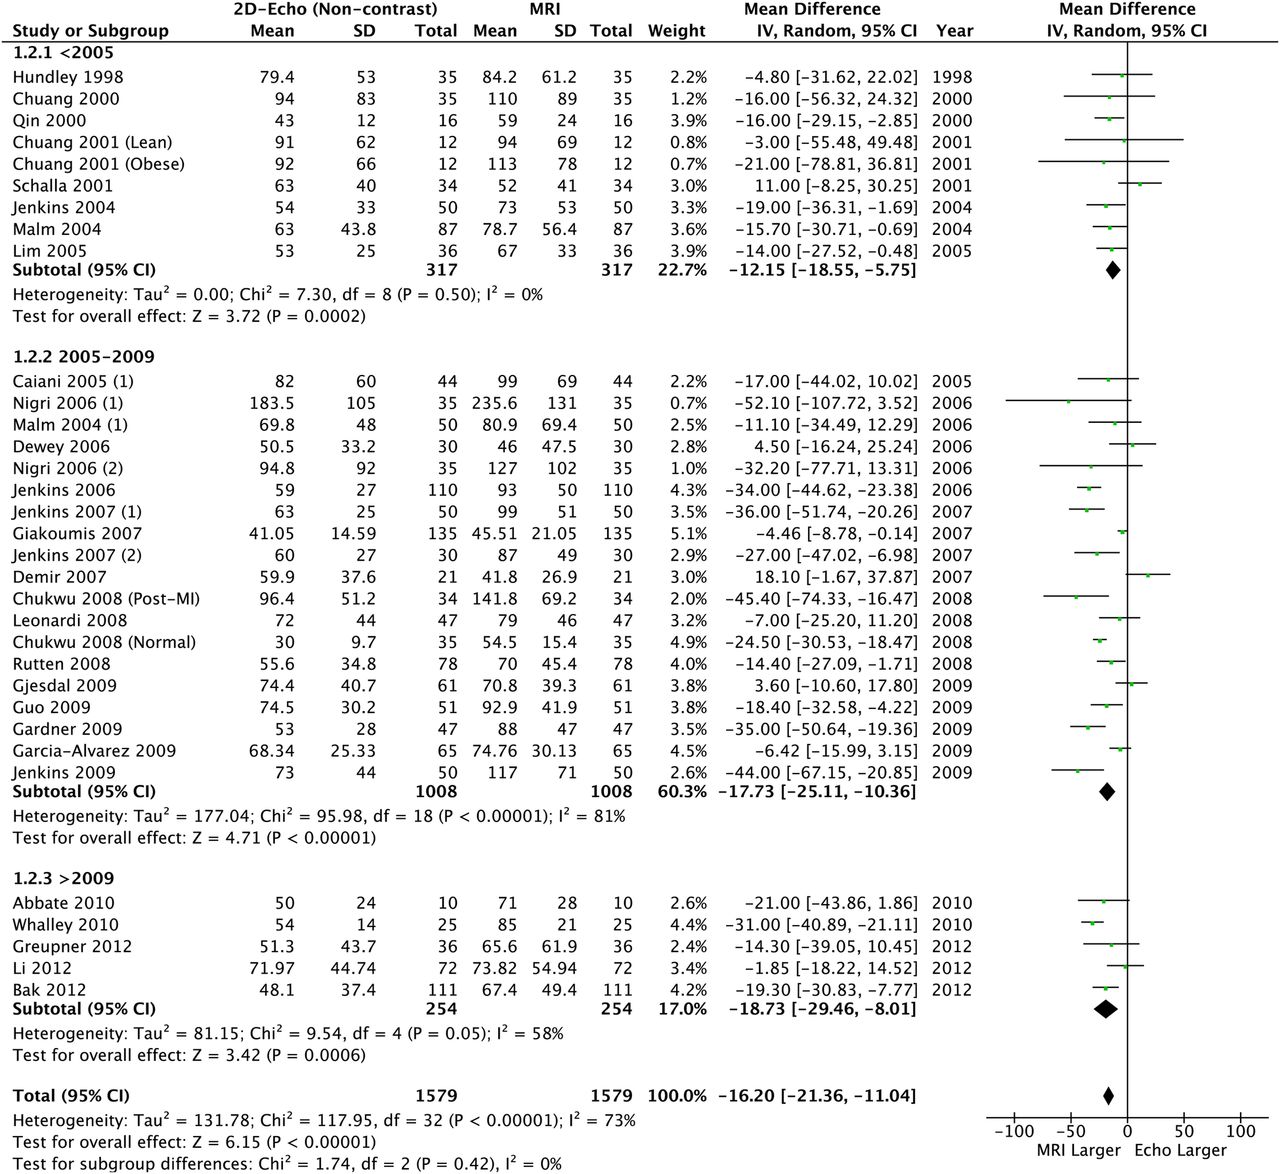
Overall, 2888 patients (4032 scans) were included. Compared to CMR, there were significant differences in LVEDV and LVESV, with observed high levels of heterogeneity (87%) and bias from funnel plots (table 2, figures 2 and 3). Although a significant bias was not detected for LVEF (mean difference: −0.78% (95% CI −2.24% to −0.68)), similar high levels of heterogeneity (72%) and bias were observed (table 2 and figure 4). This heterogeneity renders the calculated mean difference unreliable, but it does highlight a clinically relevant underestimation of the volumes and supports the overall findings that these methods are not interchangeable.
Summary of meta-regression of differences observed by each method

Left ventricular end-diastolic volume: 2D echo versus CMR. CMR, cardiac MR; 2D, two-dimensional.

Left ventricular end-systolic volume: 2D echo versus CMR. CMR, cardiac MR; 2D, two-dimensional

Left ventricular ejection fraction: 2D echo versus CMR. CMR, cardiac MR; 2D, two-dimensional
2D echocardiography with contrast and CMR comparison
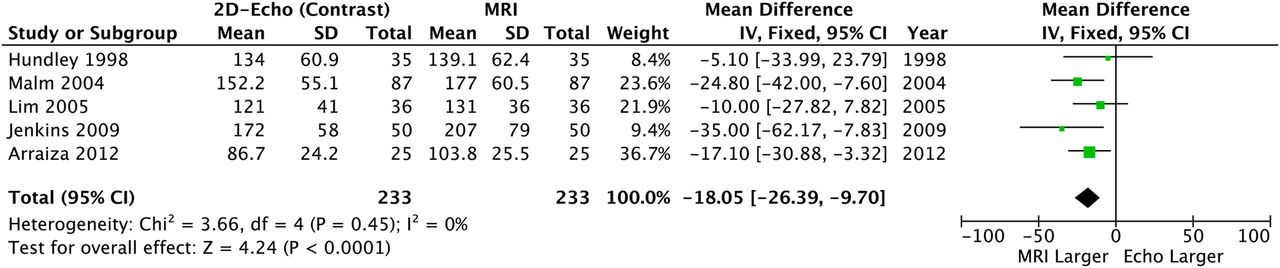
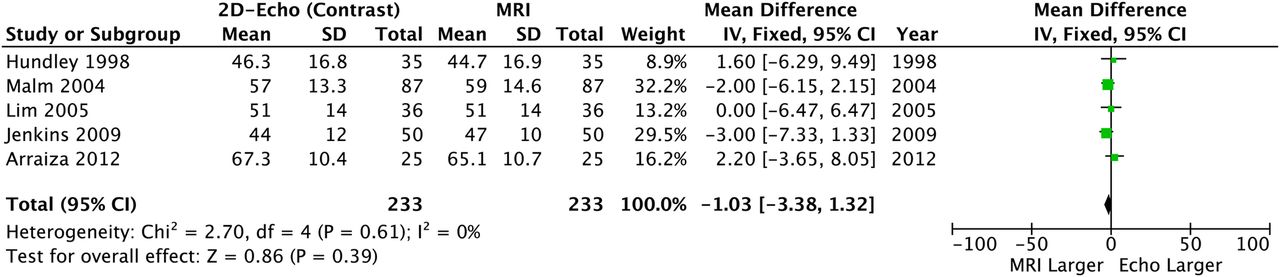
When contrast was added to 2DE, significant differences in LVEDV and LVESV remained: CE-2DE underestimated both volume measurements (table 2, figures 5 and 6) but LVEF was similar compared to CMR and neither heterogeneity nor bias was seen (table 2 and figure 7).

Left ventricular end-diastolic volume: 2D echo with contrast versus CMR. CMR, cardiac MR; 2D, two-dimensional.

Left ventricular end-systolic volume: 2D echo with contrast versus CMR. CMR, cardiac MR; 2D, two-dimensional.

Left ventricular ejection fraction: 2D echo with contrast versus CMR. CMR, cardiac MR; 2D, two-dimensional.
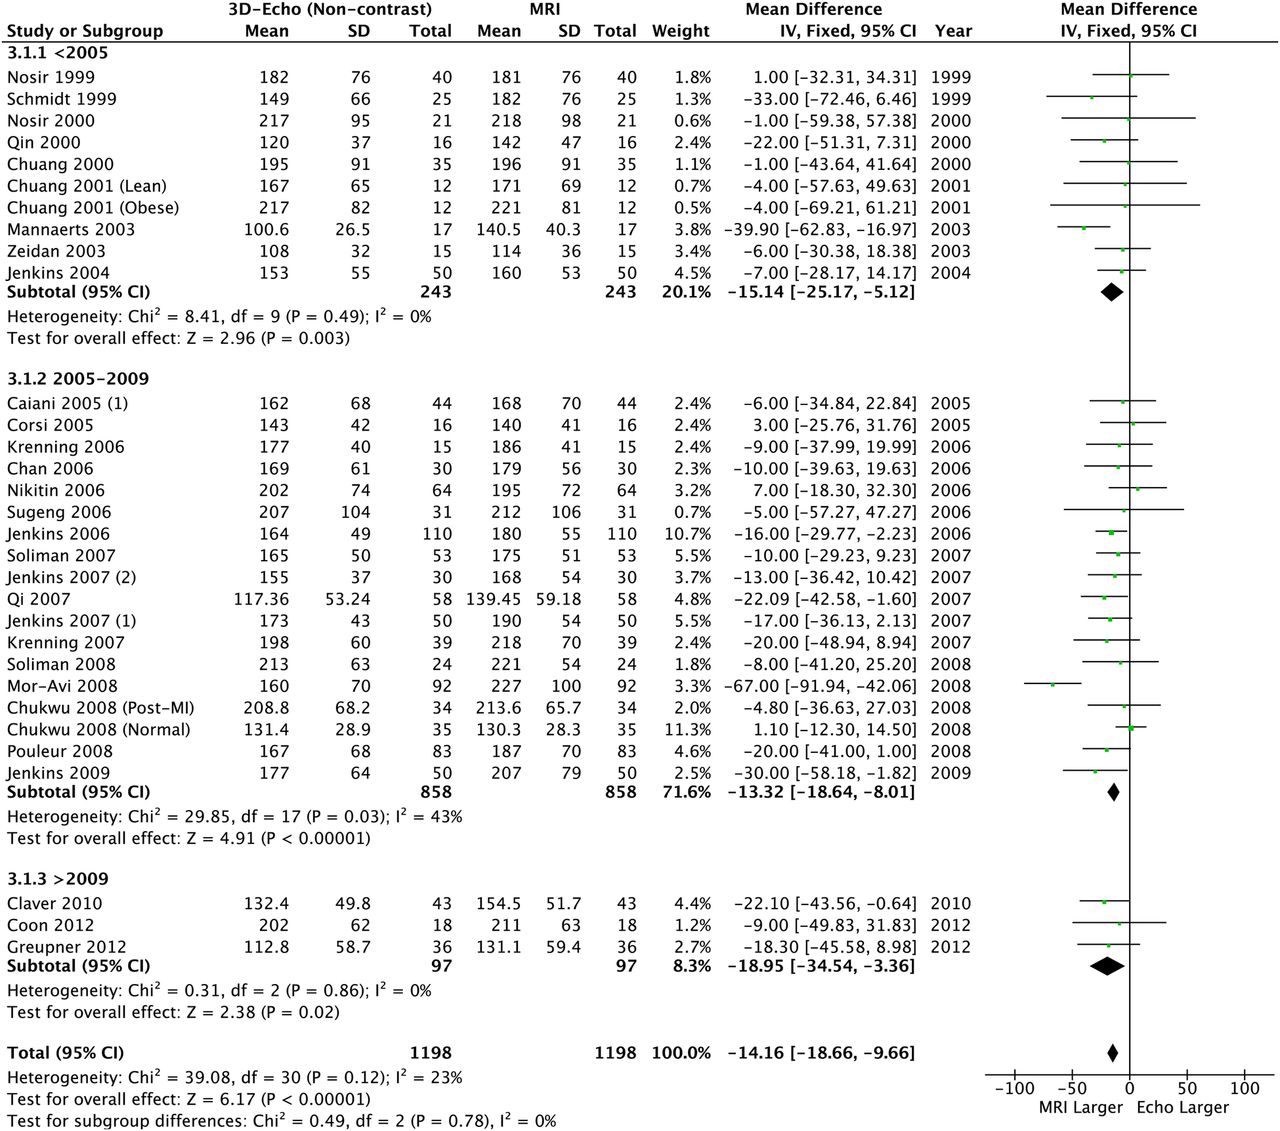
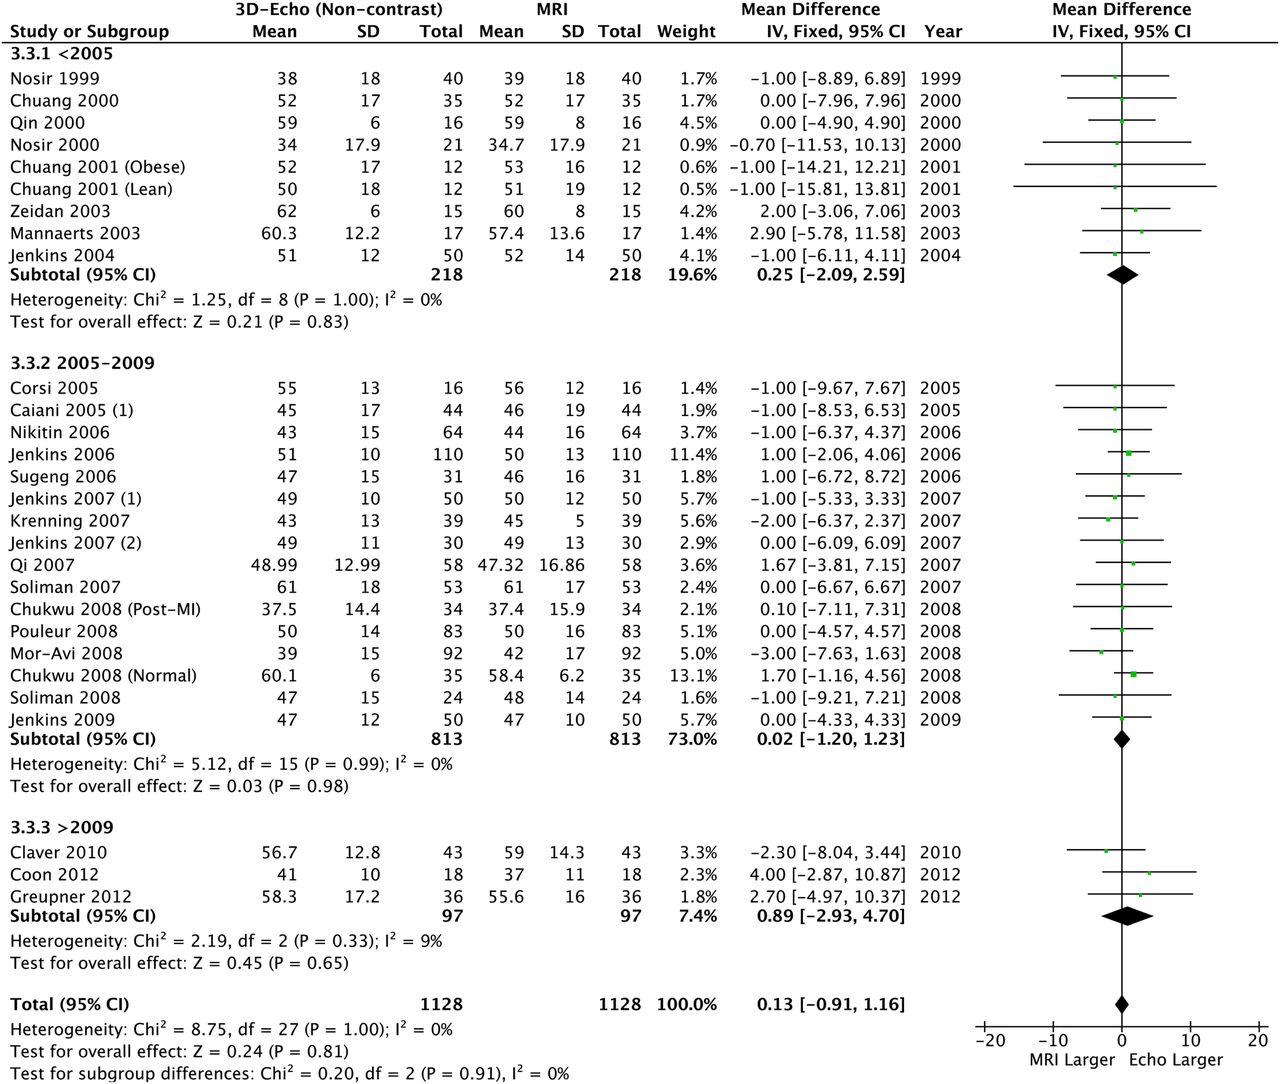
3D echocardiography and CMR comparison
Using 3DE further reduced the absolute size of the bias, but significant underestimation remained for LVEDV and LVESV (table 2, figures 8 and 9). However LVEF was similar and neither heterogeneity nor bias was seen (table 2 and figure 10).

Left ventricular end-diastolic volume: 3D echo versus CMR. CMR, cardiac MR; 3D, three-dimensional.

Left ventricular end-systolic volume: 3D echo versus CMR. CMR, cardiac MR; 3D, three-dimensional.

Left ventricular ejection fraction: 3D echo versus CMR. CMR, cardiac MR; 3D, three-dimensional.
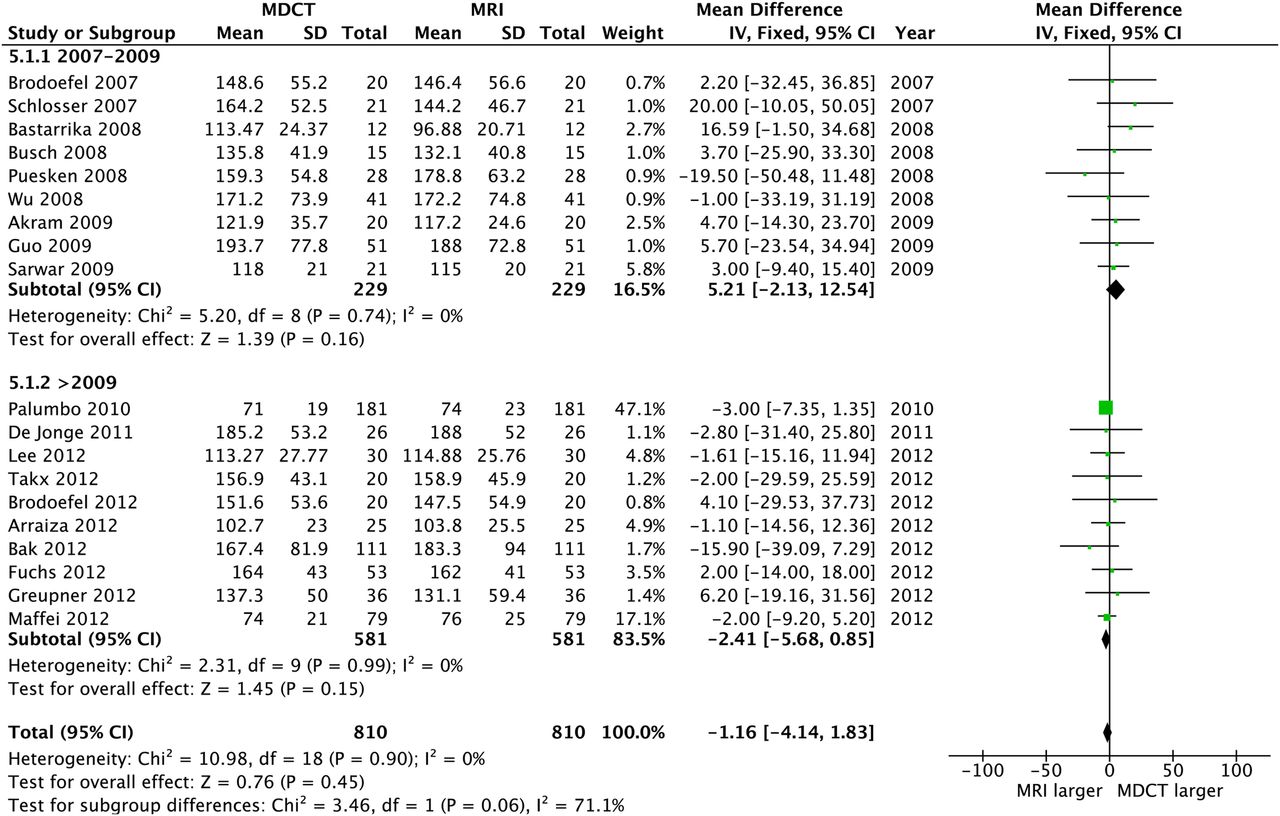
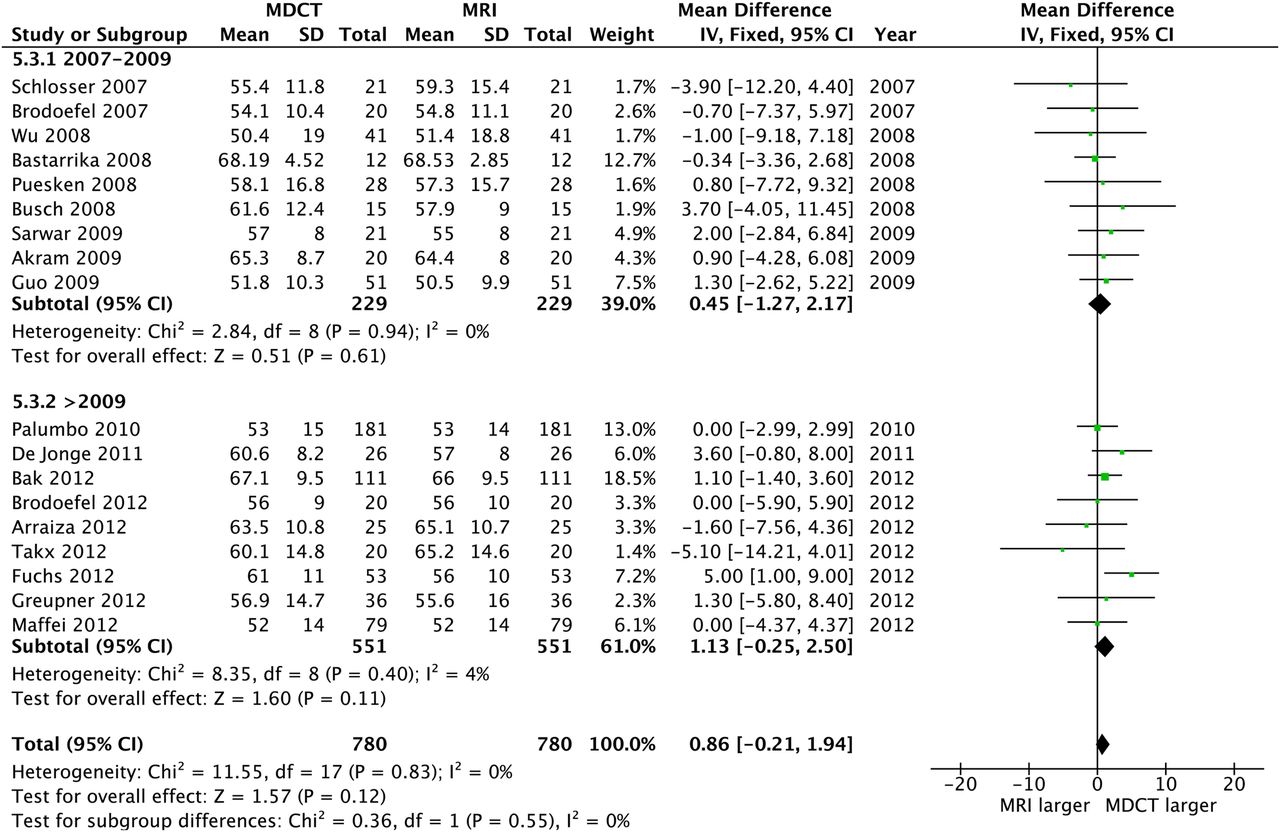
CT and CMR comparison
Of the 20 CT studies that were included, 12 adopted a 64-slice MDCT, while the remaining eight employed a dual source technology (2×32 slices). No differences were observed between CT and CMR for any volume or LVEF measure, and heterogeneity was uniformly absent; also, the funnel plots revealed no bias (table 2 and figures 11–13).

Left ventricular end-diastolic volume: CT versus CMR. CMR, cardiac MR.

Left ventricular end-systolic volume: CT versus CMR. CMR, cardiac MR.

Left ventricular ejection fraction: CT versus CMR. CMR, cardiac MR.
When considered over time, no significant differences in the summary statistics were seen for any measure or modality with widely overlapping CIs, suggesting no obvious impact of improved technology over this time period.
Discussion
To the best of our knowledge, this is the first meta-analysis to evaluate all of the most commonly available non-invasive modalities for LV volume and LVEF quantification over nearly two decades of literature search. Our data show that 3DE provides the highest accuracy for LVEF quantification, while newer generation CT is the most precise method for assessment of LV volumes, when compared to CMR. Moreover, 2DE (non-contrast and contrast-enhanced) significantly underestimates LV volumes.
Despite the clinical importance of LV volumetric and functional quantification, no consensus remains on the best modality for assessment. Although it is acknowledged that bias may occur, the absolute differences in LV volumes and LVEF by various imaging methods are largely unquantifiable. It is important to determine, and quantify, if there is a significant absolute bias between modalities especially for follow-up that nowadays is increasingly performed with different types of tests. This may impact considerably on clinical management of various cardiac conditions, particularly in patients with borderline LV volumes and LVEF values. A better comprehension of their parameter variability between tests may enhance therapeutic decisions. Small studies evaluating echocardiography and CT in comparison to CMR demonstrated controversial results. Greupner et al14 reported the CT superiority in assessing all three global LV parameters compared to 2DE, 3DE and ventriculography when CMR values are used as reference standard. Interestingly, 3DE did not perform better than 2DE, in contrast with previous reports and prior meta-analyses.8 ,9 ,15 In our study, despite the underestimation of LV volume by 3DE, almost no difference was seen for LVEF when compared to CMR. The underestimation of volumes observed is concordant with the results of two previous meta-analyses8 ,9 that evaluated the sources of bias and limits of agreement affecting 3DE. When LV function was considered, there was no difference in bias between 2DE and 3DE, with only a modest difference in variance.8 In contrast to these previous studies, we decided to focus on the absolute difference between LV parameters and to exclude the cardiac conditions that markedly alter geometric shape. In fact, the inclusion of major anatomical ventricular alterations (eg, congenital and primary cardiomyopathies) may have influenced prior results, especially when 2DE geometrically based assessments were compared. These former systematic reviews included congenital heart abnormalities in which the global ventricular structure was markedly changed. This may have resulted in an unfair comparison for 2DE versus 3D modalities considering that congenital diseases represent a significantly reduced proportion of most common everyday clinical practice. Our data confirm that, even excluding limited cardiac diseases in which echocardiography has known limitations, 2DE and 3DE significantly underestimate LV volumes. Although 3DE relies on fewer geometrical assumptions than 2DE and approximately halves the absolute bias of underestimation, it still performs worse than CT, compared with CMR. This is probably due to the reduced spatial resolution and consequent lack of precision in distinguishing myocardial trabeculations and endocardial borders.9 ,16 ,17
The highest spatial resolution of CT and its similar 3D reconstruction method to CMR may explain the perfect agreement observed in quantification of volumes. Our results are complementary to two previous systemic reviews comparing CT and CMR, one on older and one on newer generation scanners.18 ,19 These have shown a good agreement for LVEF, but no analysis of LV volumes bias compared to CMR was performed. However, our data suggest that functional evaluation is not as good as echocardiography when compared to CMR. Although CT has the disadvantages of risk radiation and iodinated contrast exposure, it remains a useful method for second-level cardiac anatomical evaluation in those patients with contraindications to MRI (eg, implanted devices, claustrophobia) and its use has more than doubled over the past 10 years.12 Possible explanations of the reduced performance in functional assessment should consider the substantial differences in LV assessment between the various imaging modalities. First of all, with the exception of the newest whole-heart 320-slice scanner, CT acquires the cardiac volume in more heartbeats in contrast to echocardiography, by which LV evaluation is performed on a single heart beat acquisition. Furthermore, β-blockers commonly administered prior to cardiovascular and coronary CT scans to lower heart rate and limit cardiac motion-related artefacts, may directly affect the evaluation of LV function. Finally, most studies evaluating 2DE and 3DE have commonly excluded patients with poor echocardiographic views, leading to an overestimation of echocardiographic accuracy compared to routine practice. When good images are available, 3DE improves the accuracy and reproducibility of LV volume and EF measurements overall.20
In addition to these considerations, although CMR is the gold standard for LV quantification, there still are significant limitations in LV quantification when comparing imaging techniques by setting CMR parameters as true values for bias estimation, such as basal slice selection and multiple breath-holds acquisition. Moreover, most clinical studies, and indeed clinical practice, are based on echocardiographic parameters, and 2DE cut-offs for EF are the most often reported and relied on.21–23 Although CMR parameters are compared to well-established normality databases,24 ,25 the data on patient management and outcome based on CMR are still limited. However, up to date CMR remains the highest reproducible LV quantification modality.26 Technical advances are allowing better semiautomatic acquisition and analysis for higher operator independency,27 ,28 and direct prognostic evidence with CMR is growing.29 ,30
Limitations
The majority of studies included a small number of patients with different baseline characteristics. Most of the studies analysed were single-centre retrospective trials, and, therefore, issues of potential referral bias and inconsistent data collection may be present. As in any meta-analysis, the validity of our results is dependent on the validity of the studies included but this variability reflects clinical practice. There are multiple risks of bias in systematic reviews; however, our funnel plot analyses mostly demonstrated no significant publication bias for the results without significant heterogeneity, except for 2DE. A few studies had to be excluded due to different numbers of patients undergoing different modalities. Technical issues in completing the scans mainly caused this inconsistency. We excluded these studies to keep the balance between the modality groups. Some studies did not report LVEF but only presented volumes. We chose to include these since the analyses for LV volumes and LVEF were performed separately and consequently we considered them as independent parameters. We did restrict inclusion of the CT studies to recent technology only, and did not do this for the echo studies. The advances in CT imaging over this time period have been substantial, and more so than echo. Nevertheless, in the analyses, we have subgrouped the studies by year of publication to partially account for this, and no chronological impact is apparent.
Conclusion
Comparing commonly available non-invasive imaging modalities to CMR as a reference standard, 3DE holds the highest accuracy in LVEF estimation, although 2DE and 3DE-derived LV volumes are significantly underestimated. Newer generation CT shows excellent accuracy for LV volumes quantification. These results may help clinicians to better understand the degree of absolute bias between different cardiac imaging modalities and may have potential implications for patient follow-up and management.
Acknowledgments
The authors thank the following people for providing additional data or confirming the data we had extracted from their studies: Dr Antonio Abbate, Dr Michael Chuang, Dr Ana Garcia-Alvarez, Dr Ola Gjessdal, Dr Sigrun Halvorsen, Dr Carly Jenkins, Dr Jens Kastrup, Dr Bernhard Metzler, Dr Masaaki Takeuchi, Dr Victor Mor-Avi, Dr Jürgan Scharhag, Dr Marta Sitges, Dr Osama Soliman, Dr Stefan Steorck and Dr Cezary Szmigielski.
References
Footnotes
MR and SA were equal contributors to this manuscript and are co-first authors.
This author, Dr Whalley, takes responsibility for all aspects of the reliability and freedom from bias of the data presented and their discussed interpretation.
Twitter Follow Gillian Whalley at @GWhalleyPhD
Contributors MR and SA conducted the searches. All four authors developed the search strategy. MR drafted the first manuscript, and SA, GAW and JPC offered feedback and edited the final version. All the authors contributed to the design and conduct of the study and have approved this final version.
Funding This study was funded by Awhina Knowledge and Innovation Centre, Waitemata District Health Board (summer studentship).
Competing interests None declared.
Provenance and peer review Not commissioned; externally peer reviewed.
Data sharing statement Our data are limited to the group level data for the individual studies we used. Some of these were easily, and some not so easily, accessible. We would be happy to share our data.