Article Text

Abstract
Objective To assess the change in peak oxygen consumption (pVO2) and determine its outcome predictors after aortic valve replacement (AVR) for aortic stenosis (AS).
Methods Patients with AS and preserved left ventricular ejection fraction who were referred for single AVR had cardiopulmonary exercise testing prior to and 9 months post-AVR. Predictors of outcome for pVO2 were determined by multivariate linear and logistic regression analyses. A significant change in pVO2 was defined as a relative change that was more than twice the coefficient of repeatability by test–retest (>10%).
Results The pre-AVR characteristics of the 37 study patients included the following: median age (range) 72 (46–83) years, aortic valve area index (AVAI) 0.41 (SD 0.11) cm2/m2, mean gradient (MG) 49.1 (SD 15.3) mm Hg and New York Heart Association (NYHA)≥II 27 (73%). Pre-AVR and post-AVR mean pVO2 was 18.5 and 18.4 mL/kg/m2 (87% of the predicted), respectively, but the change from pre-AVR was heterogeneous. The relative change in pVO2 was positively associated with the preoperative MG (β=0.50, p=0.001) and negatively associated with brain natriuretic peptide > upper level of normal according to age and gender (β=−0.40, p=0.009). A relative increase in pVO2 exceeding 10% was found in 9 (24%), predicted by lower pre-AVR AVAI (OR 0.18; 95% CI 0.04 to 0.82, p=0.027) and lower peak O2 pulse (OR 0.94; 95% CI 0.88 to 0.99, p=0.045). Decreases in pVO2 exceeding 10% were found in 11 (30%) and predicted by lower MG (OR 0.93; 95% CI 0.86 to 0.99, p=0.033).
Conclusions Change in pVO2 was heterogeneous. Predictors of favourable and unfavourable outcomes for pVO2 were identified.
This is an Open Access article distributed in accordance with the Creative Commons Attribution Non Commercial (CC BY-NC 4.0) license, which permits others to distribute, remix, adapt, build upon this work non-commercially, and license their derivative works on different terms, provided the original work is properly cited and the use is non-commercial. See: http://creativecommons.org/licenses/by-nc/4.0/
Statistics from Altmetric.com
Key questions
What is already known about this subject?
Improvement after aortic valve implantation is often assessed by improvement in symptoms and New York Heart Association (NYHA) class. These measures are subjective and prone to be affected by placebo effects and bias from double-unblinded assessments by the patient and the physician. Few studies have focused on the improvement in objective measures of functional capacity and their predictors. Peak oxygen consumption is a reproducible objective measure of functional capacity that reflects cardiac output at peak exercise and a predictor of prognosis in most cardiac diseases.
What does this study add?
The change in peak oxygen consumption after aortic valve replacement for aortic stenosis is heterogeneous. A favourable outcome may be predicted by more severe aortic stenosis and lower peak oxygen pulse (which reflects stroke volume) at peak exercise and by non-elevated brain natriuretic peptide level according to age and gender. A less favourable outcome may be predicted by less severe aortic stenosis and brain natriuretic peptide above the upper level of normal.
How might this impact on clinical practice?
Not all patients with aortic stenosis who are judged symptomatic experience an improvement in objective functional capacity after valve replacement. Knowledge of the predictors of favourable or unfavourable outcomes may be of importance for treatment decisions and for the information of patients and relatives.
We suggest that objective measures like peak oxygen consumption are used to assess improvement with aortic valve replacement.
Introduction
Whether a patient is symptomatic with haemodynamic compromise from aortic stenosis and will improve after aortic valve replacement (AVR) is often ambiguous, and the procedure has costs in terms of health complications as well as price. Knowledge and information about the status and improvement that may be expected after AVR are important for patients and physicians. To assess the effect of AVR, improvement in New York Heart Association (NYHA) class and symptoms or in quality of life scores are often used. However, these measures are subjective and prone to bias from the placebo effect of a major intervention and from double-unblinded assessment. As an objective measure, the 6 min walking test (6MWT) is often used. However, this test is valuable only for patients with more severe functional limitations, whereas currently, AVR is recommended at the incipience of symptoms.1–3 The peak oxygen consumption (pVO2) obtained by cardiopulmonary exercise testing (CPX) is very reproducible and an objective measure of functional and cardiac capacity.4 ,5 It is closely related to prognosis in a variety of cardiac diseases6 and to the pathophysiology of aortic stenosis, having a linear association between oxygen consumption (VO2) and cardiac output.7 ,8 Since VO2 is equal to the cardiac output multiplied by the arteriovenous oxygen extraction, and the patient serves as his own control, a change in pVO2 reflects a change in cardiac output at peak exercise,8 assuming that haemoglobin (Hb) has not changed. Accordingly, if symptoms are caused by significant haemodynamic compromise from the aortic stenosis and the left ventricular function has not significantly deteriorated, an improvement in cardiac output after AVR should be expected and be reflected in an improved pVO2.
The objectives of this study were twofold: to determine the change in pVO2 from pre-AVR to 9 months post-AVR in patients with aortic stenosis with preserved left ventricular ejection fraction (LVEF) and no other valve disease or coronary disease requiring intervention; and to determine pre-AVR predictors of favourable or a less favourable outcomes in pVO2 after AVR.
Methods
Patients
The study population consisted of patients in our outpatient clinic referred for AVR in the period between March 2010 and March 2012 and who had a pre-AVR CPX. These patients either had been referred to our clinic from other cardiologists for evaluation for AVR because of symptoms and aortic stenosis or had been followed up with in our clinic and had developed and reported new or worsening symptoms. Inclusion criteria included the following: heart team decision of AVR based on current recommendations as symptoms judged as related to the aortic stenosis, equivocal symptomatic status, and symptoms revealed during exercise testing or decreased exercise capacity judged as related to aortic stenosis.
Exclusion criteria included the following: significant other valvular disease, indication for revascularisation (all patients had coronary angiograms prior to AVR), left ventricular dysfunction (ejection fraction<45% in the symptomatic state), or dysregulated atrial fibrillation (resting heart rate (HR)>90). A CPX9-month post-AVR was booked for eligible patients.
All decisions of AVR based on clinical information and echocardiography were performed by an independent heart team, which did not include the study physicians/authors, and who had no knowledge of the details of the CPX results. All AVRs were performed at an institution with an AVR volume per year above 300.
In addition to CPX pre-AVR and 9-month post-AVR, all patients underwent NYHA functional classification, assessment of health-related quality of life, echocardiography, blood samples and ECG, and the use of medications were recorded.
Whereas patients who have a CPX just prior to AVR might be regarded as a selected population, we also, during the same period, performed CPX 9 months after AVR in an unselected group of patients (reference group) who did not had a pre-AVR CPX and gave consent to a 9-month post-AVR evaluation.
All included patients gave written informed consent, and the study was approved by the local committee (1-01-83-0002-07).
Outcome measures
The primary outcome measure was the relative change in pVO2 after AVR ((post-AVR−pre-AVR)/pre-AVR absolute pVO2). A significant change in pVO2 was defined as a relative change in pVO2>10%, because according to the coefficient of variability by test–retest in our laboratory9 and others,10 the probability that a change of this size would happen by chance is around 5% or less. Accordingly, a significant favourable outcome was defined as a relative increase in pVO2 by more than 10%, and a significant unfavourable outcome was defined as a decrease in pVO2 by more than 10%.
Cardiopulmonary exercise testing
CPX was performed on a bicycle ergometer with breath-by-breath measurements of VO2, carbon dioxide exhaustion (VCO2), ventilation (VE), continuous HR and ECG monitoring (Innocor; Innovision, Odense, Denmark). For each patient, the load was calculated and set to reach the predicted pVO2 in ∼8–10 min, with linear increments in the load at 1 min intervals after 3 min of unloaded cycling.11 The stopping criteria included exhaustion and symptom limitation. Thus, the exercise time and the watts achieved are not relevant. The pVO2 reflects cardiac output, partial pressure of oxygen (pO2) pulse (pVO2/HR) reflects stroke volume, and an estimate of stroke volume at peak exercise (pO2 pulse/Hb-index) can be obtained from (pO2 pulse/Hb in g/dL)×100, because Hb in g/dL then corresponds to the mL oxygen extraction per dL.11
The predicted pVO2 was defined according to current European Association for Cardiovascular Prevnetion and Rehabilitation/American Heart Association recommendations,6 which incorporate age, sex, weight and obesity. The predicted peak HR (pHR) was calculated as 220−age. The predicted pO2 pulse was calculated as the predicted pVO2/predicted pHR. The anaerobic threshold was determined using the V-slope method. Spirometry was performed at rest and the forced expiratory volume after the 1 s (FEV1) was obtained.
Quality of life and NYHA class
Patients completed the short-form health survey questionnaire (SF-36) at home and returned it prior to the CPX. The physical component summaries (PCSs) were calculated using dedicated software.12 ,13 The NYHA class and presence of symptoms were determined by the physician prior to the CPX and echocardiography. The PCS measure is less prone to physician and patient bias from the placebo effect than NYHA classification, because it is more comprehensive, and it is unlikely that the patient will remember the comprehensive answers given more than 9 months ago.
Echocardiography
All patients underwent two-dimensional and Doppler echocardiography (General Electric Vivid E9; GE Healthcare, Horten, Norway). Apical continuous wave and pulsed wave Doppler recordings were created to obtain the peak flow velocity (Vmax), mean pressure gradient from the velocity time integral, ventricular outflow velocity time integral and early diastolic inflow velocity (E). The left ventricular outflow diameter was measured along the parasternal long axis in the mid-systole. The aortic valve areal index (AVAI) was calculated using the continuity equation and indexed for body surface area. The LVEF was estimated visually from several two-dimensional projections. Pulsed tissue Doppler recordings were made from the apex to obtain the early lateral mitral annulus velocity (e’), and E/e’ was calculated as an expression of diastolic pressure.
Colour tissue Doppler recordings of the mitral annulus were made from the apex. The peak systolic tissue velocity (Sa) was calculated from the mean of the lateral and septal values and was used because it is a more sensitive marker of systolic function in aortic stenosis than the ejection fraction.14
Brain natriuretic peptide
Blood samples and analyses were performed in the clinical chemistry department. Different assays were used by the laboratory during the study period (for economic and logistic causes); this scenario is not unrepresentative for daily practice. Therefore, brain natriuretic peptide (BNP) level is presented according to the upper level of normal (ULN), incorporating age and sex and as a BNP level/ULN of BNP ratio. The most commonly used assay had ULN from 25 pg/mL (youngest male) to 77 pg/mL (oldest female).
Statistics
Statistical calculations were conducted using the software program IBM SPSS Statistics V.20 (New York, USA). Continuous variables for groups are presented as means and SDs if not indicated otherwise. Assumptions of normality were assessed by normal plots and Shapiro-Wilk test. Non-normally distributed measures were transformed to the natural logarithm (ln) if necessary. The unpaired t-test was used to compare means in two groups, and the paired t-test was used for within-group changes at two time points. Categorical variables are presented as number and percentages and between-group differences determined using Fisher's exact test; for proportions, the normal approximation to the binomial distribution was used.
Predictors of significant favourable and unfavourable outcomes of pVO2 were sought using linear and logistic regression. The primary objective was to determine pre-AVR predictors, so the following variables were tested: echocardiographic severity of the aortic stenosis, that is, resting mean gradient as a continuous variable and according to <40 mm Hg and AVAI as a continuous variable and according to <0.4 cm2/m2. As an indicator of a lower stroke volume at peak exercise pO2 pulse as a continuous variable or according to < median value in the study population was used. Preoperative parameters that might influence outcomes were also tested, that is, age, sex, atrial fibrillation, chronic obstructive lung disease, hypertension, β-blocker use, BNP (as BNP>ULN and ratio BNP/ULN of BNP), Sa and E/e’. Predictors that were present in >5 patients were not included in the linear regression analysis (eg, diabetes and preoperative pacemaker). Postoperative parameters that might influence outcomes were also tested, that is, pacemaker, β-blocker use, surgical versus transcatheter AVR (SAVR vs TAVR), BNP, change in Hb and days in hospital for AVR. Furthermore, the impact of postoperative Sa, E/e’ (and change here) and the mean gradient on the change in pVO2 was also assessed. Univariate predictors that had p<0.10 were entered into a forward stepwise regression with the predictor with the lowest p<0.05.15 Predictor variables with a p<0.05 by bivariate analysis were kept in the model and tested with other predictor variables with p<0.05 using bivariate analysis. Predictors were then kept in the multivariate model(s) if they showed p<0.05 or improved the model, as assessed by the adjusted R2. Goodness of fit was assessed by 2×2 tables and the Hosmer-Lemeshow test for logistic regression models and for linear regression models by adjusted R2 and a normal plot of the residuals.
Results
A total of 42 patients were recruited for the study. Four patients withdrew consent before the 9-month post-AVR visit, and one patient had died (non-cardiovascular). Characteristics for the 37 patients who completed the 9-month follow-up are presented in table 1.
Patient characteristics
The indication for AVR included the following: new or worsening exercise induced (in daily life) dyspnoea with or without chest discomfort/angina (n=14), equivocal symptomatic status and symptoms (more than usual dyspnoea or chest discomfort/angina) revealed during exercise test (n=6), dizziness and dyspnoea during exercise test (n=2), equivocal symptomatic status and low exercise capacity not explained by other causes than aortic stenosis (n=5), hospitalisation for heart failure (n=4), primarily angina (n=3), exercise-induced syncope (not during exercise test; n=2), pathological and worsening CPX with declining pVO2, and pO2 pulse and trajectories in a younger asymptomatic patient with peak gradient>100 mm Hg (n=1).
Nine patients had TAVR in a randomised study of TAVR versus SAVR in patients older than 70 years who were eligible for SAVR. This study showed a neutral outcome and did not indicate worse functional status for the TAVR group.16
Change in pVO2 after AVR
Pre-AVR and post-AVR measures are presented in table 2.
Cardiopulmonary exercise testing, echocardiographic and other characteristics pre-AVR and post-AVR
The time interval between pre-AVR CPX and the AVR was 2.0 (SD 1.5) months.
The mean pVO2 as well as the indices of stroke volume at peak exercise (pO2 pulse/Hb index and percentage pO2 pulse of the predicted) did not change after AVR. It should be noted that the pHR and respiratory coefficient (reflecting effort) were similar pre-AVR and post-AVR. Measures of resting left ventricular systolic (Sa) and diastolic (E/e’) function improved. In contrast to the objective measure of functional capacity (pVO2), an improvement in the NYHA classification was found. However, the physical component score of the SF-36, which is without physician bias and less patient bias, also did not improve, and the mean value corresponded with the second quartile (25–50%) in the age-comparable population.12 ,13 Figure 1 shows that the relative change in the absolute pVO2 was heterogeneous with 9 (24%) of the study patients showing a significant increase (>10%) and 11 patients (30%) showing a significant decrease (>10%). Characteristics of those who improved or declined >10% in pVO2 are presented in online supplementary appendix table A1.
Supplemental material
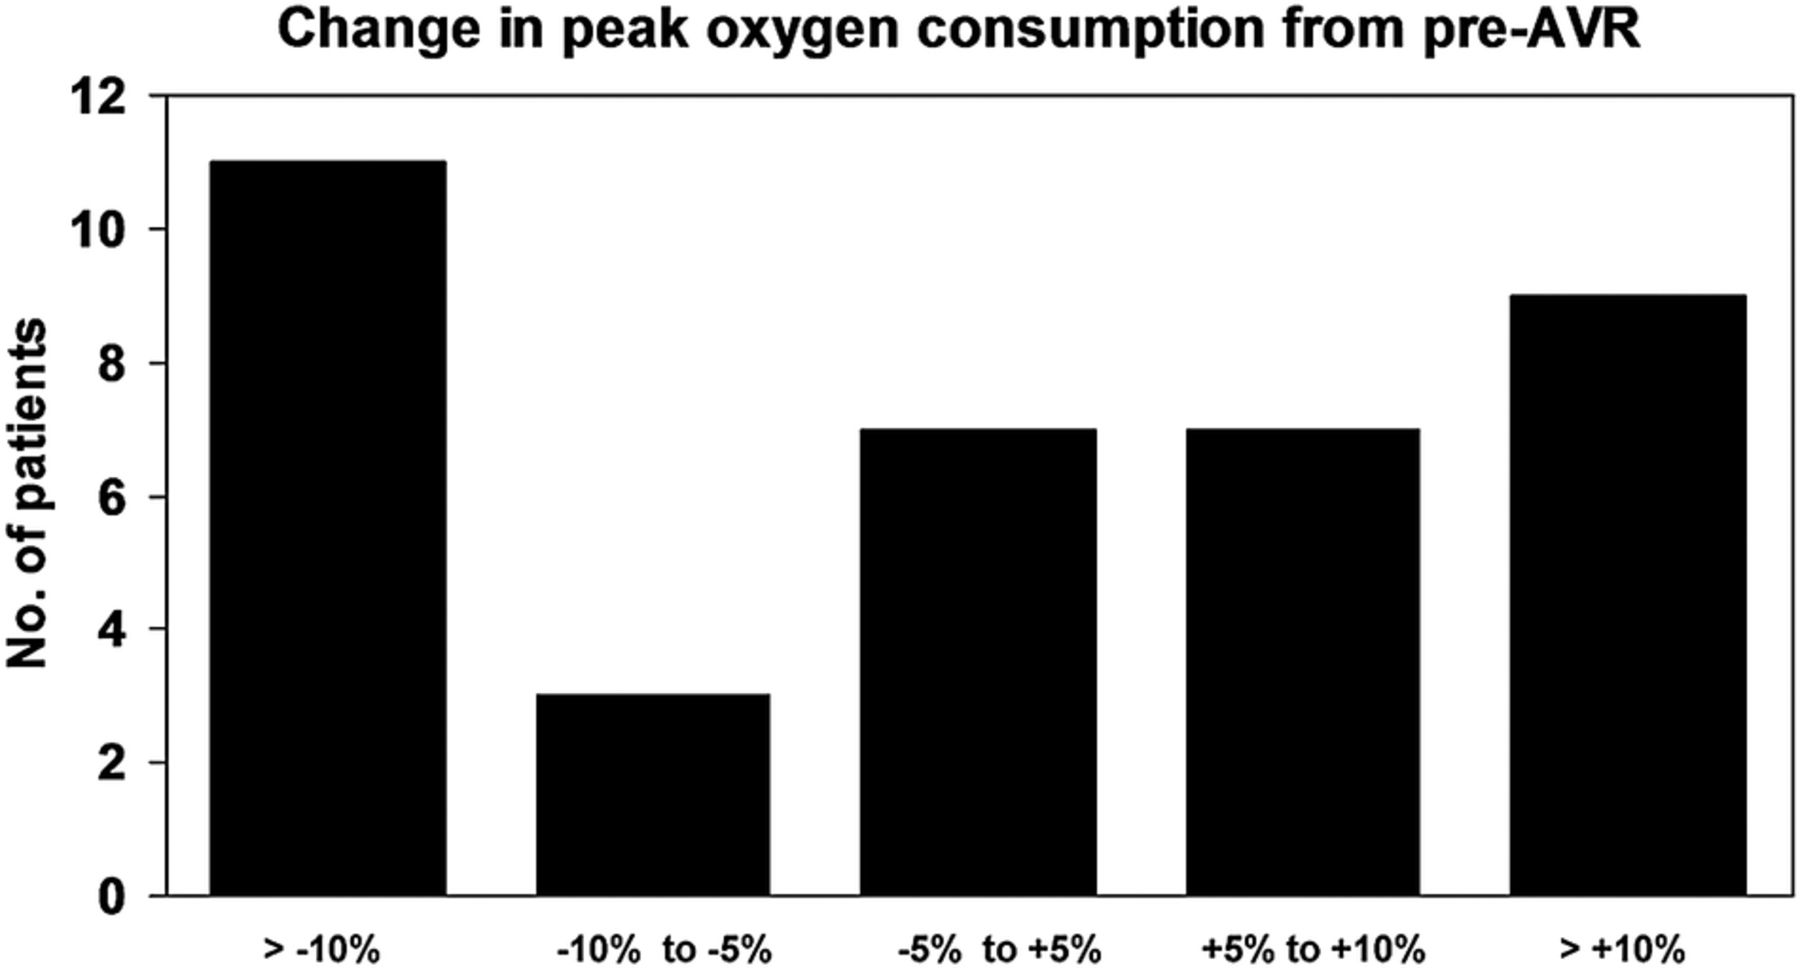
Distribution of relative percentage change ((post-AVR−pre-AVR)/pre-AVR) in the patients’ absolute pVO2 values between pre-AVR and post-AVR after 9 months. Coefficient of variability by test–retest for pVO2 is 5% in our laboratory. AVR, aortic valve replacement; pVO2, peak oxygen consumption.
Predictors of the relative change in pVO2 after AVR
Predictors of change in pVO2 as a continuous variable
Results of univariate linear regression on change in pVO2 are presented in table 3. Results of multivariate analysis are presented in table 4. Preoperative higher mean gradient (β=0.40, p=0.001) and BNP<ULN (β=−0.50, p=0.009) were associated with better outcome for relative change in pVO2, and accordingly a lower preoperative mean gradient (particularly mean gradient<40 mm Hg) and BNP>ULN were associated with worse outcome for relative change in pVO2.
Univariate linear regression on the increase in pVO2 after AVR
Multivariate linear regression on the relative increase in pVO2 after AVR
Significant increase in pVO2
Results of univariate analysis are presented in online supplementary appendix table A2. By multivariate analysis, the lower AVAI (OR 0.18, 95% CI 0.04 to 0.83, p=0.027) and lower percentage achieved of the predicted peak O2 pulse (OR 0.94, 95% CI 0.88 to 0.99, p=0.045) were significant predictors of an increase in pVO2>10%. As binary measures AVAI<0.4 cm2/m2 (OR 14.1, 95% CI 1.35 to 147.5, p=0.027) and pO2 pulse<98% of the predicted value, that is, < the study population median (OR 7.5, 95% CI 1.09 to 51.5, p=0.040) predicted a >10% increase in pVO2. This finding is illustrated in figure 2. Hypertension or post-AVR β-blocker treatment were not significant predictors (p>0.10) by multivariate analyses. Those who improved significantly in pVO2 had less elevated BNP and a favourable outcome for E/e’ and Sa after AVR (see online supplementary table appendix A1), indicating reversible diastolic dysfunction and some improvement in resting systolic function as well.

Impact of preoperative AVAI<0.4 cm2/m2 and preoperative pO2 pulse on the frequency of improvement by more than 10% in absolute pVO2 between pre-AVR and 9 months post-AVR. A value of 98% of the predicted pO2 pulse corresponds to the median value. AVAI, aortic valve area index; AVR, aortic valve replacement; pO2, partial pressure of oxygen; pVO2, peak oxygen consumption.
Those who achieved a pO2 pulse less than the median value tended to have more extreme changes in pVO2 (non-normally distributed), with none of these patients exhibiting relative changes in pVO2 between a 9.1% decrease and a 5.2% increase
Significant decrease in pVO2
Preoperative predictors of a >10% relative decrease in pVO2 by multivariate analysis were lower mean gradient (OR 0.93, 95% CI 0.86 to 0.99, p=0.033) or as a binary predictor mean gradient <40 mm Hg (OR 14.4, 95% CI 2.2 to 93.3, p=0.005). If only postoperative predictors were entered in the multivariate analysis, post-AVR pacemaker was the single significant predictor (p=0.031). If postoperative pacemaker was forced into the analysis, a lower mean gradient (p=0.004) or mean gradient <40 mm Hg (p=0.017) were still significant predictors. This result is illustrated in figure 3. Results of univariate analysis are presented in online supplementary appendix table A2. If all predictors with p<0.10 were forced into the model, a mean gradient<40 mm Hg was still the single predictor with p<0.05. In contrast to those who improved significantly in pVO2, mean E/e’ remained elevated and the improvement in Sa was numerically less, as shown in online supplementary appendix table A2.

Impact of preoperative MG below 40 mm Hg and presence of postoperative PM on frequency of a decline in absolute pVO2 of more than 10% between pre-AVR and 9 months post-AVR. AVR, aortic valve replacement; MG, mean gradient; PM, pacemaker; pVO2, peak oxygen consumption.
Representativeness of the study patients
Pre-AVR and post-AVR characteristics in our study population were compared with patients who had AVR without a pre-AVR CPX during the study period (reference group) in online supplementary appendix table A3.
Discussion
Observed change in pVO2 and its predictors
Despite preserved preoperative LVEF and general improvements in systolic and diastolic function (Sa and E/e’) with values after AVR for Sa in the normal range for age,17 on average the post-AVR pVO2 did not improve and was lower than predicted. This may largely be explained by the heterogeneous response in change in pVO2 with significant increases in some and significant decrease in others. An average decline in Hb by 0.3 mmol/L, as noted in this study, may reduce pVO2 by up to 3%,11 and the change in Hb was a univariate predictor of the change in pVO2. The effect of detraining during convalescence might also affect pVO2 by decreasing stroke volume.8 However, the unchanged anaerobic threshold from pre-AVR to post-AVR does not support these explanations; furthermore, just prior to AVR, the patients were likely not very active. The mean pHR of 85% of the predicted and the mean respiratory exchange ratio <1.1, unchanged from pre-AVR to post-AVR, may suggest that some study patients were symptom limited during the tests, which may have negatively impacted pVO2.
Less severe aortic stenosis (lower mean gradient) and elevated BNP predicted an unfavourable outcome for change in pVO2. Since patients with subnormal LVEF were not included and Sa postoperatively was in the normal range for the age, these observations may indicate that the major culprit of symptoms and decreased functional capacity in these patients may not necessarily have been the aortic stenosis. Dyspnoea, chest tightness and decreased functional capacities are rather unspecific symptoms. A causal relation between such symptoms and aortic stenosis, if less severe, and that AVR will improve objective functional capacity should be regarded with some scepticism. The prevalence of pulmonary disease was just 14% and did not predict an unfavourable outcome for change in pVO2 with AVR. However, none of our patients with pulmonary disease increased pVO2>10%. Persistent (irreversible) diastolic dysfunction not necessarily always caused primarily by the aortic stenosis, might explain the lack of improvement in pVO2. Although E/e’ or changes here were not found as significant predictors of change in pVO2 in this study, it is noteworthy that mean E/e’ declined to a near-normal level in those who improved significantly (>10%) in pVO2 and was unchanged or elevated in those who declined significantly in pVO2. The latter group also had a high rate of BNP>ULN postoperatively.
On the other hand, more severe aortic stenosis predicted a more favourable outcome for change in pVO2, especially if BNP was not elevated. Furthermore, a lower AVAI combined with a lower O2 pulse (ie, lower stroke volume at peak exercise) predicted a significant improvement in pVO2 (>10%). These observations, together with the aforementioned observations on E/e’, may suggest that those who benefitted most from AVR with respect to pVO2 were those with more severe aortic stenosis who had impairment of stroke volume at peak exercise and had not developed persistent diastolic dysfunction, that is, those patients whose primary pathology was afterload mismatch causing reversible systolic and diastolic dysfunction, which was correctable by AVR.
The percentage of the predicted pO2 pulse was not a predictor of change in pVO2 by the linear regression analysis. Lower O2 pulse, reflecting lower stroke volume at peak exercise, may be the consequence of severe aortic stenosis with severe reversible afterload mismatch, and such patients may improve by AVR. However, lower O2 pulse will also be found in patients who are ‘unfit’,8 who have comorbidities, and who have irreversible diastolic dysfunction and less severe aortic stenosis. Such patients may not improve or even worsen in pVO2 with AVR. This may have been demonstrated by our observations where those who achieved a pO2 pulse < median tended to have more extreme changes in pVO2. None of these patients exhibited relative changes in pVO2 between a 9.1% decrease and a 5.2% increase, and the combination of lower AVAI and lower O2 pulse predicted a relative increase in pVO2>10%.
How is improvement in functional capacity after AVR determined?
The literature on pVO2 including the change in pVO2 and predictors of pVO2 after AVR is sparse. Lee et al18 found a non-statistically significant mean 12% relative increase in pVO2 after AVR in 11 severely symptomatic younger patients.18 Munt et al2 found no improvement in mean exercise capacity by conventional exercise by testing 34 patients who were initially followed for asymptomatic aortic stenosis and later had AVRs, even though these patients on average improved in resting left ventricular systolic and diastolic function.
Predictors of pVO2 have been studied in unoperated patients with aortic stenosis. Dulgheru et al19 found that lower pVO2 was associated with lower resting stroke volume (and associated parameters) and higher resting valvuloarterial impedance, a measure that incorporates resting stroke volume and afterload. Steadman et al20 found that lower myocardial perfusion reserve was the single significant predictor of lower pVO2 explained by subendocardial ischaemia causing systolic dysfunction during exercise. We have previously found in unoperated patients with aortic stenosis that a low pVO2 was predicted by lower FEV1, lower HR and lower stroke volume at peak exercise and by higher VE/VCO2,9 that is, pulmonary function, cardiac function and cardiopulmonary coupling. These results agree with the concept described by Wasserman et al.11
Improvements after AVR are usually assessed using symptom improvement and improvement in NYHA class. Such evaluations are hampered by the placebo effect and by double-unblinded assessment. It is well known that even sham operations may improve symptoms,21 and the NYHA classification has been shown to be inadequate to determine a patient's response to therapy and to compare one patient with another; also, it is influenced by how patients perceive their symptoms as well as physician bias4 ,22 but is nevertheless widely used in studies on aortic stenosis.16 ,23 ,24 The NYHA classification post-AVR seems to overestimate functional capacity compared with objective measures: patients classified NYHA I post-AVR have been reported to have 6MWT results of <120 to 260 m,23–25 which is much less than the age-expected normal and similar to that of patients with systolic heart failure with a NYHA III/IV classification.26 Despite these shortcomings, studies assessing the improvements after AVR using measures that are more objective are sparse. Rimington et al27 found that the 6MWT distances after valve replacement on average increased around 40% from baseline. In patients with comparable age and NYHA classification at baseline, Flett et al28 found a somewhat lower mean increase (around 12%) in 6MWT after AVR. Patients who are less restricted by an illness may show less improvement with treatment. The study by Rimington et al also included patients who had mitral valve and coronary artery surgery and who may have been more or felt more symptomatic than the patients in the studies by Flett et al,27 Munt et al,28 and in our present study, despite that the patients had comparable NYHA classifications. Comorbidities and higher age may limit the improvement. In the study by Flett et al,28 patients with persistent atrial fibrillation, pacemakers and pulmonary disease were not included, contrary to in the study by Munt et al2 and in our present study, where the patients were also older than in the other studies.2 ,27 ,28
One should appreciate that CPX and 6MWT are not interchangeable but complimentary.29 The 6MWT does not determine peak oxygen uptake, that is, peak functional capacity of the cardiorespiratory system, and it does not diagnose the cause of dyspnoea on exertion or evaluate the causes or mechanisms of exercise limitation.29 Rather, it reflects daily pace and therefore has good correlations to measures of quality of life.30 The 6MWT distance is dependent on motivation, instruction, gait, psychological, neurological and orthopaedic factors. If the anaerobic threshold, a sufficient high HR and a respiratory coefficient>1 is not reached, which is not highly likely in patients classified with NYHA II with decreased walking distance, one cannot suggest that a low walking distance is caused by a limitation from the cardiopulmonary system.30 Furthermore, the 6MWT test has been found with limited reproducibility by test–retest, showing significant improvements (mean 7%) already by the second test,31 and it is likely to be influenced by the placebo effect and by the patients' beliefs in surgery.27 Therefore, we feel that a more true and less-biased assessment of functional capacity and change here post-AVR preferably should be done using CPX reporting at least pVO2, pHR, respiratory coefficient, pulmonary function tests and Hb, as done in our study.
Limitations
The study population is of limited size, and less than half of potentially eligible patients in our region were accounted for (either in study or reference group). The study group all had a pre-AVR CPX and therefore theoretically may have been less symptomatic with less haemodynamic compromise than many patients who undergo AVR. However, the severity of the aortic stenosis was comparable to our reference group, and except for a NYHA≥II classification (73% vs100%), the pre-AVR and post-AVR characteristics were similar between the study and reference groups.
The study group included those with comorbidities, on β-blockers, prolonged hospital stay, atrial fibrillation and pacemakers, which may affect outcome. However, these conditions are not uncommon post-AVR, as also shown by the equal prevalence in our study and reference groups. Exclusion of patients with such conditions (or pausing β-blockers) might lead to clearer results with regard to the outcome of AVR, but this may lead to a biased result with regard to the outcome of AVR in patients in the daily practice. The higher age compared with other studies2 ,3 ,18 ,27 ,28 in our study group may also affect outcome, but it is a negative indicator of selection, as also expressed by the comparable age distribution in our study and reference groups.
The echocardiographic recordings and measurements were not blinded to symptomatic pre-AVR and post-AVR status, which may bias the measures. The same can be said for the CPX. However, the average similar pre-AVR and post-AVR pHRs and respiratory coefficients indicate this as a minor issue.
Lack of improvement in pVO2 does not necessarily mean that the patients' prognosis may not have been improved by AVR, but it does indicate that objective exercise capacity and cardiac output at peak exercise has not improved.
Conclusions
In patients without impaired LVEF, the change in pVO2 after valve replacement for aortic stenosis was heterogeneous, and the mean pVO2 post-AVR was lower than that predicted. Preoperative mean gradient and BNP>ULN showed positive and negative associations with improvement in pVO2, respectively. A significant (>10%) improvement in pVO2 after AVR was predicted by more severe aortic stenosis and lower peak oxygen pulse, preoperatively. A significant decline in pVO2 was predicted by less severe aortic stenosis. These findings can be used to better inform patients as they consider AVR.
References
Footnotes
Contributors VDTL and LK-H provided substantial contributions to the conception or design of the work. All three authors were involved in the acquisition, analysis or interpretation of data. VDTL was involved in drafting the work; GVHJ and LK-H were involved in revising it critically for important intellectual content. All authors were involved in final approval of the version published and agree to be accountable for all aspects of the work in ensuring that questions related to the accuracy or integrity of any part of the work are appropriately investigated and resolved.
Funding Committee for Research, Region Zealand.
Competing interests None declared.
Patient consent Obtained.
Ethics approval Ethics committee, Region Zealand, Denmark.
Provenance and peer review Not commissioned; externally peer reviewed.
Data sharing statement No additional data are available.