Article Text

Abstract
Objective An accurate tool with good discriminative for bleeding would be useful to clinicians for improved management of all their patients. Bleeding risk models have been published but not externally validated in independent clinical data set. We chose the National Cardiovascular Data Registry (NCDR) percutaneous coronary intervention (PCI) score to validate within a large, multisite community data set. The aim of the study was validation of this Bleeding Risk Score (BRS) tool among a subgroup of patients based on body mass index.
Methods This is a large-scale retrospective analysis of a current registry utilising data from a 37-hospital health system. The central repository of patients with coronary heart disease undergoing PCI between 1 June 2009 and 30 June 2012 was utilised to validate the NCDR PCI BRS among 4693 patients. The primary end point was major bleeding. Validation analysis calculating the receiver operating characteristic curve was performed.
Results There were 143 (3%) major bleeds. Mean BRS was 14.7 (range 3–42). Incidence of bleeding by risk category: low (0.5%), intermediate (1.7%) and high risk (7.6%). Tool accuracy was poor to fair (area-under-the curve (AUC) 0.78 heparin, 0.65 bivalirudin). Overall accuracy was 0.71 (CI 0.66 to 0.76). Accuracy did not improve when confined to just the intermediate risk group (AUC 0.58; CI 0.55 to 0.67). Tool accuracy was the lowest among the low BMI group (AUC 0.62) though they are at increased risk of bleeding following PCI.
Conclusions Bleeding risk tools have low predictive value even among subgroups of patients at higher risk. Adjustment for anticoagulation use resulted in poor discrimination because bivalirudin differentially biases outcomes toward no bleeding. The current state of bleeding risk tools provide little support for diagnostic utility in regards to major bleeding and therefore have limited clinical applicability.
- INTERVENTIONAL CARDIOLOGY
- CORONARY ARTERY DISEASE
This is an Open Access article distributed in accordance with the Creative Commons Attribution Non Commercial (CC BY-NC 4.0) license, which permits others to distribute, remix, adapt, build upon this work non-commercially, and license their derivative works on different terms, provided the original work is properly cited and the use is non-commercial. See: http://creativecommons.org/licenses/by-nc/4.0/
Statistics from Altmetric.com
Key questions
What is already known about this subject?
Low body mass index is an independent risk factor for bleeding following percutaneous coronary intervention (PCI).
What does this study add?
A Bleeding Risk Score tool is not predictive even in high-risk subgroups such as those based on weight where bivalirudin is used during PCI.
How might this impact on clinical practice?
This might change the emphasis from predicting bleeding in a few patients to preventing bleeding among all patients undergoing PCI.
Introduction
Periprocedural major bleeding is a significant independent predictor of vascular complication including non-fatal myocardial infarction and death following percutaneous coronary intervention (PCI).1 ,2 Patients with major bleeding have higher in hospital and 30-day mortality rates compared to those without major bleeding.3 ,4 Furthermore, major bleeding requiring transfusion significantly increases the risk of death at 1-year.5 The impact of bleeding after PCI has been confirmed with more recently refined bleeding classifications such as BARC (Bleeding Academic Research Consortium).6 ,7 Despite advances in technology and therapy, major bleeding following PCI remains a significant concern.
Attempts have been made to identify populations of patients based on their bleeding risk following PCI.8–11 These include various Bleeding Risk Score (BRS) tools that are applied prior to PCI to predict bleeding based on patient demographic and health condition characteristics. The National Cardiovascular Data Registry (NCDR) PCI BRS is a common tool currently in use in the USA.12 Our understanding of the utility of these tools has been limited to databases in which they were designed and to overall patient populations.10
A tool that accurately discriminates bleeding risk would be useful for therapeutic management and standardisation. However, these BRS tools have yet to be validated with various external clinical databases and confirmation of the predictive value of these BRS tools is lacking for specific populations such as those based on BMI. The extent to which these tools have utility among subgroup populations remains to be determined. Patients with Lower body mass index (BMI ≤25), who undergo a PCI are at greater risk of bleeding than patients who are overweight (BMI >25).13– These patients experience more bleeding, major as well as more minor bleeding, episodes than patients who are overweight or obese.16 ,17 Thus, PCI patients can be at increased risk of longer term poor outcomes including death, based on their BMI.18
The purpose of this study was to examine the diagnostic utility of the BRS tool among patients undergoing PCI in a clinical database of real world practice. We chose a nationally recognised index, the NCDR of PCIs BRS, to be validated by an independent, multisite community hospital real-world data registry.11 This bleeding risk index was chosen because if its current use among hospitals, including Accountable Care Organizations (ACO) in the USA. The hypothesis was to test whether the BRS can discriminate bleeding risk among subgroups of patients based on BMI.
Methods
Study design and population
This is a real-world, large-scale retrospective analysis utilising American College of Cardiology (ACC) data from the Ascension Health System (AHS). The AHS includes a group of 39 community hospitals across the USA. A central repository, independent of the NCDR-CathPCI database, was prospectively initiated across the health system in 2007 with mandatory reporting of 84 standardised data points defined by the ACC. Data were entered prospectively by trained personnel at the time of the heart catheterisation for consecutive patients from all AH hospitals performing catheterisation in this healthcare system. This data entry was collected and entered into the hospital registry independent of national reporting by hospitals to the NCDR and, unlike the NCDR, does not include university hospital or tertiary centre data. Cath laboratory technicians and nursing staff entered the data immediately following each procedure. The registry represents procedures and devices as used in routine clinical practice per operator discretion. The database is routinely audited for accuracy and completeness. The data from the most recent 3-year period from 1 June 2009 through 30 June 2012 for index PCI procedures was selected (n=5114). Preprocedure creatinine values were used for the glomerular filtration rate (GFR) calculation. Patients missing preprocedure creatinine (n=254) had postprocedure creatinine imputed into the calculation. An additional 167 patients had missing precreatinine and postcreatinine and were excluded from the analysis (3.2%). Patients with complete BRS information were included in this study (n=4693).
End points
The primary end point for the predictive accuracy of the NCDR PCI BRS was major bleeding episodes. Major bleeding was defined as any of the following occurring within a 72 h period of the procedure: haemoglobin drop of ≥3 g/dL; transfusion of whole blood or packed red blood cells; procedural intervention/surgery at the bleeding site to reverse/stop or correct the bleeding. This definition by the ACC mirrors that of the BARC criteria. For example, a Type 3a BARC criteria fits our use of a ≥3 g/dL drop in hemoglobin and a Type 3b BARC criteria fits our use of any need for procedural intervention or surgery.
Bleeding risk model
The risk scale used for this propensity analysis was the NCDR PCI BRS.11 The 13-point (pt) scale includes the prognostic factors of acute coronary syndrome (ACS) type (10 or 3 pt), New York Heart Association (NYHA) class IV CHF status (4 pt), gender (6 pt), cardiovascular history (8, 4 or 2 pt), no previous PCI (4 pt), age (8, 5, or 2 pt) and estimated GFR (1 pt per 10 unit decrease <90). The risk score is further categorised into three distinct risk levels of low (≤7 pt), intermediate (8–16 pt), and high (≥17 pt). Continuous variables are presented as means (SDs) and categorical variables are presented as counts (%) and compared by χ2 analysis and Fischer Exact test for rare event rates. The BRS was calculated for each patient in the database from the prognostic variables and programmed into SPSS. The Modification of Diet in Renal Disease (MDRD) equation was used to calculate the GFR (mLs/min/1.73 m2) from the preprocedure creatinine (mg/dL) levels reported in the registry and the following formula was imputed into the database (186×(creatinine/88.4)−1.154×(age)−0.203×(0.742 if female)×(1.210 if black).18 Creatinine levels were those that were the most recent creatinine level obtained between the procedure and 1 month prior to the procedure. The actual BRS was calculated and then constructed to assign patients into three risk categories (low, intermediate and high). Patients were further categorised by cut-off values (≤7 and 8–16) with the low and intermediate risk combined and the high-risk category (≥17) used as the comparative group for sensitivity and accuracy analyses.
Statistical analysis
Discrimination of the scale was evaluated by the receiver operating characteristics (ROC) curve and area-under-the curve (AUC) expressed by the c-statistic. Calibration or level of agreement between observed and predicted outcomes was assessed using the Hosmer-Lemeshow goodness-of-fit test. Sensitivity indicates the proportion of patients with the target disorder who have a positive test result (true positive). Specificity indicates the proportion of patients without the target disorder who have a negative test result (true negative). Likelihood ratio is the likelihood (probability) that a given test result would be expected in a patient with the target disorder compared to the same likelihood that the same result would be expected in a patient without the target disorder. For all analyses, significance was set at p<0.05. Software for processing the data was SPSS V.18.0 (Chicago, Illinois, USA).
Results
Baseline characteristics
Patient characteristics are summarised in table 1.
Patient characteristics for total sample (n=4693)
Of the total number of patients (n=4693), a majority were Caucasian (n=4259, 90.8%) and male (n=3139, 66.9%). Most were hypertensive (n=3964, 84.6%) and overweight (n=1633, 35.3%) or obese (n=2146, 46.4%). The BMI ranged from 10.6 through 390.8. Diabetes was present in 1728 (36.8%). The overall mean creatinine level was 1.18 (SD=0.93, range 0–20). The mean GFR level was 57.1 (SD=26.3, range: 2–818).
There were 1889 (40.3%) elective procedures and 2794 (59.6%) urgent or emergent. The most common indication for PCI was high-risk non STEMI or unstable angina (n=2064, 44%). A majority were conducted through femoral access (n=4546, 97.1%) and with manual compression to close the site (n=2884, 78.7%).
End points
A total of 143 patients (3%) experienced a major bleeding event. Bleeding event rates by type of anticoagulant are presented in table 2. There were fewer major bleeds among those treated with bivalirudin.
Major bleeding events by anticoagulant therapy
Bleeding risk score
A breakdown of all patients with the factors included in the bleeding risk model is summarised in table 3. The categorical cut-off points for the NCDR BRS placed a majority of patients into the ‘Intermediate’ risk category (n=2404, 51.2%). The mean BRS was 14.7 (SD=5.9, range: 3–42). The incidence of bleeding observed for the low, intermediate and high-risk categories was 0.5%, 1.7% and 7.6% respectively.
Breakdown of patient factors per Bleeding Risk Score
Diagnostic utility
The accuracy of the BRS for predicting major bleeding events was examined. Among the overall population, the BRS sensitivity was 0.76 and specificity was 0.64. The positive Likelihood Ratio (LR+) was 2.1 and the negative LR (LR−) was 0.38. The tool was least accurate for patients receiving bivalirudin (table 4). Test parameter results generated were least likely to distinguish bleeding events for patients given bivalirudin without glycoprotein IIb/IIIa inhibitor (GPI). Parameter results for patients given GPI were similar between heparin and bivalirudin (data not shown).
Accuracy of the Bleeding Risk Score by categories for major bleeding
Major bleeding was more common among the low BMI group (32 or 3.8%) compared to the high BMI group (111 or 2.9%) (OR=1.3, CI 0.90 to 1.8, p=0.11). Low BMI was associated with higher bleeding rates regardless of GPI use (table 5). This was not the case for those receiving bivalirudin in which the groups had low and equivalent rates of bleeding.
Bleeding events (n/total (%))
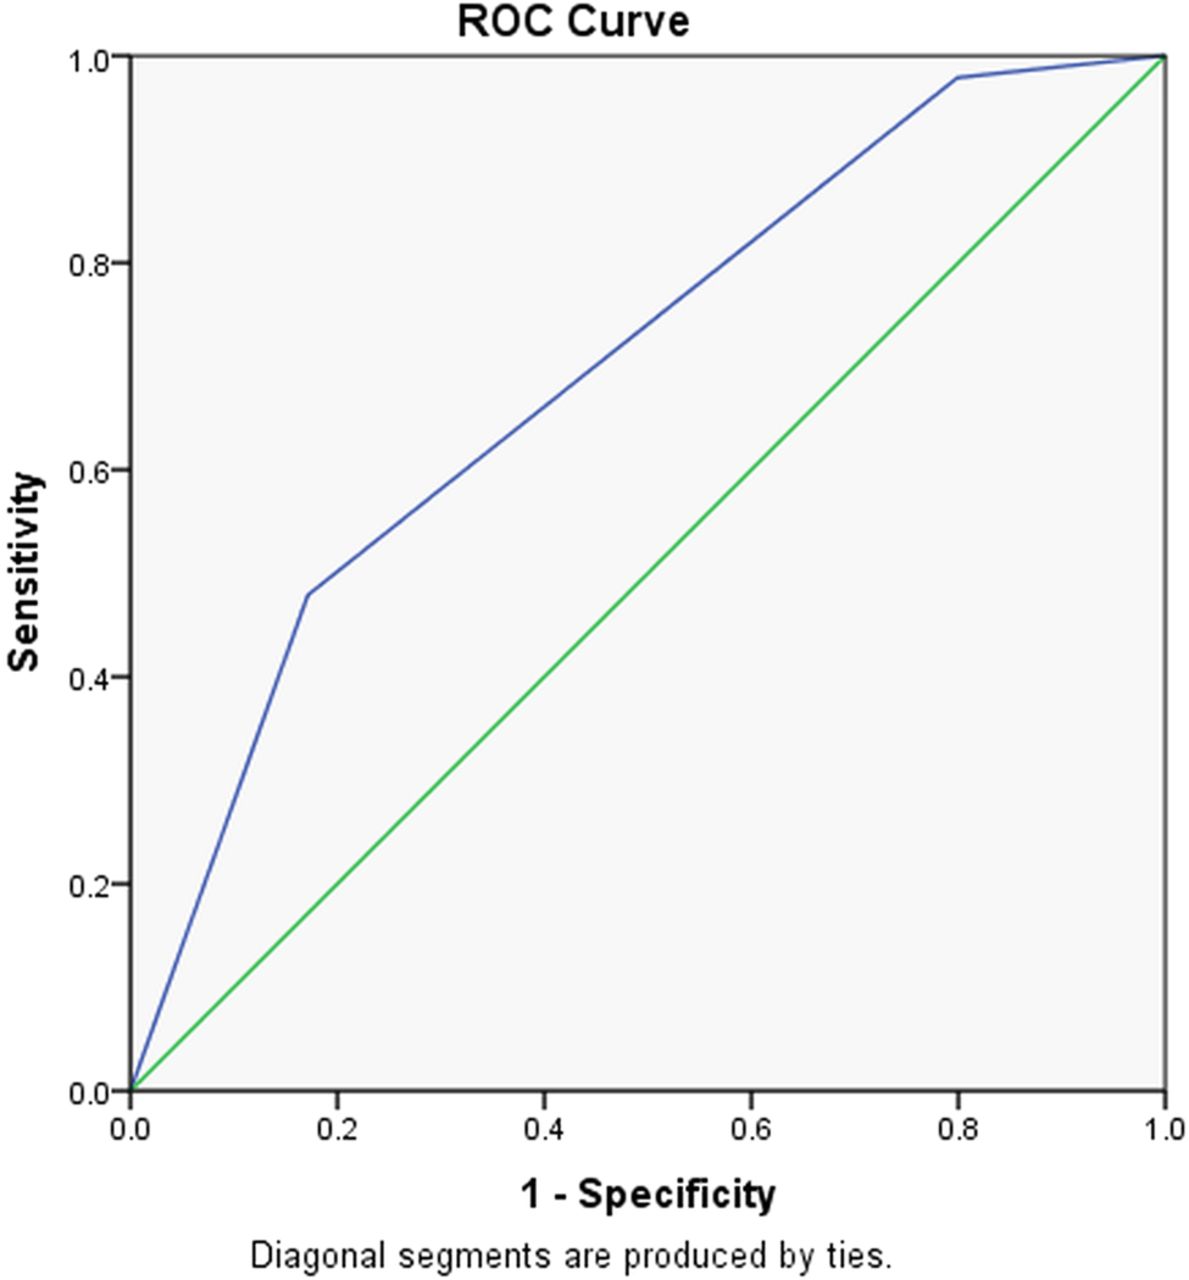
The diagnostic utility of the BRS among patients according to BMI demonstrated poor utility and did not differentiate bleeding risk between the BMI groups (table 6). The predictive ability of the tool was poor with likelihood test parameters, at best, indeterminate (figures 1 and 2).
Accuracy of the BRS for major bleeding by categories of BMI
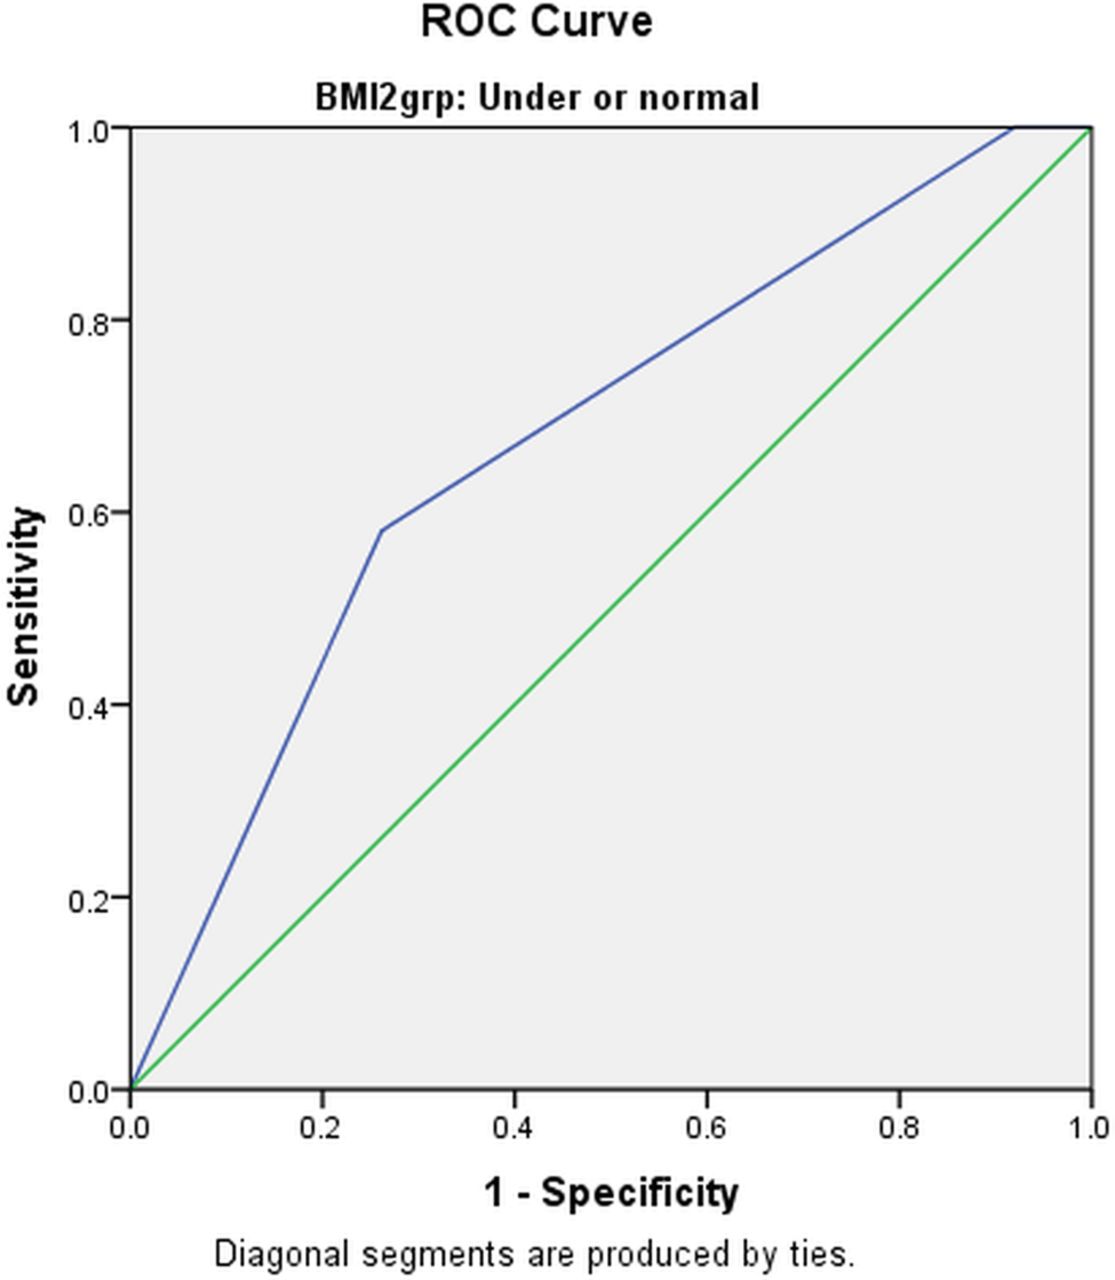
Predictive Ability of the Bleeding Risk Score (BRS) Tool among the low body mass index patients. ROC, receiver operating characteristics.

Predictive Ability of the Bleeding Risk Score (BRS) Tool among the High BMI Patients. BMI, body mass index; ROC, receiver operating characteristics.
Predictive ability
The ability of the tool to predict major bleeding was confirmed by calculating the AUC and the corresponding receiver operator characteristics (ROC) curve. Determination of the additive value of the tool was made by the AUC scale for which a 1.0 is a perfect test.11 The AUC ranking is as follows: excellent (0.91–1.0), good (0.81–0.90), fair (0.71–0.80), poor (0.61–0.70) and fail (0.51–0.60).
Among the entire sample of 4693 patients, 143 (3.0%) had a major bleeding outcome. The AUC was 0.71 (CI 0.67 to 0.79), a prediction value of for the BRS tool of ‘fair’. We then examined the accuracy within each cut-off point of the BRS (low, intermediate, high) (figure 3). The AUC for the Low Risk group of patients (n=879, events=4) was 0.57 (CI 0.26 to 0.88), the AUC for the Intermediate Risk group (n=2364, events=40) was 0.58 (CI 0.49 to 0.67), and the AUC for the High Risk group (n=1306, events=99) was 0.61 (CI 0.55 to 0.67). The corresponding predictive value for these risk levels is fail, fail, and poor, respectively. Performance of the tool fared the worst for lower BMI patients with Likelihood ratios that provided indeterminate results (figure 1).
Predictive Ability of Bleeding Risk Score (BRS) for Major Bleeding among Overall Population of percutaneous coronary intervention patients. BMI, body mass index; ROC, receiver operating characteristics.
The predictive accuracy of the BRS was least among patients that received bivalirudin with GPI (table 7). Predictive accuracy was also less among the low BMI group than the high BMI group (poor and fair, respectively). Among lower BMI patients the tool failed among those receiving bivalirudin regardless of GPI (fail in every case).
Accuracy of the bleeding risk tool among BMI and anticoagulant groups
Discussion
Low body mass index has been shown to increase the risk of bleeding after PCI.14 ,15 Findings from the current clinical database confirm that patients with lower BMI experience higher rates of bleeding. As a prediction tool for major bleeding, the BRS did not perform well. Its performance among overall populations, tested in an independent data set by the authors, has been at best—fair.19 However, in specific populations it performed poorly. We observed the least predictive value among a population that is traditionally at greater risk of bleeding, the low BMI group.
The bleeding risk tool was designed for an era of higher dose heparin before bivalirudin was a consideration. Because bivalirudin greatly decreases of the risk of bleeding for all patients regardless of bleeding risk,20 it is not surprising that the tool's discrimination capability would not be applicable.21 ,22 As expected, the predictive accuracy of the BRS was poor because bleeding rates among patients given bivalirudin are so low (1.5% or less). The ultimate goal is in lowering adverse outcomes, both short and long term, by eliminating bleeding complications. The link between bleeding and adverse outcomes has been established by other studies.4 ,5 ,23 Most recently in the USA, the Bleeding Academic Research Consortium (BARC) provides a consensus on bleeding definitions and long-term outcomes.6 ,24 A bivalirudin anticoagulant strategy limiting bleeding complications would thus decrease associated short-term and long-term morbidity and mortality.
For risk stratification purposes, the actual utility of the BRS for the clinician occurs among its intermediate risk groups. Yet, we observed poor predictive value with this category when validated in a real, world spectrum of patients (AUC: 0.58). Other studies examining in-hospital bleeding from PCI have performed validation of the BRS but our study is the first to perform the validation in a data set independent of the data by which the tool was developed.
Strengths for this study include the validation among a large, independent data set of patients across a wide spectrum of community hospital practices. We included only major bleeding events in order to focus findings on clinically significant patient outcomes. The data are current (2010–2012) and represent a wide range of clinical practices. Limitations include the skewed demographics to Caucasian men and that has implications for external validity. Also, the analysis was retrospective and there were low numbers of events in the low-risk group. However, the registry design overcomes limitations inherent in clinical trials and when analysis was combined with the intermediate risk group, accuracy did not improve substantively.
The least predictive value was observed among patients who received bivalirudin, with and without GPI. This may be more an indication of bivalirudin performance than of the tool's capability. Rates of bleeding were extremely low among patients receiving the drug. Therefore, future bleeding risk stratification models are not likely to be helpful. Other unmeasured confounders such as operator skill and experience may be more important in regards to bleeding complications than the type of anticoagulant used in the current era of anticoagulant options. In addition, clinical parameters, such as BMI, may no longer be relevant when bivalirudin is used during PCI.
References
Footnotes
Contributors All authors have contributed substantially to the conception and design of the work; or the acquisition, analysis or interpretation of data for the work; drafted the work or revised it critically for important intellectual content; given final approval of the version to be published; and agree to be accountable for all aspects of the work in ensuring that questions related to the accuracy or integrity of any part of the work are appropriately investigated and resolved.
Competing interests None.
Ethics approval Genesys Health System IRB.
Provenance and peer review Not commissioned; externally peer reviewed.
Data sharing statement The data on parameter results for patients given GPI are available to anyone on request.