Article Text

Abstract
Background Angiographic parameters can facilitate the risk stratification of coronary lesions but remain insufficient in the prediction of future myocardial infarction (MI).
AIMS We compared the ability of humans, angiographic parameters and deep learning (DL) to predict the lesion that would be responsible for a future MI in a population of patients with non-significant CAD at baseline.
Methods We retrospectively included patients who underwent invasive coronary angiography (ICA) for MI, in whom a previous angiogram had been performed within 5 years. The ability of human visual assessment, diameter stenosis, area stenosis, quantitative flow ratio (QFR) and DL to predict the future culprit lesion (FCL) was compared.
Results In total, 746 cropped ICA images of FCL and non-culprit lesions (NCL) were analysed. Predictive models for each modality were developed in a training set before validation in a test set. DL exhibited the best predictive performance with an area under the curve of 0.81, compared with diameter stenosis (0.62, p=0.04), area stenosis (0.58, p=0.05) and QFR (0.67, p=0.13). DL exhibited a significant net reclassification improvement (NRI) compared with area stenosis (0.75, p=0.03) and QFR (0.95, p=0.01), and a positive nonsignificant NRI when compared with diameter stenosis. Among all models, DL demonstrated the highest accuracy (0.78) followed by QFR (0.70) and area stenosis (0.68). Predictions based on human visual assessment and diameter stenosis had the lowest accuracy (0.58).
Conclusion In this feasibility study, DL outperformed human visual assessment and established angiographic parameters in the prediction of FCLs. Larger studies are now required to confirm this finding.
- Myocardial Infarction
- Coronary Artery Disease
- Coronary Angiography
Data availability statement
Data are available on reasonable request.
This is an open access article distributed in accordance with the Creative Commons Attribution Non Commercial (CC BY-NC 4.0) license, which permits others to distribute, remix, adapt, build upon this work non-commercially, and license their derivative works on different terms, provided the original work is properly cited, appropriate credit is given, any changes made indicated, and the use is non-commercial. See: http://creativecommons.org/licenses/by-nc/4.0/.
Statistics from Altmetric.com
WHAT IS ALREADY KNOWN ON THIS TOPIC
Current tools for the risk stratification of chronic coronary lesions based on anatomical severity and haemodynamic impact are imperfect, resulting in some lesions deemed low risk ultimately being responsible for a future myocardial infarction.
WHAT THIS STUDY ADDS
In this feasibility study, the first of its kind, we demonstrate that a deep learning (DL) algorithm using cropped images of coronary stenoses from invasive coronary angiography outperformed established angiographic risk stratifiers, as well as the visual assessment of cardiologists, in the prediction of future culprit lesions.
HOW THIS STUDY MIGHT AFFECT RESEARCH, PRACTICE OR POLICY
If these findings can be validated in larger cohorts, DL-based approaches to coronary lesion risk stratification could have a place in routine clinical practice in the future.
Introduction
In patients with stable coronary artery disease (CAD), the identification of lesions during invasive coronary angiography (ICA) that will be responsible for a future myocardial infarction (MI) remains challenging. Techniques used for the risk stratification of coronary lesions have evolved over time. While the assessment of a coronary lesion during ICA always starts with a simple visual assessment by the performing interventional cardiologist, the evaluation of the anatomical severity of a lesion has been improved by the advent of quantitative coronary angiography (QCA), permitting the calculation of diameter stenosis and area stenosis. More recently, techniques to evaluate the haemodynamic impact of a lesion have been developed, further improving risk stratification. Fractional flow reserve (FFR)—a gold-standard measure of the haemodynamic impact of an epicardial coronary artery stenosis1 2—has been shown to be a better predictor of future MI than diameter stenosis measured by QCA.1 In patients with CAD treated with medical therapy alone despite the presence of a lesion with a significant FFR, a future MI occurs most often at the site of a pathological FFR.2 Yet, up to 8% of patients with angiographically mild or intermediate stenoses deemed non-significant by FFR still present with an MI or a need for urgent revascularisation in the ensuing 2 years.3
The vast quantities of multivariate, multiformat medical data now available lends itself to the use of machine learning (ML) for the analysis of patient data. ML has been shown to be highly effective in predicting MI based on age, sex and early troponin values as well on 12-lead ECG alone among patients presenting to the emergency department.4–6 Applications of deep learning (DL), a branch of ML based on artificial neural networks, in the interpretation of ICA images have been limited to the automated segmentation of coronary arteries or the identification of significant coronary stenoses.7–10 More recently, DL has been applied to the detection of thin-cap fibroatheroma from optical coherence tomography images.11 However, DL has yet to be applied to the prediction of future MI based on ICA images only.
We recently reported that, in a population of patients who underwent ICA for an MI in whom ICA had been performed within the previous 5 years, mild coronary stenoses subsequently responsible for an MI exhibited a greater diameter stenosis and lower quantitative flow ratio (QFR) (quantitative flow ratio, an angiography-derived FFR) years before the event.12 However, given the described limitations of angiographic parameters in the risk stratification of non-significant coronary lesions, we evaluated if DL, trained on baseline angiographic images of non-significant lesions, could better predict future MI as compared with human predictions and predictions based on QCA or QFR.
Methods
Study design
Data were obtained from the Future Culprit study,12 a retrospective multicentre case–control study conducted in three European PCI centres (Lausanne University Hospital, Switzerland; Fribourg University Hospital, Switzerland; OLV Aalst, Belgium).
Study population
Details of the Future Culprit study have been previously reported.12 Briefly, patient selection was performed in two steps: (1) all adult patients admitted between January 2008 and December 2019 with an MI (non-ST elevation MI (NSTEMI) and ST-elevation MI (STEMI)) were screened to identify those with a previous coronary angiography (defined as baseline coronary angiography) in the 5 years preceding the MI. In order to be included, patients required images permitting QFR analysis of the lesion that would be responsible for the future MI (future culprit lesion, FCL). The latter was defined according to territory affected by ECG changes at the time of MI. In the absence of such modifications, FCL was defined as the most severe lesion treated. In addition, at least one additional major epicardial vessel had to be available for QFR analysis. The lesions identified on these vessels were defined as non-culprit lesions (NCL). The lesions were evaluated by visual assessment during screening and were analysed if they had a diameter of stenosis of at least 10%. Exclusion criteria for QFR analysis were: in-stent restenosis as the cause of MI, coronary artery bypass graft, absence of coronary lesions on the coronary angiogram performed at the time of the MI, previous stenting of the vessel with the culprit lesion, culprit bifurcation lesions with a Medina classification of 1, 1, 1 or culprit ostial lesions. (2) The FCL was identified on the baseline coronary angiograms. Patients with angiograms of insufficient quality to allow accurate QFR analysis were excluded (ie, overlap between vessels, insufficient projection to allow three-dimensional (3D) reconstruction, inadequate contrast filling). Similarly, patients without at least one non-culprit vessel available for QFR analysis were excluded.
Training-test set splitting
The dataset consisted of 200 lesions (83 FCL and 117 NCL). A total of 160 lesions (80%) were used for training with the remaining 40 lesions (20%) being used for testing. For both the angiographic parameter analysis and the DL analysis, the same lesions were used for testing (40 lesions: 9 FCLs=20 patches, 31 NCLs=55 patches). For the DL analysis, the training set (160 lesions: 74 FCLs=183 patches, 86 NCLs=145 patches) was enriched by an additional 225 NCLs for which QCA analysis was not available, thus creating a training/validation set of 385 lesions (74 FCLs=183 patches, 311 NCLs=488 patches) (online supplemental figure 1).
Supplemental material
Calculation of diameter stenosis, area stenosis and QFR
3D-QCA analysis and QFR calculation were performed with validated software (QAngio XA 3D/QFR; Medis, Leiden, The Netherlands) by certified investigators, and a second operator certified to train operators reviewed all the cases. Two angiographic views separated by at least 25°, with no foreshortening or overlapping of the segment of interest, and with adequate contrast-filling end-diastolic images, were selected for 3D-QCA based on automatically delineated detection of the lumen contour with manual correction if needed. The percentage diameter stenosis and area stenosis were calculated. Thereafter, the TIMI frame count was used to compute the contrast-flow QFR (QFR) of a given lesion. This latter analysis is based on a modelled hyperaemic flow velocity allowing QFR evaluation from angiography without pharmacologically induced hyperaemia.
Patch selection
For each patient, 1–4 angiographic frames acquired from different angles during the baseline angiogram were manually selected and the previously defined FCL and NCL annotated by two interventional cardiologists. A total of 374 anonymised and labelled images of 1014×1014 pixels each, were produced. Patches were then created by extracting 224×224 pixels centred around the annotated stenosis region from the raw images, in such a way that only one stenosis was included per patch (figure 1). Patches centred on lesions were chosen for the DL algorithm over whole angiographic frames due to the small dataset. Furthermore, this approach exploited pre-existing knowledge of the coronary anatomy by focusing on regions of the coronary arteries deemed higher risk due to the presence of atherosclerosis. The DL algorithm was thus a means of enhancing pre-existing clinical knowledge.

Examples of patches (on the right) extracted from an annotated CA (on the left). Red and green colour represents culprit and non-culprit lesions, respectively. CA, coronary angiography.
DL framework
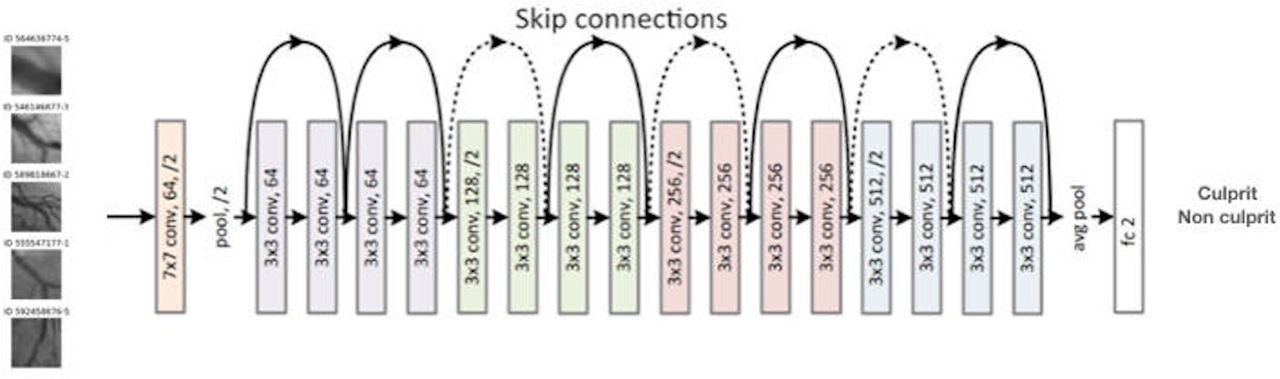
DL was used to classify coronary lesions as either FCL and NCL. Patches were used for the training of a state-of-the-art deep network model called ResNet18.13 A block diagram containing the building blocks of such an architecture is shown in figure 2. Out of all patches, 80% were used for training, 10% for validation and 10% for testing. Importantly, the lesions in the test set corresponded to same lesions in the test set of the angiographic analysis (40 lesions: 9 FCLs=20 patches, 31 NCLs=55 patches). Due to the unbalanced nature of the dataset, data augmentation was subsequently performed on patches in the training set by randomly replicating some of the culprit patches and applying a sequence of transformations from the Albumentations library: (1) Median Blur, (2) Rotation, (3) ShiftScaleRotate and (4) Resize to 224×224. The final model is the result of 10-fold cross-validation on the training and validation set.

Building blocks of the ResNet architecture. The input is processed through 18 stages; many of these stages include connections that transmit the input to a later stage through a skip connection. The final stage is a fully connected layer that provides a classification decision: culprit or non-culprit. The text in each of the block describes its key properties: N × N conv is the kernel size; the next integer is the number of kernels; if present /N describes the spatial subsampling (stride). Figure adapted from Reith and Wandell.24
The network was initialised using a pretrained model from ImageNet,14 one of the largest image databases used in DL and computer vision research. The performance of the network was measured using four evaluation metrics: (1) classification accuracy that measures the performance of correctly predicted classes; (2) sensitivity; (3) specificity and (4) F1 score, which is defined as the harmonic mean of precision and recall.15 The hyperparameters for training the network, that is, the learning rate, and the weight decay, were determined using 10-fold cross-validation on the training and validation set, and were set to 0.0015 and 0.1113, respectively. These hyperparameters were chosen based on the maximum F1 score. With these hyperparameters, we trained a network, by minimising the binary cross entropy loss with a stochastic gradient descent optimiser, using both training and validation data. The batch size was fixed to 20. The test set was used only for the final evaluation of the model. Due to the very limited number of patients, training was performed patch-wise, thus not taking into account the correspondence between different views of the same stenosis. However, a stenosis was classified as FCL or NCL if any one view was classified as FCL.
Human predictions
Two trained interventional cardiologists were shown patches from the test set and asked to make predictions on lesion status (FCL or NCL). Cardiologists were blinded to one another’s predictions as well as the angiography-derived parameters for the lesions. In cases where discordance existed between predictions for a lesion (1 x FCL, 1 x NCL), a third cardiologist provided a prediction and majority voting was used to define an overall human prediction for the lesion. Given that the DL algorithm was trained and tested on data with a similar proportion of FCL, cardiologists were made aware of the approximate proportion of FCL in the test set before giving their predictions.
Endpoints
The coprimary endpoints used for the evaluation of global predictive capacity for future MI were: (1) area under the curve (AUC) and (2) Net Reclassification Index (NRI) of DL compared with angiographic parameters (diameter stenosis, area stenosis, QFR).
The secondary endpoints were the accuracy, sensitivity, specificity, positive predictive value (PPV) and negative predictive value (NPV) of DL as compared with predictions of FCL from humans and those derived from angiographic parameters.
Statistical methods
For each angiographic predictor (diameter stenosis, area stenosis, QFR), a logistic regression model was fitted to data in the training set. The Youden J statistic was used to define the optimal cut-off for the prediction of lesion status. The fitted regression models were used to generate probabilities for culprit status for each lesion in the test set. For each angiographic parameter, the calculated optimal cut-off was used to predict culprit status of each lesion in the test set. For the fitted DL model, a cut-off of 0.5 was used to predict culprit status for each lesion in the test set. Comparisons between the AUC of different models were performed using Delong’s test. NRI was used to quantify if the DL model provided clinically relevant improvements in prediction when compared with each angiographic parameter. Based on the defined cut-off for each model, a confusion matrix was generated and accuracy, sensitivity, specificity, PPV, NPV, along with 95% CIs, were calculated. Statistical analysis was performed with Python V.3.8.4 and R V.4.1.1 (R Foundation for Statistical Computing, Vienna, Austria). A p≤0.05 was defined as statistically significant.
Results
Study population
Details of the study population and its derivation have been previously reported.12 In brief, a total of 6885 patients admitted with MI between 2008 and 2019 were screened, and 775 potentially eligible patients with MI and at least one previous coronary angiogram were selected: 603 patients were excluded on initial screening due to the presence of at least one exclusion criterion. Among the 172 remaining patients, 89 additional patients were excluded in the second selection step due to insufficient quality of angiography images to allow QFR analysis. The final selection comprised 83 patients, corresponding to 200 lesions (83 FCLs and 117 NCLs). In total, 746 patches were used for the DL analysis of which 203 were FCL (27.2%) (online supplemental figure 1).
The mean age of patients was 68.8±12.8 years with the majority being male (72.3%). Hypertension was present in 72.3%, diabetes in 24.1%, while 48.2% of the patients had a history of previous PCI. The clinical presentation was NSTEMI in 63% of cases, and STEMI in the remaining cases. The median time between index angiography and MI was 23 months (IQR 10.3–40.0). The coronary vessels implicated were well balanced and did not differ between FCL and NCL (p=0.503).
Receiver operating characteristic curve analysis (DL performance versus angiographic parameters)
The predictive performance of all models on the test set are shown in figure 3 and table 1. The DL model exhibited the best predictive performance with an AUC of 0.81, which was significantly higher than the AUC for diameter stenosis (0.62, p=0.04) and area stenosis (0.58, p=0.05), and numerically higher than that for QFR (0.67, p=0.13).

ROC curves for performance of the DL model and the models derived from angiographic parameters (diameter stenosis, area stenosis, QFR), with corresponding AUC values. AUC, area under the curve; DL, deep learning; QFR, quantitative flow ratio; ROC, receiver operating characteristic curve.
Performance of each model on the test set according to (1) AUC, (2) Net Reclassification Index (NRI)
NRI (DL performance versus angiographic parameters)
The DL model also demonstrated improved predictive performance as measured by NRI (table 2). Compared with models derived from area stenosis and QFR, the DL model exhibited a significant NRI (area stenosis 0.75, p=0.03; QFR 0.95, p=0.01). DL also exhibited a positive NRI when compared with diameter stenosis, although this did not reach statistical significance (0.60, p=0.10).
Performance of the humans, diameter stenosis, area stenosis, QFR and DL in the prediction of FCL in the test set
DL versus humans and angiographic parameters in the prediction of FCL
Of the 40 lesions in the test set, complete concordance between cardiologist predictions (FCL and NCL status) was present for 30 lesions (75%). For the remaining 10 lesions (25%), a third cardiologist blinded to previous predictions provided the deciding prediction for lesion status.
The accuracies, sensitivities, specificities, PPV and NPV are presented in table 2. Among all models, DL demonstrated the highest accuracy (0.78), followed by QFR (0.70) and area stenosis (0.68). Human predictions along with diameter stenosis exhibited the lowest accuracy (0.58). Even if not always statistically significant, the sensitivity, specificity, PPV and NPV of DL systematically matched or were higher than those for diameter stenosis, area stenosis and QFR (table 2). DL had a sensitivity of 0.67 (vs human 0.56, p=0.56; diameter stenosis 0.67, p=1.00; area stenosis 0.56, p=0.56; QFR 0.33, p=0.08) and a specificity of 0.81 (vs human 0.58, p=0.05; diameter stenosis 0.55, p=0.02; area stenosis 0.61, p=0.06; QFR 0.81, p=1.00). The PPV of DL was 0.50 (vs human 0.28, p=0.07; diameter stenosis 0.30, p=0.05; area stenosis 0.29, p=0.08; QFR 0.33, p=0.28) and the NPV was 0.89 (vs human 0.82, p=0.28; diameter stenosis 0.85, p=0.48; area stenosis 0.83, p=0.31; QFR 0.81, p=0.09).
Discussion
In this feasibility study of the capacity of DL to predict future MI based on ICA images, DL appeared to outperform humans and angiographic parameters (diameter stenosis, area stenosis, QFR) in the prediction of FCLs among patients with non-significant coronary disease with an accuracy of 0.81 and an AUC of 0.78.
Current techniques for the identification of coronary lesions that will be responsible for a future MI remain insufficient. Among patients undergoing ICA, the risk stratification of coronary lesions starts with a simple visual assessment of stenosis severity. Yet, such assessments have been shown to be inaccurate and exhibit a significant degree of interobserver variability,16 a finding confirmed by this study. In order to improve the objectivity of such assessments, QCA permits a more precise estimation of the anatomical severity of coronary lesions.17 However, high-risk coronary lesions often exhibit intermediate or non-significant coronary stenosis,18 and thus measures of the haemodynamic impact of coronary stenoses (eg, FFR) have further advanced the risk stratification of CAD. In FAME 2 (2), FFR was shown to be a better predictor for MI at 2 years as compared with the QCA.3 Yet, FFR has its limitations as a predictor of MI. After 5 years of follow-up, the incidence of MI was 8.4% in the registry group of FAME 2 (patients with coronary stenoses all negative by FFR) as compared with 12% of patients with at least one stenosis significant by FFR treated with optimal medical therapy alone. Even if statistically significant, this absolute difference of only 3.6% highlights the limitations of FFR when used as a dichotomous variable to predict future MI. Of note, FFR considered as a continuous variable has been shown to exhibit a significant correlation with cardiovascular events but this was mainly driven by increased non-urgent revascularisation; its true predictive value for future MI remains unknown.19 Indeed, in a pooled FAME1 and FAME2 analysis where the sum of FFR in the three vessels was calculated,20 there was no difference between groups with regard to the occurrence of future MI.
Identification of vulnerable plaques by intracoronary near-infrared spectroscopy and ultrasound has also been evaluated in the PROSPECT II study.21 The event rate in patients with at least one lesion with high-risk plaque characteristics was 4% after a median follow-up of 3.7 years as compared with 1% in patients without lesions with high-risk plaque characteristics. Here, again, even if statistically significant, this absolute difference of only 3% demonstrates the limitations of this modality in the prediction of future MI.
These data highlight the need for additional tools to improve the identification of patients at high risk of future MI. ML has been shown to improve the prediction of MI based on clinical parameters such as cardiovascular risk factors and biomarker levels.4 22 However, to date, current applications of DL in the interpretation of ICA images have been limited to the automated segmentation of coronary arteries or the identification of significant coronary stenoses.7–10 To the best of our knowledge, this study represents the first reported use of DL for the prediction of future MI based on ICA images only. Although only a feasibility study with a small sample size, these results suggest that DL can be applied effectively to this challenging problem. Further work is required to validate these findings in a larger sample size.
Limitations
There are several limitations inherent in this study. ML models trained with insufficient data can result in poor approximation.23 Thus, the small sample size in this study represents an important limitation that should be kept in mind. In addition, given that the current study population was selected for the incidence of MI following a baseline angiogram without significant CAD, it is a population that is not representative of the patient population encountered in real-world clinical practice. For this small feasibility study, a skewed population with a high number of FCLs was needed for the creation of an effective DL model. However, future studies should ideally be based on a more representative real-world patient population. Additionally, during screening for this study, all patients with ICA images of insufficient quality for the calculation of QFR were excluded. As a result, the DL model was based on ICA images of above average quality. A further limitation of the reported approach was that selection of a single still frame from an ICA cine loop resulted in the loss of information that could have been relevant to the evaluation of the anatomical severity of a stenosis. As a result, future iterations of the DL algorithm should aim to incorporate multiple frames or even the full cine loop. Finally, it should be recognised that, although the features of coronary stenoses on ICA provide insight into the risk of future MI, a purely ICA-based approach to future MI prediction is overly simplistic. Other predictors such as high-risk plaque features not visible on ICA, as well as the clinical context (eg, presence of cardiovascular risk factors), may render an angiographically mild stenosis at higher risk of rupture. Although the goal of this study was to assess the feasibility of a DL-based approach applied to ICA images alone, future work that aims to advance these findings should incorporate such features into the DL model.
Conclusion
In this feasibility study, DL outperformed human visual assessment and established angiographic parameters in the prediction of FCLs. Larger studies are now required to confirm this finding.
Data availability statement
Data are available on reasonable request.
Ethics statements
Patient consent for publication
Ethics approval
Informed consent was obtained from each patient and the study protocol conformed to the ethical guidelines of the 1975 Declaration of Helsinki as reflected in a priori approval by the institution’s human research committee.
References
Supplementary materials
Supplementary Data
This web only file has been produced by the BMJ Publishing Group from an electronic file supplied by the author(s) and has not been edited for content.
Footnotes
TM and DT contributed equally.
Contributors OM and EA were responsible for the conception of the study. MP and DM were responsible for the extraction and preparation of ICA data. TM, DT, OS, OR, OM, EA and SF contributed to the analysis and interpretation of the data. TM, DT, OS and SF drafted the manuscript. SF endorses the role of guarantor and accepts full responsibility for the work and/or the conduct of the study, had access to the data, and controlled the decision to publish. All authors critically reviewed the manuscript and approved the final version for submission.
Funding This research was partially supported by the EPFL Center for Intelligent Systems (CIS).
Competing interests None declared.
Provenance and peer review Not commissioned; externally peer reviewed.
Supplemental material This content has been supplied by the author(s). It has not been vetted by BMJ Publishing Group Limited (BMJ) and may not have been peer-reviewed. Any opinions or recommendations discussed are solely those of the author(s) and are not endorsed by BMJ. BMJ disclaims all liability and responsibility arising from any reliance placed on the content. Where the content includes any translated material, BMJ does not warrant the accuracy and reliability of the translations (including but not limited to local regulations, clinical guidelines, terminology, drug names and drug dosages), and is not responsible for any error and/or omissions arising from translation and adaptation or otherwise.