Article Text

Abstract
Background Prognostic information for asymptomatic patients with aortic stenosis (AS) from prospective studies is scarce and there is no risk score available to assess mortality.
Objectives To develop an easily calculable score, from which clinicians could stratify patients into high and lower risk of mortality, using data from the Simvastatin and Ezetimibe in Aortic Stenosis (SEAS) study.
Method A search for significant prognostic factors (p<0.01) among SEAS patients was made by a combined judgemental and statistical elimination procedure to derive a set of three factors (age, gender and smoking) that were forced into the model, and four additional factors captured by the data: left-ventricular mass index, bilirubin, heart rate and natural logarithm of C reactive protein. Calibration was done by comparing observed with calculated number of deaths by tenths of calculated risk using coefficients from the simvastatin + ezetimibe group on placebo group patients.
Results Discrimination was good with ROC area of 0.76 for all patients. Estimated probabilities of death were categorised into thirds. An optimised split point of estimated 5-year risk was about 15% (close to the upper 14% tertile split point), with risk 4 times as high in the upper compared to the two lower thirds. The SEAS score performed better than another established high risk score developed for other purposes.
Conclusion A new seven factor model for risk stratification of patients with mild to moderate asymptomatic AS identified a high risk group for total mortality with good discrimination properties.
Trial registration number ClinicalTrials.gov, NCT 00092677.
- Simvastatin
- ezetimibe
- prognostic risk score
- mortality
- aortic valve stenosis
- lipid trials
- risk factors
- statistics
- echocardiography
- hypertension
- valvular disease
- aortic valve disease
- mitral regurgitation
- constriction
Statistics from Altmetric.com
- Simvastatin
- ezetimibe
- prognostic risk score
- mortality
- aortic valve stenosis
- lipid trials
- risk factors
- statistics
- echocardiography
- hypertension
- valvular disease
- aortic valve disease
- mitral regurgitation
- constriction
Introduction
Prognostic information is often needed both for individual patient/physician management decisions and as a tool for risk stratification. The latter is important to offer systematic optimal treatment and follow-up of patient groups. Several prognostic scores have been developed for cardiac surgery, such as the EuroSCORE1 with extension,2 the Ambler score3 and the Society of Thoracic Surgeons (STS) score, which were developed to predict cardiac operative mortality.4 The STS score was recently also applied in one study of asymptomatic patients with aortic stenosis (AS) with maximum transvalvular jet velocity (JV) >4.0 m/s to determine long-term prognosis.5 All these scores were developed in patients with symptoms necessitating cardiac surgery. For heart valve surgery the most dedicated score is the Ambler score, yet it is not used outside the UK, and even there it is used infrequently. It consists of 14 variables covering demographics, cardiovascular, surgical and biochemical data; the developmental population all had a JV >4 m/s measured by echocardiography. A risk score for predicting outcome (determined as death or aortic valve replacement (AVR)) during 24 months in asymptomatic patients with severe AS was recently developed in 107 patients, including brain natriuretic peptide (BNP) as a variable.6 In asymptomatic patients with a mild to moderate degree of AS, no prognostic score for either overall outcome or mortality is available. It is therefore unclear whether such patients also could be stratified according to their total mortality and morbidity risk level.
In the Simvastatin and Ezetimibe in Aortic Stenosis (SEAS) trial, randomised patients with a mild to moderate degree of AS (JV between 2.5 and 4.0 m/s) were included if they were free of symptoms and signs of other cardiovascular diseases or comorbidities constituting an indication for lipid-lowering therapy, and diabetes, allowing inclusion of patients with hypertension.7 8 Based on SEAS data we wanted to develop a risk score for total mortality to allow calculation of 5-year mortality probabilities for individual patients and propose a stratification of risk, which could be used for more targeted follow-up and treatment approaches in these patients.
Methods
The SEAS study design and main outcome have been published previously.7 8 In short, inclusion criteria were men and women (45–85 years), with asymptomatic mild-to-moderate AS, defined as Doppler measured JV ≥2.5 m/s and ≤4.0 m/s, and normal left-ventricular systolic function at baseline. Patients with known coronary, cerebral or peripheral arterial disease, or patients taking or deemed to require lipid-lowering therapy to reduce atherosclerotic cardiovascular risk were excluded from participation as were patients with diabetes or other uncontrolled endocrine, metabolic or active liver disease as well as moderate or severe renal failure. Patients with hypertension were included.
Patients were randomised to receive either combined simvastatin (40 mg) and ezetimibe (10 mg) (S+EZ) or matching placebo. The mean study duration was 4.8 years and all surviving patients were by protocol followed for at least 4 years. The SEAS study was approved by regional ethics committees in all participating countries, and all patients gave their written informed consent.
Echocardiography was assessed at baseline and yearly and before valve surgery; however, only baseline was evaluated in the current prognostic study. The SEAS Echocardiography Core Laboratory (Haukeland University Hospital, Bergen, Norway) performed all echocardiographic measurements according to a standardised performance protocol previously published,7 9 and only core laboratory read values were used in the study analyses. Baseline JV measurements were obtained in 1763 of the 1873 randomised patients, due to missing values in 110 patients.
Biochemical variables measured at baseline (see list in online appendix) were also used to establish prognostic indexes; so this prognostic study included 1534 patients from the SEAS population with a complete set of data for potential risk predictors. Of these, 154 died during follow-up, 78 in the S+EZ and 76 in the placebo group. Total mortality information was used as the critical endpoint in these analyses, although cardiovascular and sudden deaths were also evaluated. Additional analyses were performed for the combined outcome death or AVR.
Statistical methods
Prognostic variables were displayed by descriptive statistics. To establish a SEAS total mortality prognostic model a search for potential predictors was done in several steps. First, age, gender and current smoking were selected as variables to be forced into any prognostic index equation, named adjustment variables. Within each category of biochemical, echocardiography derived and haemodynamic variables, certain ones were selected as candidates for backward stepwise Cox regression analysis. Among echocardiographic variables, these were left-ventricular ejection fraction (Teichholz), aortic valve area index and left ventricular mass index. Only total cholesterol, bilirubin and natural logarithm of C reactive protein (LnCRP) were candidates among the biochemical variables, and heart rate and hypertension among the haemodynamic variables. More detailed descriptions on how variables were selected are given in the online statistical appendix. After backward selection, the factors which indicated good prognostic value in addition to the three adjustment factors were left ventricular mass index (LVMI), bilirubin, heart rate and LnCRP (all p<0.01). Finally, when these seven variables were included, each of the other candidate variables was added one at a time to see whether some had independent additive prognostic value to the seven included, but none did. Separate prognostic index estimates based on these seven variables were fitted by Cox regression within each treatment group and the regression coefficients for each variable were tested for difference by Z-tests. No interaction between the seven factors and treatment on mortality was detected. The proportionality assumption of the Cox models was also checked per treatment group by time variant Cox analysis, but did not show any significant product term between risk factor and follow-up time.
An additional model building process was also performed for the combined endpoint time to death or first AVR, since these are two important clinical consequences of AS development. Both mean and maximum transaortic gradient were associated much more strongly to this endpoint than any other variable. Thus, mean transaortic gradient was forced into the regression equation together with the adjustment factors, since it was more closely associated to the outcome than the maximum gradient. After backward stepwise Cox regression analysis (using the best among highly correlated variables), only aortic valve area index, heart rate and country of study population remained as significant predictors (all p<0.01) in addition to the four factors already included. However, since country was not a biologically meaningful factor, it was deleted with negligible impact on receiver operating characteristics (ROC) area.
The original Cox method10 of calibration was used to fit a univariate logistic regression model with total mortality (yes/no) as dependent variable on the prognostic index in one treatment group to the patients in the other. In case of good calibration the slope of the regression should be 1.0. Values lower than 1.0 would indicate overestimation and vice versa. We also performed calibration by estimating individual 5-year probabilities of death with coefficients from one group to the patients in the other and rank ordered each set into deciles. Expected number of deaths calculated as the sum of the individual probabilities of death within each decile was then compared to the observed number of deaths, and graphs showing scatter plots for each treatment group were developed. Hosmer–Lemeshow tests11 were used to compare observed and expected deaths and survivors.
ROC calculations were used to illustrate the ability of the model to distinguish deceased from surviving patients. Absolute differences in ROC area are difficult to judge, but if the area improves by more than 4–5% (above 0.02 area units) when adding an extra factor in the prediction equation, one may regard this as a minimum requirement to be clinically important. The accuracy of individual probability estimates of death was calculated by the Brier score,12 which is the average error of prediction. Its value ranges between 0 and 0.25, with 0 as perfect estimations and 0.25 as non-informative.
We calculated an adapted Ambler score3 used for risk evaluation after aortic valve surgery. We used the logistic regression coefficients directly to build the prognostic index score instead of the point score model. This score had a number of variables set to 0 with SEAS data, since patients in the developmental population had high risk with possible symptoms and JV >4.0 m/s. Comparisons of discrimination ability was done by ROC areas. In addition, the SEAS and Ambler scores were categorised into tertiles and mortality was compared according to level of estimated risk. All statistical analyses were run by SPSS V.15.0.
Results
Descriptive statistics for the seven selected prognostic factors are displayed by status of mortality and treatment group in table 1. Deceased and surviving patients had, as expected, different mean levels of these factors. Otherwise, differences between treatment groups were generally small. The multivariate associations between the factors and mortality are given for all patients and by treatment group in table 2, together with statistical information. Age was by far the strongest predictor in all groups. Women had a significantly lower mortality risk than men in this population. None of the HRs differed significantly between the two treatment groups. Significant associations were not found for smoking, LVMI and heart rate in the S+EZ group, but these were significant in the placebo group. By contrast, LnCRP was significant in the S+EZ group, but not among controls. Over and above the three adjustment factors, the four additional factors had, in all patients, an about equal strength of association in relative terms. The prediction equation using the regression coefficients from the S+EZ group is given by the centralised prognostic index (CPI) and the probability of death (P). CPI=(age−67.4)*0.078−(female gender−0.36)*0.286+(smoking−0.184)*0.184+(LVMI−101.7)*0.0054+(bilirubin−1.7)*0.037+(heart rate−68.2)*0.016+(LnCRP−(−1.5))*0.293. P=1−(0.904)Exp(CPI), where Exp is exponential function. Table 3 shows the patient distribution of estimated mortality probabilities per treatment group and in total. Distributions are partitioned by deciles. About 80% of patients within each group had 10% or lower estimated mortality risk during the trial. Those in the upper 10% of estimated risk had estimated probabilities from about 20% and above. The Brier score at about 0.095 was at a medium level, slightly lower in the placebo than in the S+EZ group (table 4). A Brier score was also calculated within each treatment group when the coefficients from the opposite treatment group were used to calculate individual survival probabilities. A somewhat improved accuracy occurred in the placebo group, and the opposite in the S+EZ group.
Prognostic variables (mean (SD) or percentage) by mortality and treatment group
Associations (HR per SD) between all cause mortality and each prognostic factor, in total and by treatment group
Deciles for probability of death estimates from prognostic model by treatment group and in total
ROC area and prognostic accuracy for different prognostic models, by treatment group
Tests of interaction on the relative risk scale between the seven factors and mortality were performed with both groups combined, as well as between treatment group and the factors. Only one, between bilirubin and age, was significant (p=0.007), but it only increased ROC area from 0.756 to 0.758 and was therefore ignored.
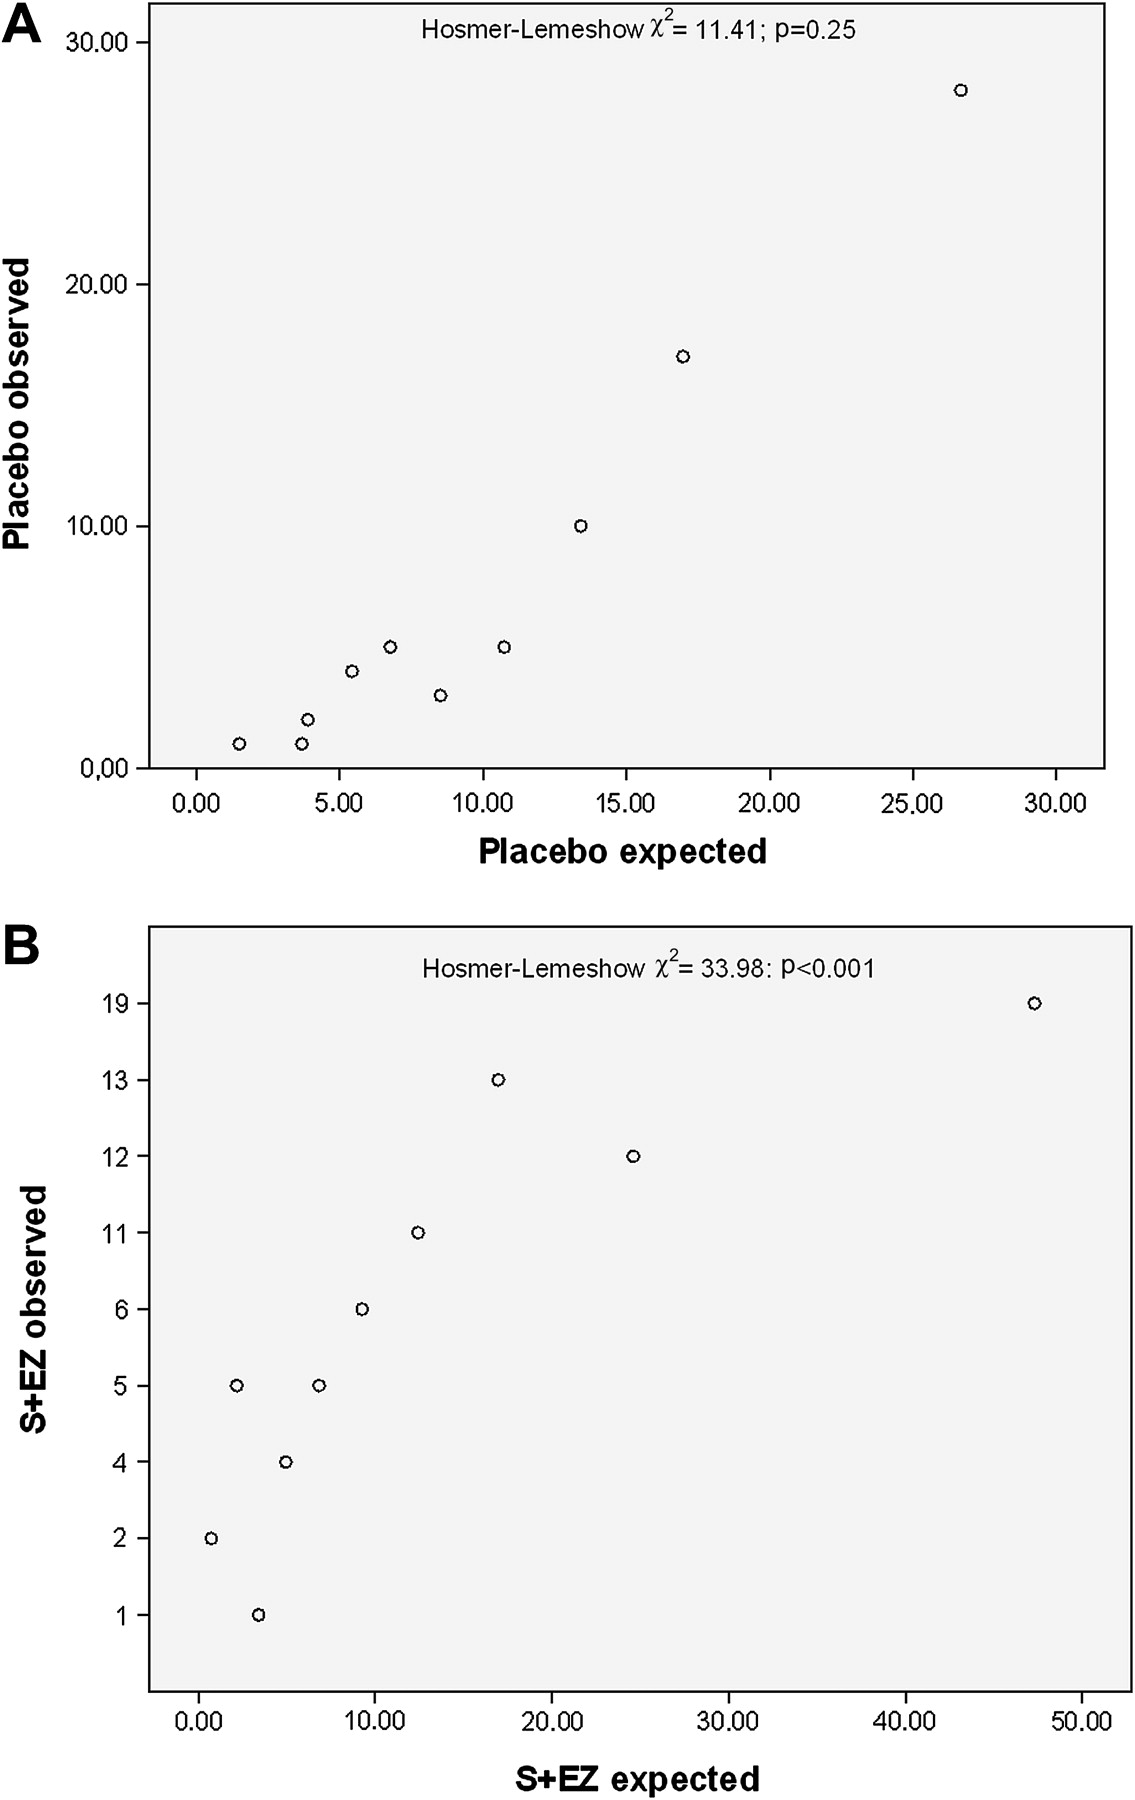
Within each treatment group the calibration slopes were fairly close to the ideal value of 1.0. However, when coefficients from the other treatment group were used, a clear overestimation of mortality risk by the model was seen in the S+EZ group, while the opposite, though to a lesser degree, was seen in the placebo group. Individual probability estimates of death in the placebo group were categorised into deciles. Figure 1A shows observed versus estimated number of deaths in the placebo group. Except for random variation, the slope was close to 1.0 and the Hosmer–Lemeshow χ2 test for deviances between observed and predicted number of deaths and survivors showed no overall significance. This was in contrast to the results in the S+EZ group, where there was a gross overestimation of mortality in the two upper deciles of risk (figure 1B).

(A) Scatter plot based on deciles of calculated (estimated) number of deaths within 5 years and number of observed deaths in the placebo group. Deviations between observed and expected deaths were tested by the Hosmer–Lemeshow test. (B) Scatter plot based on deciles of calculated (estimated) number of deaths within 5 years and number of observed deaths in the simvastatin+ezetimibe group. Deviations between observed and expected deaths were tested by the Hosmer–Lemeshow test.
Furthermore, for discrimination purposes the placebo group came out the best, but the ROC areas between the two treatment groups were not statistically significant (table 4). For all patients combined, ROC=0.756 (0.716–0.796), indicating a good discrimination ability (ROC=0.722 (0.663–0.781) in S+EZ and ROC=0.793 (0.740–0.846) in the placebo group). Age alone contributed, with ROC=0.704 (0.662–0.747), and by adding the two other adjustment factors the area was raised to ROC=0.724 (0.683–0.765). Adding the four other factors thus contributed jointly to a further increase in the ROC area. Removing each of the four factors one at a time gave relatively small changes in ROC areas. We also calculated the ROC area in each treatment group when the coefficients (prognostic scores) from the other were used. In the placebo group, ROC=0.781 (0.727–0.834) whereas ROC=0.711 (0.653–0.770) in the S+EZ group, which was only slightly lower than the areas found when scores from the same group were used.
A comparison with the Ambler heart valve surgery population score was done in the SEAS placebo group when coefficients estimated from the S+EZ group were used.
Discrimination was poorer using the adjusted Ambler score displayed by ROC curves in figure 2. Each of the Ambler and SEAS scores was divided into thirds; table 5 shows number (%) of deaths by this grouping for each of them. In both cases the upper third showed a non-linearly strong increase in risk compared to the two lower thirds; the mortality risk in the SEAS upper third was 22% during 5 years. The yearly risk in this group was then about 4%, and about four times as high as in the two lower thirds. In the SEAS placebo group the proportion of deaths due to cardiovascular disease was 32/76 (42%) in total, whereas the number of cardiovascular deaths was 35/56 (62%) in the upper third, 6/14 (43%) in the middle and 3/6 (50%) in the lower third. The total number of sudden cardiovascular deaths was 11/56 (20%). The tertile split points in SEAS were 7% and 14%, and a mortality risk in a patient above 14% during 5 years definitely constitutes a high risk group. If sensitivity was multiplied by specificity, the maximum product was obtained when the risk was in the range of 14–15%, by coincidence equal to the upper tertile of estimated risk. A reasonable choice of 5-year risk stratification should therefore be below and above 15 %. There was a strong association between JV and the calculated risk by tertiles of death+AVR. Mean JV (SD) were 2.63 (0.019), 3.03 (0.020) and 3.63 (0.023); p<0.001 for test of trend in the three strata, indicating a strong association between AS and estimated risk of death+AVR. For total mortality a similar association was not found. We investigated further as to whether this risk stratification had any association with subsequent occurrence of AVR without deaths (treated as censored cases). There were 37 (14.6 %), 69 (23.9 %) and 148 (51.4 %) cases of AVR only in the three thirds of estimated probability (from coefficients in the simvastatin group) of AVR or death in the placebo group (p<0.001). However, the placebo group similarly estimated probability for total mortality categorised into thirds did not associate with AVR only (data not given).

ROC curves of total mortality during 5 years comparing SEAS risk score in the placebo group based on regression coefficients from the simvastatin+ezetimibe group (area=0.78, SEAS) with the Ambler score (area=0.68, Ambler).
Comparison of external scores with that of SEAS by thirds of calculated mortality risk in placebo group patients*
Table 6 shows regression coefficients for the predictors within each treatment group and total for death or AVR as endpoint. There were 314 and 322 events in the S+EZ and placebo groups, respectively. Coefficients were not significantly different between treatment groups. Mean transaortic gradient was a strong associate, whereas the others were less. ROC area was 0.778 (0.747–0.810) in the S+EZ group compared to 0.749 (0.715–0.783) in the placebo group when fully adjusted for the other predictors (not significantly different). However, when mean transaortic gradient was used as a single predictor, the areas became 0.744 (0.710–0.777) and 0.727 (0.692–0.762), respectively. Thus, the other six factors added relatively small amounts to the ROC area. The slight negative association to smoking in the S+EZ group is probably due to some confounding since the univariate association between smoking and death+AVR is HR=1.08 (0.82 to 1.42). If the regression coefficients from the S+EZ group were used to calculate probability of death or AVR in placebo group patients (with underlying 5-year probability of death or AVR=0.383), the ROC area was 0.726 (0.691–0.762). The outcome was more than three times as high in the upper third of calculated risk as compared to the lower (60.8% vs 19.1%). Formula for score and probability calculation for this outcome become: CPI=(age−67.2)*0.0075−(female gender−0.38)*0.202−(smoking−0.182)*0.069+ (MTG−22.95)*0.0702−(AVAI−0.668)*1.18+(heart rate−68)*0.013; and P=(0.617)Exp (CPI), where MTG is mean transaortic gradient, and AVAI is aortic valve area index. A worked example is also given in the online statistical appendix.
Associations (HR per SD) between all deaths or AVR and each prognostic factor, derived by backward stepwise Cox regression analysis, in total and by treatment group
Discussion
This is the first study aiming at prediction of mortality in prospectively followed asymptomatic patients with mild to moderate aortic stenosis. The study showed that seven risk factors determined at baseline can discriminate reasonably well between deceased and surviving patients during 5 years of follow-up. The regression coefficients from the S+EZ group were found to give satisfactory predictions of deaths in the placebo group and were therefore preferred as a basis for the prognostic index and mortality calculations in SEAS patients.
Patients with mild to moderate AS without clinical evidence of coronary artery disease are thought to have a good prognosis, and current AHA guidelines13 recommend echocardiographic follow-up every 1–2 years for moderate AS and every 3–5 years for mild AS. Our study shows that among these patients, defined by a transvalvular jet velocity of 2.5–4.0 m/s, there is a subgroup, which can be identified by the proposed score with a markedly impaired prognosis and a ≥15% 5-year mortality rate. These results indicate that patients with an estimated risk level above that should be more closely monitored than suggested by the AHA guidelines13 and have further evaluations such as determinations of LV mass, inappropriate LV mass (defined as measured LV mass exceeding the expected value by more than 10%, predicted from height, sex and stroke work), which was found to be common in 209 asymptomatic patients with severe AS, and was associated with an increased rate of cardiovascular events,14 and exercise testing.15 These additional examinations might further identify patients in whom criteria for early surgery may be present (eg, development of symptoms during exercise or a fall in blood pressure during exercise, a class I or IIa indication for surgery according to ESC guidelines,16 although admittedly there are no randomised studies available demonstrating that surgery in these indications improves prognosis).17
The Ambler score was developed for patients with severe symptomatic AS, requiring valve replacement. Also in SEAS, valve replacements during 5 years were performed in 30% of the patients in the placebo group and in 28% in the S+EZ group. However, such information could not be used for risk stratification since the procedures occurred after baseline assessments. The 10-year performance of the STS score was investigated by Torneau et al,5 irrespective of management strategy; it was shown to be highly predictive. When applying the same seven factors to cardiovascular disease death as endpoint in the placebo group, the four factors age, LVMI, bilirubin and heart rate came out strongly significant based on 44 cardiovascular deaths (all p≤0.001), and the ROC area was 0.800 (0.728–0.870), indicating a clear dominance of risk factors of deaths due to cardiovascular disease in the predictions.
There are many scores available to investigate prognosis at time of cardiac and aortic valve surgery. However, patients with AS and JV <4.0 m/s may have been followed for many years before the aortic valve needs replacement. Although there are studies reporting on the prognosis of patients with asymptomatic, mostly severe AS,18–20 we were not able to find any risk score developed for outcome or mortality prediction in a SEAS type of population or any group of patients with AS, except for the outcome score developed by Monin et al.6 Outcome in their study was assessed by death or AVR at 24 months. There were only 3 deaths and 58 patients with AVR in the derivation group. Independent predictors of outcome were female sex, peak aortic JV, and B-type natriuretic peptide at baseline (available only in a sub sample (n=640) in SEAS). Since patients with concomitant cardiovascular diseases and diabetes were excluded from the SEAS study, such a subset of patients with aortic stenosis and JV <4.0 m/s is supposedly at low risk, requiring, according to the AHA guidelines,20 regular echocardiographic evaluation of progression rate and degree of valve calcification every 1–2 years for moderate AS and every 3–5 years for mild AS (class I B recommendation), whereby specified recommendations for time-intervals of follow-up according to the ESC guidelines have been expressed for patients with JV >4.0 m/s.13 However, as demonstrated, even within the SEAS type of patients, at least one third is definitely a high-risk group, with about a 4% chance of death per year. The remaining groups have a risk of <1%. With a total mortality risk of about 2% per year in SEAS, this kind of population is at higher risk than the general population, which for a 69-year-old person (average age during follow-up) has a yearly mortality rate, gender adjusted to the 38/62% female/male split of SEAS, from Norwegian 2009 mortality statistics of about 1.35%. Also by this comparison it seems that the lower thirds of estimated risk include persons with no need for close follow-up, whereas those in the upper third are clearly at risk and require more intense medical attention (closer follow-up intervals and additional evaluations, such as exercise testing).13
Our model fit was only good when S+EZ group coefficients were applied to the placebo group patients. Placebo group coefficients could not be used for probability estimations in the S+EZ group, especially not in the high risk region, where it is most useful. Since age is such a dominant factor, an overfitted regression coefficient could easily boost up estimations of mortality. Since both the age and smoking coefficients were clearly nominally higher in the placebo than in the S+EZ group, that could partly explain the poor fit in S+EZ patients.
A clinically important endpoint is the combined death or AVR. Using this combined endpoint the mean transaortic gradient was by far the dominating prognostic factor in both treatment groups. A natural reason for this is that this variable is used for monitoring development of AS and as part of the decision process when AVR should be performed. High prediction ability is therefore to be expected with such an administratively decided endpoint.
In contrast, mean transaortic gradient was not a prognostic factor, with death as the only endpoint. Since mortality included all causes of death, patients with mild to moderate aortic stenosis may not have died due to the aortic stenosis, but from previously undetected coronary or other cardiovascular diseases. Furthermore, the spectrum of gradients included in SEAS at baseline was relatively narrow at 2.5–4.0 m/s. Outcome as a combined endpoint of death or AVR has also been investigated in a much smaller study,6 including 107 asymptomatic patients with a mean JV of 4.1 m/s (3.5–4.4).
The factors selected for the risk score were mostly as expected from previous score constructions in higher risk valve surgery patients, with three clear exceptions: heart rate, bilirubin and LnCRP, where bilirubin was the most unexpected. Recent studies have shown that bilirubin may serve as a physiological antioxidant, providing protection against cardiovascular disease. It may inhibit lipid oxidation and oxygen radical formation,21 and even the UGT1A1 gene has been found as major for anti-atherogenic serum bilirubin levels.22 However, in SEAS the association to death was positive and did not indicate any protection. High heart rate has been found in many epidemiological studies to influence prognosis,23 24 but may rather be a marker of other processes going on undetected by the screening examinations in SEAS, such as subclinical impaired cardiac function. Heart rate did not correlate with any gradient or JV (all r<0.05), so it is probably not due to residual confounding. CRP is a factor known to be predictive of cardiovascular disease in general and in cardiac populations, since inflammation is often associated with arterial plaque formation and development.25
None of the yearly repeated measurements of echo variables were used to establish rate of progression as risk markers. However, that would have restricted statistical power by including only surviving patients after year 1, 2 etc. Exploratory subanalyses showed that a 1-year change in mean transaortic gradient (best fitted echo variable) added ROC from 0.771 to 0.777 in the placebo group, based on 119 deaths. Similarly, for a 2-year change in the gradient from baseline, only 92 deaths occurred, with an increase in ROC from 0.777 to 0.792. Regression coefficients for the gradient were 0.026 (95% CI 0.012 to 0.040) in the 1-year progression and 0.023 (95% CI 0.009 to 0.037) in the 2-year progression analysis. Thus, rate of progression predictive variables were highly significantly associated to event rates but did not add much prognostic information to the seven variables already included. Both Otto et al and Rosenhek et al have, in smaller studies, confirmed that a high rate of progression associates with higher event rates than those without21 22 (events included death and AVR).
Usefulness of non-preselected variables
Over and above the three adjustment factors, a greater extra discrimination value was not obtained by adding the four extra predictors. Jointly they added 0.033 area units, which are within clear limits. The total ROC area was high and the Brier score was <0.10, so it seems that the model has a good discrimination property. To obtain the proposed SEAS risk score, the clinical evaluation would have to be slightly extended since biochemistry variables such as bilirubin and CRP are usually not determined routinely in addition to the echocardiographic data. However, such variables are of low cost and easy to be determined in a specialised clinic or a cardiologist office, and, as shown in the online statistical appendix, calculations of individual 5-year probabilities of death are easy to make by the programmed Excel spreadsheet.
Limitations
Since patients should initially be asymptomatic, only a very limited number of AS patients with JV >4.0 m/s were included, so these results are only valid for patients with JV <4.0 m/s. The set of echographic variables was limited to the routinely obtained parameters and did not include other parameters of LV geometry and function such as relative wall thickness and LV midwall or longitudinal shortening. BNP was not performed as a basic routine test in SEAS. However, in the protocol it was outlined as a separate research question. In the framework of this separate research topic it has been determined in only about a third of the patients. Including these would have led to a major loss of statistical power. Total mortality in this cohort was still low, and since model fit was not good in simvastatin+ezetimibe patients, only 76 deaths were available to estimate the SEAS risk function in the placebo group. Validations of the model were mainly done by crossover between the two treatment groups, and no similar population as in SEAS could be found for more external validation purposes. There is still a need for validation of the SEAS model in other asymptomatic AS populations with low to moderate risk.
Conclusion
A new seven factor model for risk stratification of asymptomatic patients with a mild to moderate degree of AS, without clinically manifest coronary heart disease, identified a high risk group for 5-year mortality with good discrimination properties.
References
Supplementary materials
Supplementary Data
This web only file has been produced by the BMJ Publishing Group from an electronic file supplied by the author(s) and has not been edited for content.
Files in this Data Supplement:
- Data Supplement - Manuscript file of format pdf
Supplementary Data
This web only file has been produced by the BMJ Publishing Group from an electronic file supplied by the author(s) and has not been edited for content.
Files in this Data Supplement:
- Data Supplement - Manuscript file of format pdf
- Data Supplement - Manuscript file of format pdf
Supplementary Data
This web only file has been produced by the BMJ Publishing Group from an electronic file supplied by the author(s) and has not been edited for content.
Files in this Data Supplement:
- Data Supplement - Manuscript file of format pdf
Footnotes
Funding EG, KB, ABR and YAK received research support from Merck/Schering-Plough Pharmaceuticals, Inc., North Wales, Pennsylvania, USA.
Competing interests IH, KB, KE, EG, CG-B, YAK, TRP, SR, ABR, KW and RW have received honoraria from Merck/Schering-Plough Pharmaceuticals, Inc., North Wales, Pennsylvania, USA, the funding sponsor of the SEAS study. IH, TRP and RW received honoraria from AstraZeneca, Inc., Wilmington, Delaware, USA and Pfizer Inc., New York, NY, USA. YAK received honoraria from Sanofi-Aventis, Paris, France, and AstraZeneca, Inc., Wilmington, Delaware, USA. WM is an employee of Merck/Schering-Plough Pharmaceuticals, Inc., and owns stock and/or stock options in the company.
Patient consent Obtained.
Ethics approval The study was approved by all regional ethics committees and all patients gave their written informed consent.
Provenance and peer review Not commissioned; externally peer reviewed.