Article Text

Abstract
Sudden cardiac death (SCD) is a major health burden and is primarily caused by ventricular arrhythmias. Currently, the most well-known marker for the risk of ventricular arrhythmias is QT/QTc prolongation. Animal studies indicate that QT variability might be a better indicator. Our objective was to give an overview of the literature on QT variability in humans, therefore we performed a free-text search in PubMed and Embase from inception through February 2013. We identified nine QT variability markers in 109 studies reporting on QT variability markers, measured on the surface ECG. QT variability can be distinguished using two characteristics: heart rate normalisation and whether QT interval is measured on consecutive beats. Most study populations were small (median 48 subjects, range 1–805) and different methods, time intervals and leads for measurement were used. QT variability markers were determinants for the risk of ventricular arrhythmias, (sudden) cardiac death and total mortality. Few studies compared the predictive value of QT variability with that of QT/QTc prolongation. A study comparing all different QT variability markers is lacking. In conclusion, QT variability markers are potential determinants of ventricular arrhythmias and cardiac mortality. However, it is unclear which marker and methodology are clinically most useful as well as what reference values are reliable. More studies on larger datasets are needed to find the most accurate marker for the prediction of arrhythmias and SCD to assess its value in addition to QT/QTc duration and its role in drug-induced arrhythmia and sudden death.
- Arrhythmias
Statistics from Altmetric.com
Introduction
Sudden cardiac death (SCD) is a common lethal manifestation of heart disease.1 ,2 It is primarily caused by ventricular arrhythmias such as ventricular fibrillation (VF), ventricular tachycardia (VT) and torsade de pointes.3 ,4 Risk factors include drug and alcohol use, history of heart failure or cardiac ischaemia, and certain syndromes with ECG abnormalities, for example, long QT syndrome (LQTS) and Brugada syndrome.5 ,6 Although specific groups with these risk factors have a high risk of SCD, 50% of all SCDs due to coronary heart disease occur as a first event of this condition or in patients thought to be at low risk.7 Risk assessment has two main clinical applications: drug safety testing and risk stratification for SCD.
In clinical drug safety studies, the applied method for predicting the arrhythmogenic potential is prolongation of the heart rate corrected QT (QTc) interval on the ECG.8 ,9 However, studies have shown that some QTc prolonging drugs do not increase the incidence of ventricular arrhythmias,10 ,11 while some drugs that do carry an arrhythmogenic risk do not always show QTc prolongation.12 Through animal studies an increased QT interval variability has been proposed as a less equivocal method for the prediction of arrhythmogenic effects.13–23
Another application of QT variability is risk stratification for implantable cardioverter-defibrillators (ICD). Berger et al24 hypothesised that cardiac abnormalities lead to changes in ventricular repolarisation. However, these changes will not necessarily lead to arrhythmias, but will lower the repolarisation reserve.25 ,26 Repolarisation reserve is the concept that the complexity of the repolarisation includes some redundancy.26 QT variability is thought to be a measure of decreased repolarisation reserve and therefore of the risk for arrhythmias.25
In high-risk patients, antiarrhythmic therapy is administered using ICD.W1–W3 Although ICD therapy reduces mortality due to SCD, it has a high cost-effectiveness ratio,W4–W6 (inappropriate) shocks can lower quality of lifeW7 and are related to adverse outcomes.W8 Therefore, improved risk stratification for ICD therapy is necessary.
The objective of this review is to provide an overview of the literature regarding short-term QT variability.
Methods
A PubMed and Embase search from inception until 4 February 2013 was performed. Because no MeSH terms exist for QT variability, we used the following free-text keywords: QTVI, QTV index, QT variability index, QT variability, QT interval variability, short-term variability. This is the description of our search terms, so abbreviations are not needed, beat-to-beat variability, STV, BVR, temporal variability, QT, repolarisation, monophasic action potential duration or monophasic action potential duration (MAPD). We excluded papers with the term ‘quantitative tissue velocity imaging’, a term not related to our topic but also abbreviated QTVI. We limited the search to papers in English. In online supplement 1, the exact search strategy is outlined. We hand-searched citation lists of all studies for publications not captured by our electronic search. Results were stored in an EndNote X5 (V.5.0.1, Thomson Reuters, USA) database.
Study selection was performed in two stages. Primary physiological or clinical studies measuring QT variability on the surface ECG were candidates for inclusion. First, publications were independently assessed on title and abstract by two reviewers (MNN, MEvdB). Second, the two reviewers independently assessed the full text manuscripts. When full text publications could not be retrieved online, we contacted the authors.
QT variability can be distinguished into short- and long-term. Currently, the most frequently studied QT variability markers have been measured on signal windows of 256 s24 or 30 beats.23 Long-term variability has been measured over periods of up to 24 h.W9 We limited this review to short-term variability, and applied a maximum time window of 10 min or 600 beats. Disagreements between reviewers were resolved in consensus meetings. For each included publication all relevant information was extracted. This review was conducted according to the PRISMA guideline.27 Additional references can be found in online supplement 2 and are indicated in the text with the letter W.
Results
Search results
We retrieved 297 unique publications from the electronic search and included 109 publications after full text review. These studies included 58 case-control studies, 23 cross-sectional studies, 15 clinical trials, 12 cohort studies and one case report. The selection process and reasons for exclusion are shown in figure 1. In online supplement 3, a full overview of all included studies is shown. We could not retrieve the full text of nine publications: one review,W10 one conference paper,W11 one comment,W12 one clinical trial with nadolol and metoprolol,W13 two studies of postcoronary artery bypass graft patientsW14 W15 and case-control studies of patients with diabetes,W16 non-alcoholic liver cirrhosis,W17 and congestive heart failure.W18

Overview of selection process.
General findings
Nine QT variability markers were identified: QT variance (QTvar), QT variance normalised for mean QT interval (QTVN), SD of the QT intervals (SDqt), median absolute difference of QT intervals (MADqt), STV of the QT interval (STVqt), root mean square of the successive QT interval differences (RMSSDqt), QT variability index (QTVI), MADqtc/median absolute difference of RR intervals (MADrr) and QTRR (table 1). QT variability measures can be grouped based on the combination of two characteristics. The first is whether or not the variability is derived from measurements on consecutive beats. When measured on consecutive beats, the differences in QT interval between the first and second beat, the second and third beat, and so on are the basis for the variability measure (consecutive QT variability). Alternatively, beat order is not taken into account and QT intervals of all beats in a certain time window are used to calculate variability (non-consecutive QT variability). This distinction may have important consequences for the result. Figure 2 shows two different hypothetical patterns of four QT intervals. In the case of non-consecutive QT variability measures, the variability in patterns 1 and 2 is equal because the order is irrelevant. Consecutive QT variability measures will be larger in pattern 1 than in pattern 2.
Overview of markers and studies included

Effect of QT interval patterns on QT variability measures. Two hypothetical ECG patterns consisting of four beats are shown. The duration of QT intervals are identical in patterns 1 and 2, but their order is different. In case of non-consecutive QT variability measures, for example, the SD, there is no difference between patterns 1 and 2 because the order of beats is irrelevant. Consecutive QT variability, for example, short-term variability, will be larger in pattern 1 than in pattern 2.
The second characteristic to classify the different measures is whether QT variability is normalised for heart rate (variability) (QTn). It is well known that the QT interval duration is influenced by the duration of the RR interval; therefore, in clinical practice it is common to apply a heart rate correction method. Through the same mechanism, it could also be important whether or not QT variability is normalised for heart rate (variability). However, heart rate correction methods for QT interval have limitations, for example, an overestimation of the QTc interval at higher heart rates when using Bazett's formula. Similar problems could arise with QT variability.
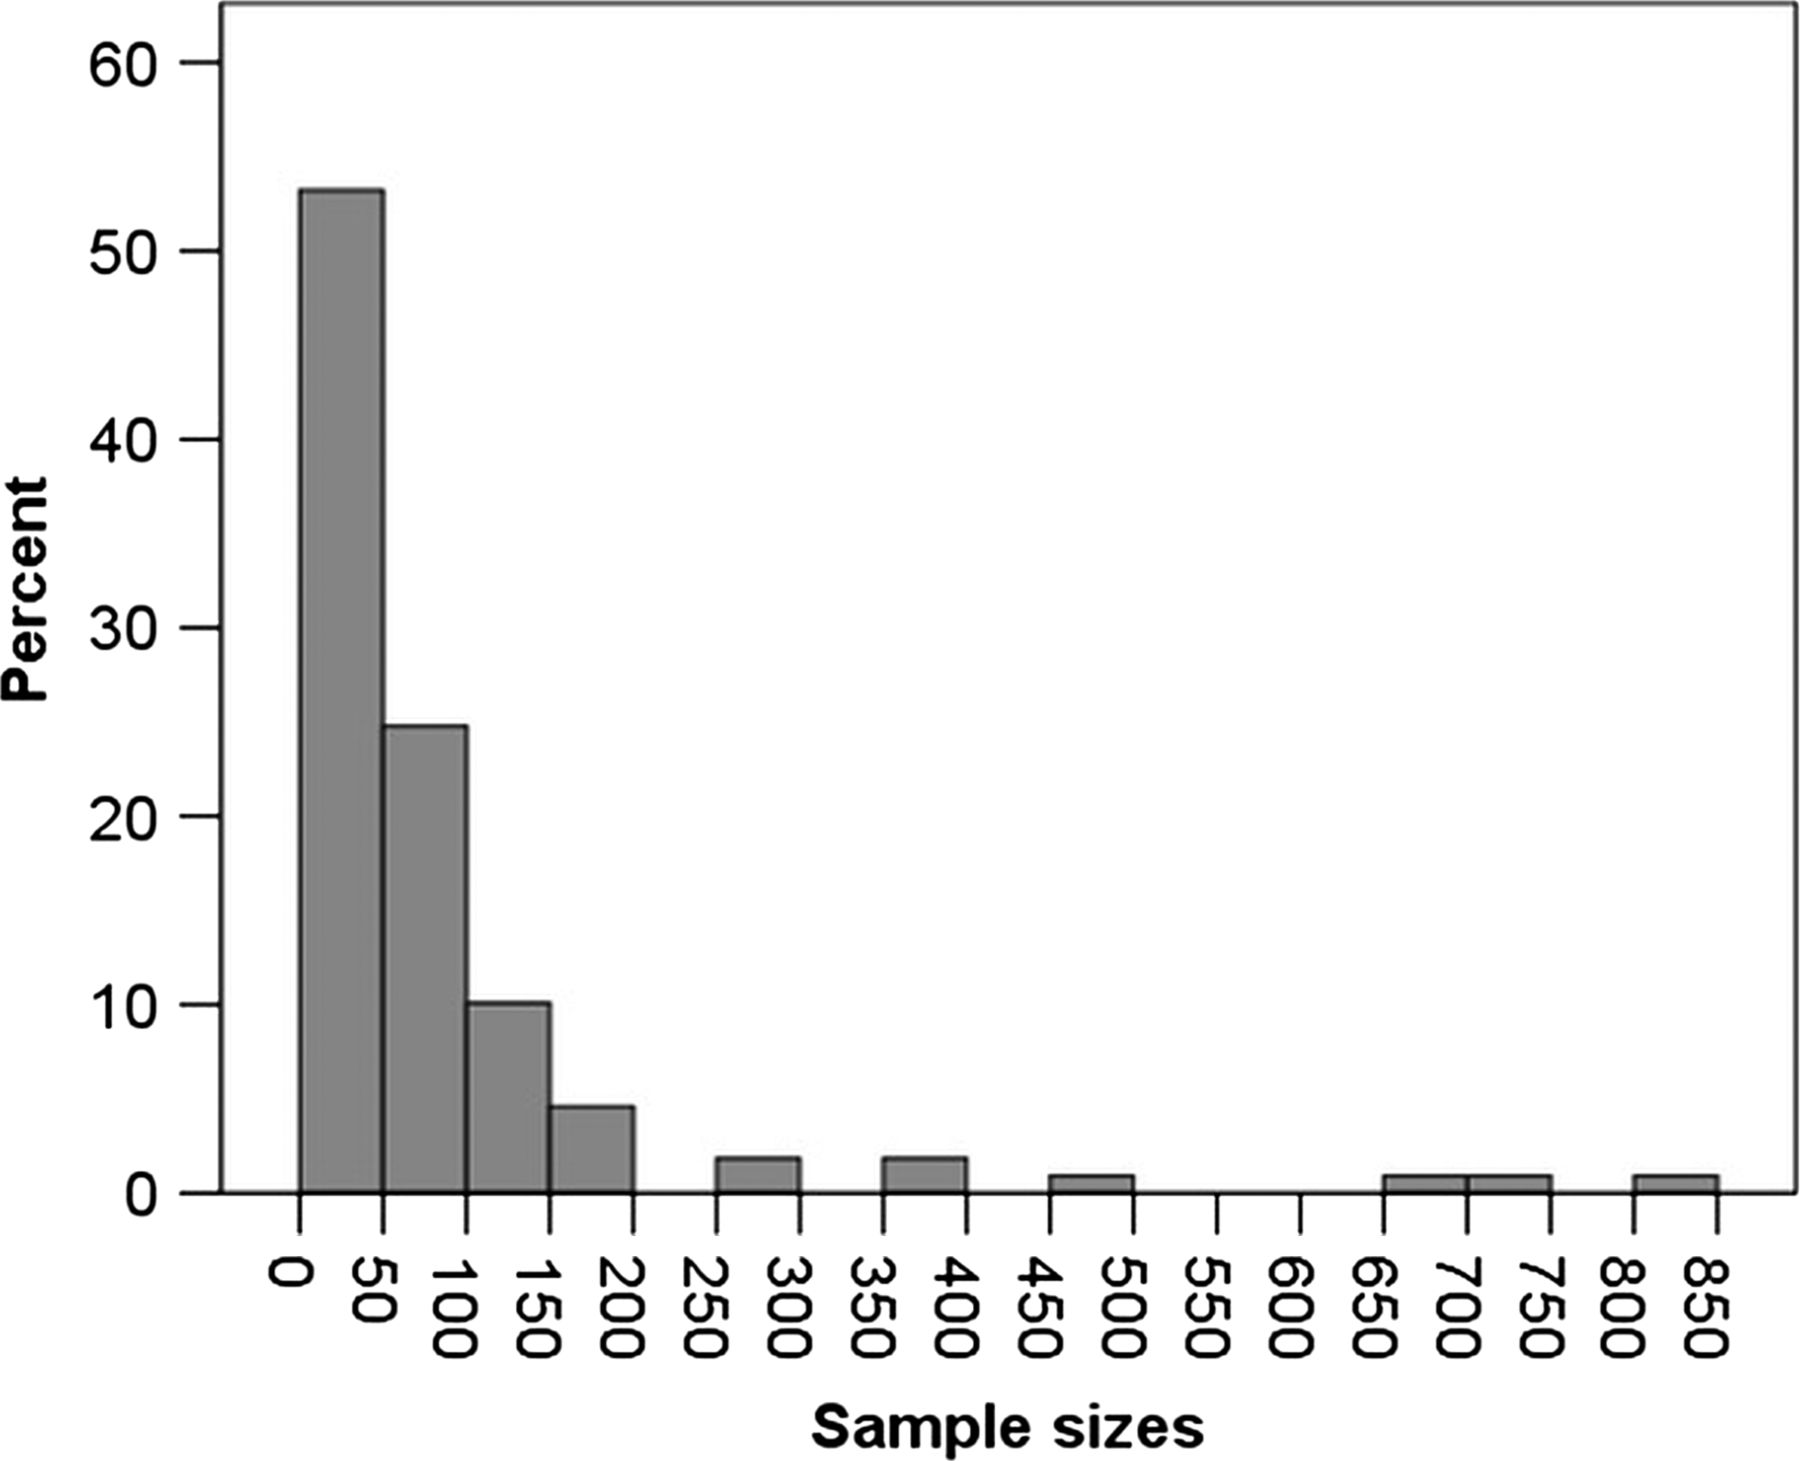
Thus, four groups can be distinguished: non-consecutive QT variability, consecutive QT variability, non-consecutive QTn variability and consecutive QTn variability. Table 1 gives an overview of the nine QT variability markers, classified into these four groups, with their formulas, the number of studies per marker and the number of participants. Table 1 and figure 3 illustrate that the study populations are generally small with a median size of 48 subjects (range 1–805 subjects).
The distribution of population sizes across studies.
A variety of ECG leads and time windows are used to calculate the QT variability. The majority used either lead II or V5. Time windows ranged from 10 s to 10 min. In a small number of studies, measurements were performed manually; in most studies, semiautomatic methods were applied, usually template stretching according to Berger et al.24 In this method, a digitised ECG is displayed on a graphical interface. The operator defines the template QT interval by selecting the beginning of the QRS complex and the end of the T wave for one beat. The algorithm then detects all R waves with automatic peak detection and subsequently determines the QT interval of all other beats by stretching or compressing each beat in time to best match the user-defined template.24
We will first describe available physiological and clinical information for all QT variability markers. After that, we will summarise information from publications comparing different QT variability markers. Finally, we will discuss publications comparing QT variability markers and QT(c) duration.
Association between QT variability and physiological and clinical endpoints
QT variability markers had a diurnal pattern being low at night and during sleep, increasing in the morning, peaking at noon.W19–W22 Variability was lower in children than in adults and further increased with age.W22–W26 No conclusion could be drawn on gender differences.W24–W30 Variability was higher in standing position compared with supine.W31–W33 Passive head tilting,W34–W36 head-down bed rest (simulating a long-duration space flight),W37 job strain and exercise showed inconsistent results, but most studies showed an increased QT variability during exercise.W27 W29 W38–W42
An increased variability was found in patients with cardiac abnormalities,W34–W36 W39 W43–W73 for example, congenital LQTS,W51 W68 W69 W74 W75 drug-induced LQTSW50 W71 and was associated with the occurrence of VF/VT. W43–W49 Ten cohort studies (n=132–687) on patients with cardiac diseases showed that an increased variability was associated with the occurrence of VF/VT, (cardiovascular) mortality and SCD.W28 W44 W46 W49 W58 W61 W76–W79 However, three case-control studies did not show an increased QT variability in patients with SCD.W45 W80 W81 Case-control studies further showed that QT variability was increased in patients with cardiomyopathies,24 W35 W52 W82–W84 coronary artery diseaseW53 W57 W59 W85 W86 and hypertension.W67 W82 W87 When patients with structural heart disease received cardiac resynchronisation therapy, QT variability did not change when electrical remodelling was reversed (reversal of electrical remodelling was defined as a decrease of the QRS duration with more than 10 ms),W44 QT variability was not increased in patients with postural tachycardia syndromeW34 and in teenage patients who underwent an arterial switch operation in the neonatal period.W88 Three studies showed that sympathetic activity of the heart elevated QT variability.W34 W87 W89 Six studies showed an increased variability in patients who had a disturbed cardiac autonomous regulation.W60 W90–W94 This indicates that neuronal regulation of cardiac function influences repolarisation patterns and stability represented in QT variability. Several other studies report on QT variability in conditions that have a weak association with SCD. Most of these studies found a higher QT variability in cases.W22 W32 W66 W89–W92 W95–W123
In table 2, the effect of drugs on QT variability is shown.W26 W36 W41 W50 W62 W83 W89 W100 W101 W108 W124–W131 Variability was decreased by β-blockers, but increased by sotalol, a drug that can cause ventricular arrhythmias. Drugs that stimulate the sympathetic nervous system as well as most QTc interval prolonging drugs increased QT variability. Amiodarone neither increases QT variability, nor does it increase the risk of ventricular arrhythmias, but it does prolong the QTc interval. This observation is of particular interest given the inconsistent relation between observed QTc prolongation and SCD risk by certain drugs.
Effects of several drugs on non-consecutive QTn variability
Comparison between QT variability marker groups
As described earlier, QT variability markers can be divided into four groups based on whether or not the measurement is performed on consecutive beats and whether or not it is normalised for heart rate (variability). Because these marker groups are physiologically different, as mentioned in the general findings section, there could be differences in the association with the endpoints between marker groups. In 57 studies, the results for different QT variability markers are described; however, no direct comparisons are made. Most studies (51) described non-consecutive QT and non-consecutive QTn variability together. In table 3, all possible combinations of simultaneous analyses are shown. There are no studies that studied all four QT variability marker groups. In the majority of studies comparing two or three markers, the markers showed similar results, that is, they showed a significantly higher QT variability in persons with a higher risk for arrhythmias and SCD. None of the studies compared sensitivity and specificity or predictive power of different QT variability markers.
Studies comparing different QT variability groups
Comparison between QT variability and QTc interval
A total of 70 of the 109 included publications reported on the QT/QTc interval alongside QT variability. In 40 of these publications, the QT interval was corrected for heart rate. Only two studies made a direct comparison. Hinterseer et al compared the sensitivity and specificity of QTc interval and QT variability for diagnosing congenital LQTS among 40 patients and 40 controls, and found that sensitivity of QT variability was higher than for QTc interval (83% vs 43%), but specificity was lower (68% vs 97%).W69 When tested in 20 patients with drug-induced LQTS, the predictive power of QT variability was superior to that of QTc prolongation (area under the receiver operating characteristics curve 0.89 vs 0.57).W71 Of the other 68 studies, 66 described an increased QT variability, while only 27 found an increased QT(c) interval. Unfortunately, in these studies nothing was reported on the predictive power of QT variability compared with QTc prolongation.
Discussion
Key findings
This is the first review that focuses on all QT variability markers. It shows that QT variability markers are potentially useful determinants of ventricular arrhythmias, (sudden) cardiac death and total mortality, both in the context of risk stratification and drug safety. Possibly, QT variability could be a useful addition to risk stratification for ventricular arrhythmias and SCD. However, many studies used small populations and a few studies did not show an association between QT variability markers and conditions assumed to enhance the risk of arrhythmias and SCD.W44 W50 W72 W81 W88 Moreover, a wide variety of markers and methods is used while studies that compare the predictive value of markers directly are unavailable.
Overview of results and further research
We identified nine different markers of QT variability. Non-consecutive QTn was the most prominent, covered in 83% of the included studies. Most studies were case-control studies with small sample sizes. Reference values and differences among sex, age groups and ethnicities have not been established.
The measurement methods lack uniformity. First, there is no consensus on which lead to use, although most studies use either lead II or V5. Two studies found significant differences in QTVI between the standard ECG leads.28 W30 All studies used a single lead to determine the markers. It is plausible that some method of combining leads will give better results, but this has not been investigated to date.
Second, there are different methods to measure the subsequent QT intervals. While a few studies measured manually, the majority used the semiautomatic algorithm as proposed by Berger et al.24 Since beat-to-beat changes in the QT interval are in the magnitude of a few milliseconds, QT variability can considerably be affected by accuracy of measurement. For comparison of the results between studies, a standard method of measuring QT intervals should be chosen. A recent study by Baumert et al29 showed that template matching algorithms, in particular a time shifting algorithm, performs better than conventional methods.
Third, the time window in which QT variability is determined varies between studies. As indicated by Magri et al, variation in time window can give different results for the same marker.W85 As of yet, no studies have been performed to assess the optimal time window. Fourth, the effect of heart rate (variability) normalisation on QT variability is unclear. One study specifically comparing QTVN with QTVI noted that an increase in QTVI could be due to a decrease in heart rate variability or an increase in QT variability.W61 The other studies we found, however, did not consistently report the heart rate variability and QT variability component of QTVI. Therefore, we could not elucidate this further.
Studies that described different QT variability marker groups did not unequivocally show that one specific marker group performs better than the others. However, without direct comparison of the predictive value of these markers, we cannot, on the basis of the current literature, conclude that one marker or marker group is superior. In a paper by Oosterhoff et al, predictive value of consecutive and non-consecutive QT variability on intracardiac ECGs was compared. They hypothesised that consecutive QT variability accentuates sudden changes in QT interval, which are likely due to stochastic activity of ion channels and thus are arrhythmogenic. Conversely, non-consecutive QT variability should be more sensitive to slow changes in QT due to variation in autonomic tone or respiration, and reflects changes in the autonomic tone in the ventricles.30 In figure 2, pattern 1 corresponds to the sudden, that is, high-frequency changes, and pattern 2 corresponds to the slow, low-frequency changes. As non-consecutive variability is the same in both patterns, it cannot be said to be more sensitive to slow changes.
In two small studies, direct comparison of the predictive and discriminative power showed that QT variability performs better than QTc prolongation. Although in other studies no direct comparisons of the predictive value were made, QT variability discriminated between cases with an increased risk for SCD and controls in more studies than QTc prolongation. Evidence for superiority of QT variability over QT duration is limited. However, it can be of high relevance, even if the predictive power in the general population is limited. It could lead to re-evaluating the place of the obliged assessment of QT duration prolonging effects in drug development. Also the withdrawal of several drugs could be disputed.
Clinical relevance
To date, no study systematically investigated which marker and measuring method is optimal for risk prediction. For drug safety studies, study sample sizes were small and methodological heterogeneity was substantial. Therefore, we cannot draw any firm conclusions. For risk stratification, there is evidence that QT variability is a marker of cardiovascular mortality and SCD, including a number of cohort studies, indicating that QT variability might indeed be a useful risk indicator. However, further research is needed before this promising marker can be used in clinical practice.
Limitations
As our intention was to restrict ourselves to the literature on short-term QT variability, we only included studies that measured over at most 10 min. Consequently, we excluded 20 publications on long-term QT variability. The value of long-term variability is still unknown and remains a subject for further investigation. Furthermore, we only included studies performed in humans on surface ECGs since these studies have the highest clinical impact and are of interest for future epidemiological research. Finally, due to substantial clinical heterogeneity we were not able to quantify our results through meta-analysis. This heterogeneity was caused by differences in signal processing, formulas used and clinical endpoints that were studied.
Conclusions
This review shows that QT variability might be a clinically useful determinant of ventricular arrhythmias and SCD. However, more comparative studies are needed to find the most accurate QT variability marker and the best method for measurement. We believe this overview of the current scientific status of QT variability markers aids clinicians and epidemiologist in future research on ECG derived markers for SCD and arrhythmias.
References
Supplementary materials
Supplementary Data
This web only file has been produced by the BMJ Publishing Group from an electronic file supplied by the author(s) and has not been edited for content.
Files in this Data Supplement:
- Data supplement 1 - Online supplement
- Data supplement 2 - Online supplement
- Data supplement 3 - Online supplement
Footnotes
-
MNN and MEvdB contributed equally to this study.
-
Contributors Study design: BHS, PRR, JAK; Data collection: MNN, MEvdB; Data analysis and writing: MNN, MEvdB; Data interpretation: MNN, MEvdB, ME, PRR, BHS, JAK, GvH; Critical review: BHS, PRR, ME, JAK, GvH.
-
Funding This work is supported by grants from the Netherlands Organisation for Health Research and Development (ZonMw) (Priority Medicines Elderly 113102005 to ME; and DoelmatigheidsOnderzoek 80-82500-98-10208 to BHS).
-
Competing interests None.
-
Provenance and peer review Not commissioned; externally peer reviewed.