Article Text

Abstract
Objective: To determine the rate of implantable cardioverter-defibrillator (ICD) implantation across the UK during the period 1998 to 2002.
Design: Observational self reporting with cross checking.
Setting: All ICD implanting centres coordinated by the National Pacemaker and ICD Database.
Patients: Every patient receiving an ICD in the UK from 1998 to 2002.
Main outcome measures: Date of implantation and postcode of each ICD recipient during the study period.
Results: ICD implantation increased in the UK in the five year period studied but fell far short of the European average and national targets. Implantation rates varied greatly by region.
Conclusions: The low rate of ICD implantation in the UK and the disparity between regions require further study to determine the barriers to this evidence based treatment.
- ICD
- implantable cardioverter-defibrillator
Statistics from Altmetric.com
The implantable cardioverter-defibrillator (ICD) was introduced in 19801 and has since gained acceptance in routine clinical practice, particularly in North America. The published evidence was reviewed by the National Institute for Clinical Excellence (NICE), which published guidance on ICD implantation for arrhythmias in 2000.2
A world survey of the use of ICDs in 1997 showed great disparity in the annual rates of ICD implantation, from seven per million population per year in the UK (including first and replacement devices)3 to 49 in Germany3 and 133 in the USA.4 Camm and Nisam5 showed that this disparity was still evident in 1999, with an average European implantation rate for first ICDs of 31 per million population per year, compared with 154 in the USA. Within Europe, there remain major variations in ICD implantation rates (fig 1).6 This disparity cannot be explained by differences in the prevalence of ischaemic heart disease, the cause of most ICD indications,7 suggesting that it is due to differences in clinical practice.

First implantable cardioverter-defibrillator (ICD) implantation rates per million in 2000 or the most recent year available in European and associated countries.
We have studied ICD implantation in the UK to establish the extent of the shortfall between current rates and those suggested by NICE guidance.2
METHODS
The National Pacemaker Database was established in 1978 as a voluntary register of all pacemaker implants in the UK and the Republic of Ireland, funded by the Medical Devices Agency. ICDs have been registered since 1989.
Considerable effort has been expended to ensure complete registration of ICD implants since 1998. All implanting centres were contacted, and details of all ICDs implanted in the calendar years 1998 to 2002 were checked and collated by telephone, electronic communication, or a visit from one of the authors. Registrations were pursued until near complete ascertainment was achieved. Implantation data were checked anonymously with the manufacturers against the number of ICDs supplied in the UK. Data collected included age, sex, postcode, and district health authority of residence. Analysis was based on district of residence, rather than implantation centre.
RESULTS
In the UK, 78 hospitals (including 12 private hospitals, 11 in England and one in Scotland) implanted at least one ICD during the period 1998 to 2002; 45 centres implanted at least one ICD each year. The number of implants in each centre ranged from 409 to only one over five years. Thirty nine centres implanted an average of 10 or more a year and 10 centres implanted an average of 50 or more a year.
Most major (10 or more implants) NHS ICD implanting centres were in England (32, a mean of 1.1 centres/million population), with three in Scotland (a mean of 1.6 centres/million population), two in Wales (a mean of 1.2 centres/million population), and two in Northern Ireland (a mean of 0.84 centres/million population).
Data relating to 7116 ICDs implanted in the UK during the study period were analysed. Of these devices, 5848 were the first ICD implant received by the patient, the others being replacements for previously implanted ICDs. We excluded from further analysis 95 ICDs implanted in patients normally resident overseas. We could not ascertain 91 (1.3%) patient postcodes. Strategic or regional health authority boundaries were used for analysis.
Overall in the UK, ICD implantation increased steadily over the years 1998 to 2002. In 1998, 708 (12.0/million) first ICDs were implanted, 826 (14.0/million) in 1999, 1034 (17.6/million) in 2000, 1439 (24.5/million) in 2001, and 1841 (31.5/million) in 2002. The proportion of ICDs implanted in addition to these as device replacements remained relatively constant at around 18%. The total UK implantation rate in 2002 was 37.9 per million.
The publication of guidance on the use of ICDs for arrhythmias by the NICE2 in 2000 was followed by very significant increases in implantation.
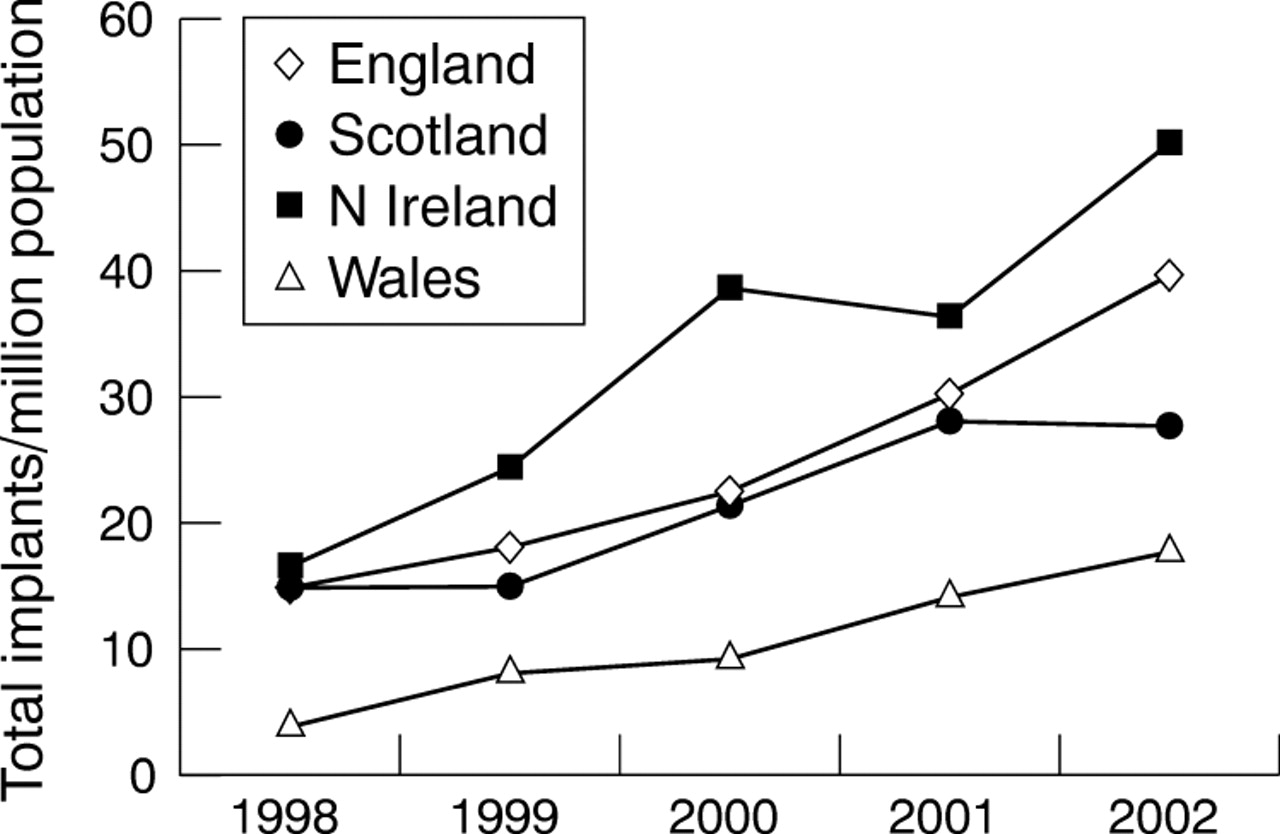
ICD implantation rates varied greatly between the countries of the UK. Implantation in England rose steadily, more than doubling over five years. Scotland’s implantation rate was very similar to England’s in 1998 but has risen more slowly. The Welsh implantation rate more than quadrupled from a low baseline. The implantation rate in Northern Ireland more than tripled to 30% above the UK average despite a fall in 2001 (fig 2).

ICD implantation rate per million population in the countries of the UK in 1998–2002.
Figure 3 shows the total ICD implantation rates for the years 1998 to 2002 at the health authority level. In 2002, 10 (20%) of the health authorities serving populations of over 100 000 achieved a total ICD implantation rate above 40 per million (NICE’s estimated need is 50/million2). Only the Southern and Eastern Health and Social Services boards of Northern Ireland and the Dorset and Somerset Strategic Health Authority achieved a rate of over 50 per million.

Total (first and replacement) ICD implantation rates per million population in the UK in 1998–2002.
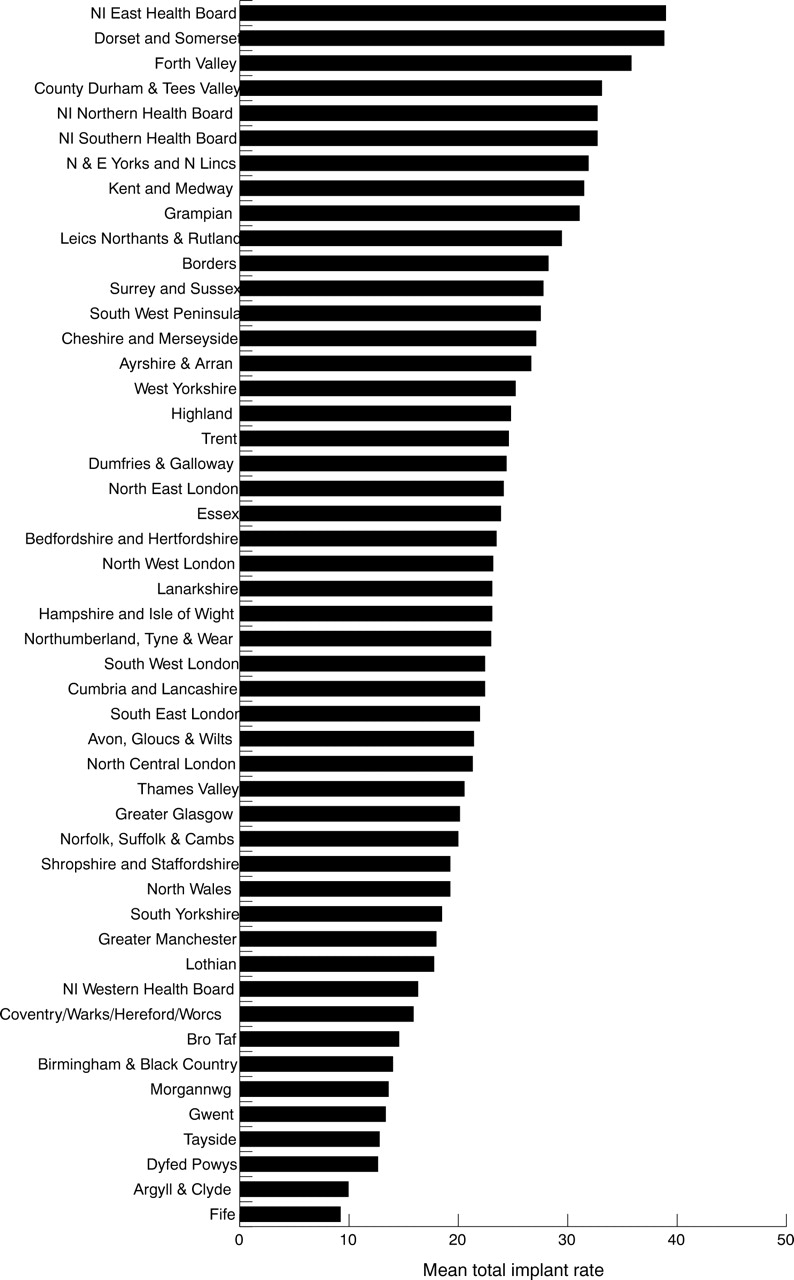
Figure 4 shows the true magnitude of this disparity. To minimise the impact of random variation, the graph shows the mean ICD implantation rate over the five years 1998 to 2002 in each of the mainland UK health authorities. The disparity between the authority with the lowest ICD implantation rate (9.2/million/year in Fife) and that with the highest rate (39.0/million in Northern Ireland Eastern Health Board) is more than fourfold. It is evident that health authorities referring to the same centre have very different ICD implantation rates. Disparity of this magnitude cannot be explained by variation in the incidence of ICD indications in the population.

Mean annual ICD implantation rate per million population in each UK strategic health authority with a population of at least 100 000 in 1998–2002.
DISCUSSION
These figures show a low ICD implantation rate in the UK compared with other developed countries and illustrate a geographical disparity that does not correlate with the prevalence of coronary heart disease, the cause of most ICD indications. During the five years studied, no region consistently achieved an implantation rate close to the European average of 31 per million, nor to the rate recommended by NICE.2
The reasons for the great disparity in ICD implantation rates are not known. It is likely that many factors are involved and their relative contributions vary across the regions of the UK. Potential explanations can be grouped into factors influencing the demand for ICD services and those affecting its provision.
The true number of patients with ICD indications in the UK is difficult to estimate. The incidence of primary prevention indications would clearly be affected by the number of myocardial infarction survivors and the prevalence of heart failure in the population. Secondary prevention indications are also predominantly found among patients with ischaemic heart disease who have survived aborted sudden cardiac death. These numbers would be affected by the rates of success in the treatment of myocardial infarction, heart failure, and cardiac arrest. While these factors are known to vary across the UK, they clearly cannot alone explain the magnitude of the disparities observed in this study. The full implementation of referral guidelines may also be an important factor in some areas: It is well known that many areas are not yet systematically screening myocardial infarction survivors for ICD indications.
The provision of ICD services is not uniform across the UK, but there do not appear to be systematic blocks to referral of appropriate patients. ICD services are costly, in terms not only of devices but also of appropriately trained cardiologists, nurses, and clinical physiologists. These services also require suitable theatre facilities with appropriate air changes and excellent radiological screening equipment. Such a service requires network-wide planning and long term investment. By analogy with the devolution of pacemaker implantation to district hospitals, local implantation of ICDs in the district hospitals rather than in the centre may facilitate higher implantation rates.
The explanations for the great disparities in ICD implantation documented in this study are not obvious and require further study. These probably result from differences in screening and referral practices in secondary care rather than from systematic differences in selection criteria within the implanting centres. Whatever the reasons, there appears to be evidence of “postcode” prescribing, the chance of receiving an ICD depending on district of residence. Detailing national solutions is impossible with the information available at this stage, but these data should allow each health authority to examine their local provision of ICDs and to plan for the appropriate expansion of their services.
APPENDIX
Dr Anthony F Rickards
Tony Rickards was one of the founding fathers of pacemaker and ICD technology. His tragic death on 28 May 2004 was an extremely sad loss to all who knew him. Up to the time of his death and as president of the British Pacing and Electrophysiology Group he continued to make significant inroads into the advancement of cardiac rhythm management in the UK, as he had done for 25 years. His enthusiasm and intellect are irreplaceable, and the authors of this paper dedicate it to his memory.
Acknowledgments
The authors thank all the technicians and ICD implanting physicians who have kindly contributed their data.
This work was supported by a research grant from Medtronic Europe.
The authors have received research funding or reimbursement for the costs of attending international meetings from several ICD manufacturers.
Footnotes
-
Published Online First 29 March 2005
-
The assistance of Medtronic UK in this work was invaluable. It should be stressed that all individual and aggregate hospital data remained confidential to the National Pacemaker Database, according to its code of practice, and was not divulged to industry representatives. Individual hospital data can be disclosed only to authorised personnel from that hospital, by contacting Morag Cunningham at 01505 612829 (email: mwcbtconnect.com).