Article Text

Abstract
Objective To investigate the relationship between plasma fetuin-A, an anti-inflammatory glycoprotein which might be involved in myocardial healing after acute infarction, and infarct size, left ventricular (LV) function and dimensions as well as the occurrence of adverse remodelling at 4 months after acute ST segment elevation myocardial infarction (STEMI).
Methods In this single-centre prospective, observational study, 89 patients underwent cardiac MR within the first week and 4 months after mechanical reperfusion for first STEMI. Infarct size, LV function and dimensions were assessed at both time points. Fetuin-A levels were determined from blood samples drawn at a median of 49 h (IQR 30–59 h) after STEMI by an immunofluorescent assay.
Results Fetuin-A levels (median 568 µg/mL, IQR 478–763 µg/mL) were significantly correlated with infarct size and LV ejection fraction at baseline and follow-up (all p<0.05). Moreover, fetuin-A was related to the increase in the end-diastolic volume index (r=−0.383, p<0.001). According to multivariate logistic regression analysis, fetuin-A concentrations (HR=0.17, 95% CI 0.03 to 0.89, p=0.036) besides the presence of late microvascular obstruction (HR=10.03, 95% CI 0.98 to 102.43, p=0.05) were significantly related to the occurrence of adverse LV remodelling at 4 months.
Conclusions Circulating fetuin-A at day 2 after STEMI is related to acute and chronic infarct size, LV function and dimensions. In addition, it might be useful to identify patients at increased risk for adverse LV remodelling.
This is an Open Access article distributed in accordance with the Creative Commons Attribution Non Commercial (CC BY-NC 4.0) license, which permits others to distribute, remix, adapt, build upon this work non-commercially, and license their derivative works on different terms, provided the original work is properly cited and the use is non-commercial. See: http://creativecommons.org/licenses/by-nc/4.0/
Statistics from Altmetric.com
KEY MESSAGES
What is already known about this subject?
Myocardial ischaemia is generally followed by the activation of inflammatory pathways. After myocardial ischaemia, plasma levels of the anti-inflammatory glycoprotein fetuin-A decrease, a process which might consequently lead to myocardial calcification and fibrosis. To what extent fetuin-A levels are related to infarct size, left ventricular (LV) function and remodelling after acute ST segment elevation myocardial infarction (STEMI) is largely unknown.
What does this study add?
We demonstrated that plasma fetuin-A levels, measured two days after acute STEMI, are associated with acute and chronic infarct size as well as LV ejection fraction. Furthermore, fetuin-A independently predicts the development of LV remodelling at 4 months after STEMI.
How might this impact on clinical practice?
Beyond traditional cardiac biomarkers, fetuin-A could help to identify patients with STEMI at increased risk for adverse LV remodelling, if confirmed in larger studies. Since LV remodelling is a major predictor of morbidity and mortality after STEMI, these patients might benefit from intensified medical therapy.
Introduction
Myocardial ischaemic injury triggers an activation of inflammatory pathways.1 Subsequently, left ventricular (LV) function declines, and cardiac remodelling is promoted.2 ,3 Adverse LV remodelling is associated with a significant worsening of prognosis after acute myocardial infarction.4 Cardiac MR (CMR) is the current gold standard in the in vivo quantification of infarct size, LV function and dimensions.5
Fetuin-A, also called the α2-Heremans-Schmid glycoprotein, has well been described as an anti-inflammatory mediator expressed almost exclusively by the liver.6 Serum levels of fetuin-A were shown to decrease during inflammatory processes, probably to facilitate the initiation of the healing process.7 Furthermore, it increases the solubility of calcium and phosphorus in serum and prevents ectopic soft tissue calcification.8–10 Low levels of fetuin-A are associated with a higher severity of coronary artery disease (CAD).11 In patients with CAD, fetuin-A levels were inversely correlated with the presence of mitral annular calcification and aortic stenosis.12
Myocardial calcification and fibrosis are more severe in fetuin-A knockout mice than in the wild-type mice, which are associated with poorer functional recovery after myocardial ischaemia.13 In patients with acute coronary syndrome, fetuin-A plasma levels were significantly lower than in healthy controls.14 ,15 After ST segment elevation myocardial infarction (STEMI), the decrease of fetuin-A levels over the first 3 days is directly correlated with the degree of myocardial necrosis.16 This underlines that myocardial ischaemia leads to inflammatory processes.17
To what extent low fetuin-A levels are associated with myocardial damage, LV function and remodelling after acute STEMI remains largely unknown. We hypothesised that low fetuin-A plasma levels at day 2 after STEMI are related to infarct size, decreased LV function and increased risk for LV remodelling.
Methods
Study population
From April 2011 to June 2014, 89 patients with STEMI were enrolled in this single-centre prospective, observational study at the coronary care unit of the Medical University of Innsbruck. Inclusion criteria were the diagnosis of first acute STEMI according to the redefined ESC/ACC committee (the Joint European Society of Cardiology/American College of Cardiology Committee) criteria and successful reperfusion by primary percutaneous coronary intervention (PCI).18 Exclusion criteria were age below 18 years, severe renal dysfunction (estimated glomerular filtration rate <30 mL/min/1.73 m2), Killip class >2 at presentation and contraindications for CMR. Ischaemia time was defined as the time from symptom onset to the time point of first balloon inflation. Data on patient characteristics were obtained, a detailed medical history was taken and physical examination carried out during the inclusion procedure after primary PCI but before the CMR scan and at the 4-month follow-up.
All participants gave written informed consent before inclusion in the trial.
Biochemical measurements
For measurement of fetuin-A concentrations, EDTA blood samples were collected at a median of 49 h (IQR 30–59 h) after symptom onset and at 127±19 days thereafter. They were immediately centrifuged for 10 min at 2000 g and stored at −80°C until analysis. Plasma fetuin-A levels were determined by a commercially available sandwich immunofluorescent assay (DFTA00, R&D Systems Europe, Ltd, Abingdon, UK) after preparing a 4000-fold sample dilution. The analytical sensitivity of the assay is 1.74 ng/mL. Intra-assay and interassay coefficients of variation are <8.5% owing to the manufacturer’s data. Creatine kinase (CK) activity, high-sensitivity cardiac troponin T (cTnT), C reactive protein (CRP) and N-terminal pro brain natriuretic peptide (NT-proBNP) levels were measured serially and determined as described previously.19 The maximum values of these biochemical markers were defined as the highest in the concentration time course.
CMR protocol
CMR scans were performed 59±32 h after symptom onset and at 4 months thereafter (median 123 days, IQR 120–127 days). All scans were performed on a 1.5 Tesla Magnetom Avanto scanner (Siemens, Erlangen, Germany). The CMR protocol has been described in detail previously.20 ,21 Briefly, cine CMR images in the short axis (11 slices) were acquired using breath hold, retrospective ECG-triggered trueFISP (true fast imaging with steady-state precession) bright-blood sequences. Images were evaluated by an experienced observer using standard software (Argus, Siemens, Erlangen, Germany). Contouring of LV endocardial and epicardial borders was performed semiautomatically. Papillary muscles were excluded from the myocardial mass and included in the LV volume. End-diastolic volume index (EDVI) and end-systolic volume index (ESVI) were calculated by dividing end-diastolic volume (EDV) and end-systolic volume by the body surface area. The most basal slices were excluded from evaluation in the presence of the LV outflow tract, especially on the end-systolic images.22 Increase in EDVI was defined as higher absolute EDVI values at 4 months compared with baseline. Adverse remodelling was defined as an increase in EDV≥20% between the baseline scan and the 4-month follow-up.23 ,24 Ten minutes after a bolus injection of 0.1 mmol/kg gadolinium-based contrast agent (MultiHance, Bracco, Vienna, Austria) with an infusion pump at 2–3 mL/s, late gadolinium enhancement (LGE) CMR images were acquired by using an ECG-triggered phase-sensitive inversion-recovery single-shot trueFISP sequence with consecutive short-axis slices as described in detail previously.20 ,25 The area of LGE was evaluated quantitatively as reported before.5 The presence of late microvascular obstruction (MVO) was defined as a persisting area of hypoenhancement within the hyperenhanced myocardium, as reported before.17 Furthermore, infarcts were categorised as transmural if there was a transmural extent in at least two consecutive short-axis slices.
Statistical analysis
We used SPSS Statistics V.19.0.0 (IBM, Armonk, New York, USA) for statistical analysis. To test for normal distribution, the Kolmogorov-Smirnov test was applied. All variables except fetuin-A, maximum cTnT, maximum CRP, maximum NT-proBNP levels and plasma glucose concentrations at admission and ischaemia time were normally distributed. For statistical testing, they were log-transformed to achieve normal distribution. Results for continuous variables are all expressed as mean±SD or as median with IQR if not normally distributed. To test for correlations of continuous variables, Pearson's test was used. The z-score was calculated to test for the difference of two independent correlation coefficients. Differences in continuous variables between groups were assessed by Student t test and analysis of variance (ANOVA) with Bonferroni post-hoc testing. The paired samples Student t test was applied to determine statistically significant changes of CMR parameters during the 4-month follow-up. χ2-Test was applied to compare categorical variables between groups. To test for independent correlation between increase in EDVI and fetuin-A levels, a multiple linear regression analysis was performed. All variables listed in table 1 were tested in univariate analysis. Variables showing p values <0.1 in univariate analysis were included into the multiple linear regression model. Furthermore, two models of multivariate binary logistic regression analysis were performed to identify determinants of adverse LV remodelling. In the first model, only biomarkers (fetuin-A, cTnT, NT-proBNP, CRP) were included. Baseline infarct size and late MVO were added to a second model. Moreover, receiver operator characteristics (ROC) analyses for the prediction of LV remodelling were performed. Two-tailed p values <0.05 were considered to indicate statistical significance.
Multivariate analysis of predictors of an increase in EDVI
Results
Patient characteristics
All initially enrolled patients completed the 4-month follow-up. Baseline characteristics of the overall study cohort as well as of patients with and without LV remodelling are shown in table 2.
Baseline characteristics and post-PCI treatment of the overall study cohort as well as of patients with and without LV remodelling
CMR characteristics at baseline and at the 4-month follow-up are summarised in table 3.
CMR characteristics at baseline and at the 4-month follow-up
Plasma fetuin-A concentrations at baseline (median 568 µg/mL, IQR 478–763 µg/mL, range 353–1126 µg/mL) were significantly higher compared with 4-month values (median 517 µg/mL, IQR 438–572 µg/mL, range 306–819 µg/mL; p<0.001). A statistically significant correlation was detected between baseline and 4-month fetuin-A concentrations (r=0.501, p<0.001). No significant difference in baseline and 4-month fetuin-A levels was detected between male and female patients (all p>0.150). Fetuin-A did not correlate with age (all p>0.065), blood pressure (all p>0.430), serum creatinine (all p>0.670) and estimated glomerular filtration rate (all p>0.370). Fetuin-A was not associated with maximum cTnT (all p>0.690), maximum CK (all p>0.130), maximum NT-proBNP (all p>0.235) and CRP peak levels (all p>0.120). Fetuin-A levels did not correlate with ischaemia time (all p>0.900). Fetuin-A concentrations did not differ significantly between patients with 1-vessel, 2-vessel and 3-vessel disease (all p>0.05).
Correlation of fetuin-A levels with CMR findings
Linear correlations of baseline fetuin-A concentrations and CMR characteristics are shown in table 4 and figure 1. Baseline fetuin-A levels did not differ significantly between patients presenting with or without late MVO (p=0.163). No significant difference in fetuin-A concentrations was detected between transmural and non-transmural infarcts (p=0.341).
Correlation of BL fetuin-A concentrations with CMR characteristics at BL and 4 months

(A) Linear correlation of fetuin-A and left ventricular ejection fraction (LVEF) at 4 months. (B) Linear correlation of fetuin-A and end-diastolic volume index (EDVI) at 4 months.
Fetuin-A concentrations measured at 4 months were not related to the 4-month infarct size, LV ejection fraction (LVEF), EDVI, ESVI and myocardial muscle mass (all p>0.200).
Fetuin-A and LV remodelling
Patients with an increase in EDVI between baseline and 4 months showed significantly lower baseline fetuin-A levels compared with patients whose EDVI declined (median 538 µg/mL, IQR 449–608 µg/mL vs median 735 µg/mL, IQR 553–884 µg/mL; p<0.001). Baseline fetuin-A concentrations were significantly related to the increase in EDVI between baseline and 4 months (r=−0.383, p<0.001) (figure 2). This association was significant even after correction for covariates (table 1).
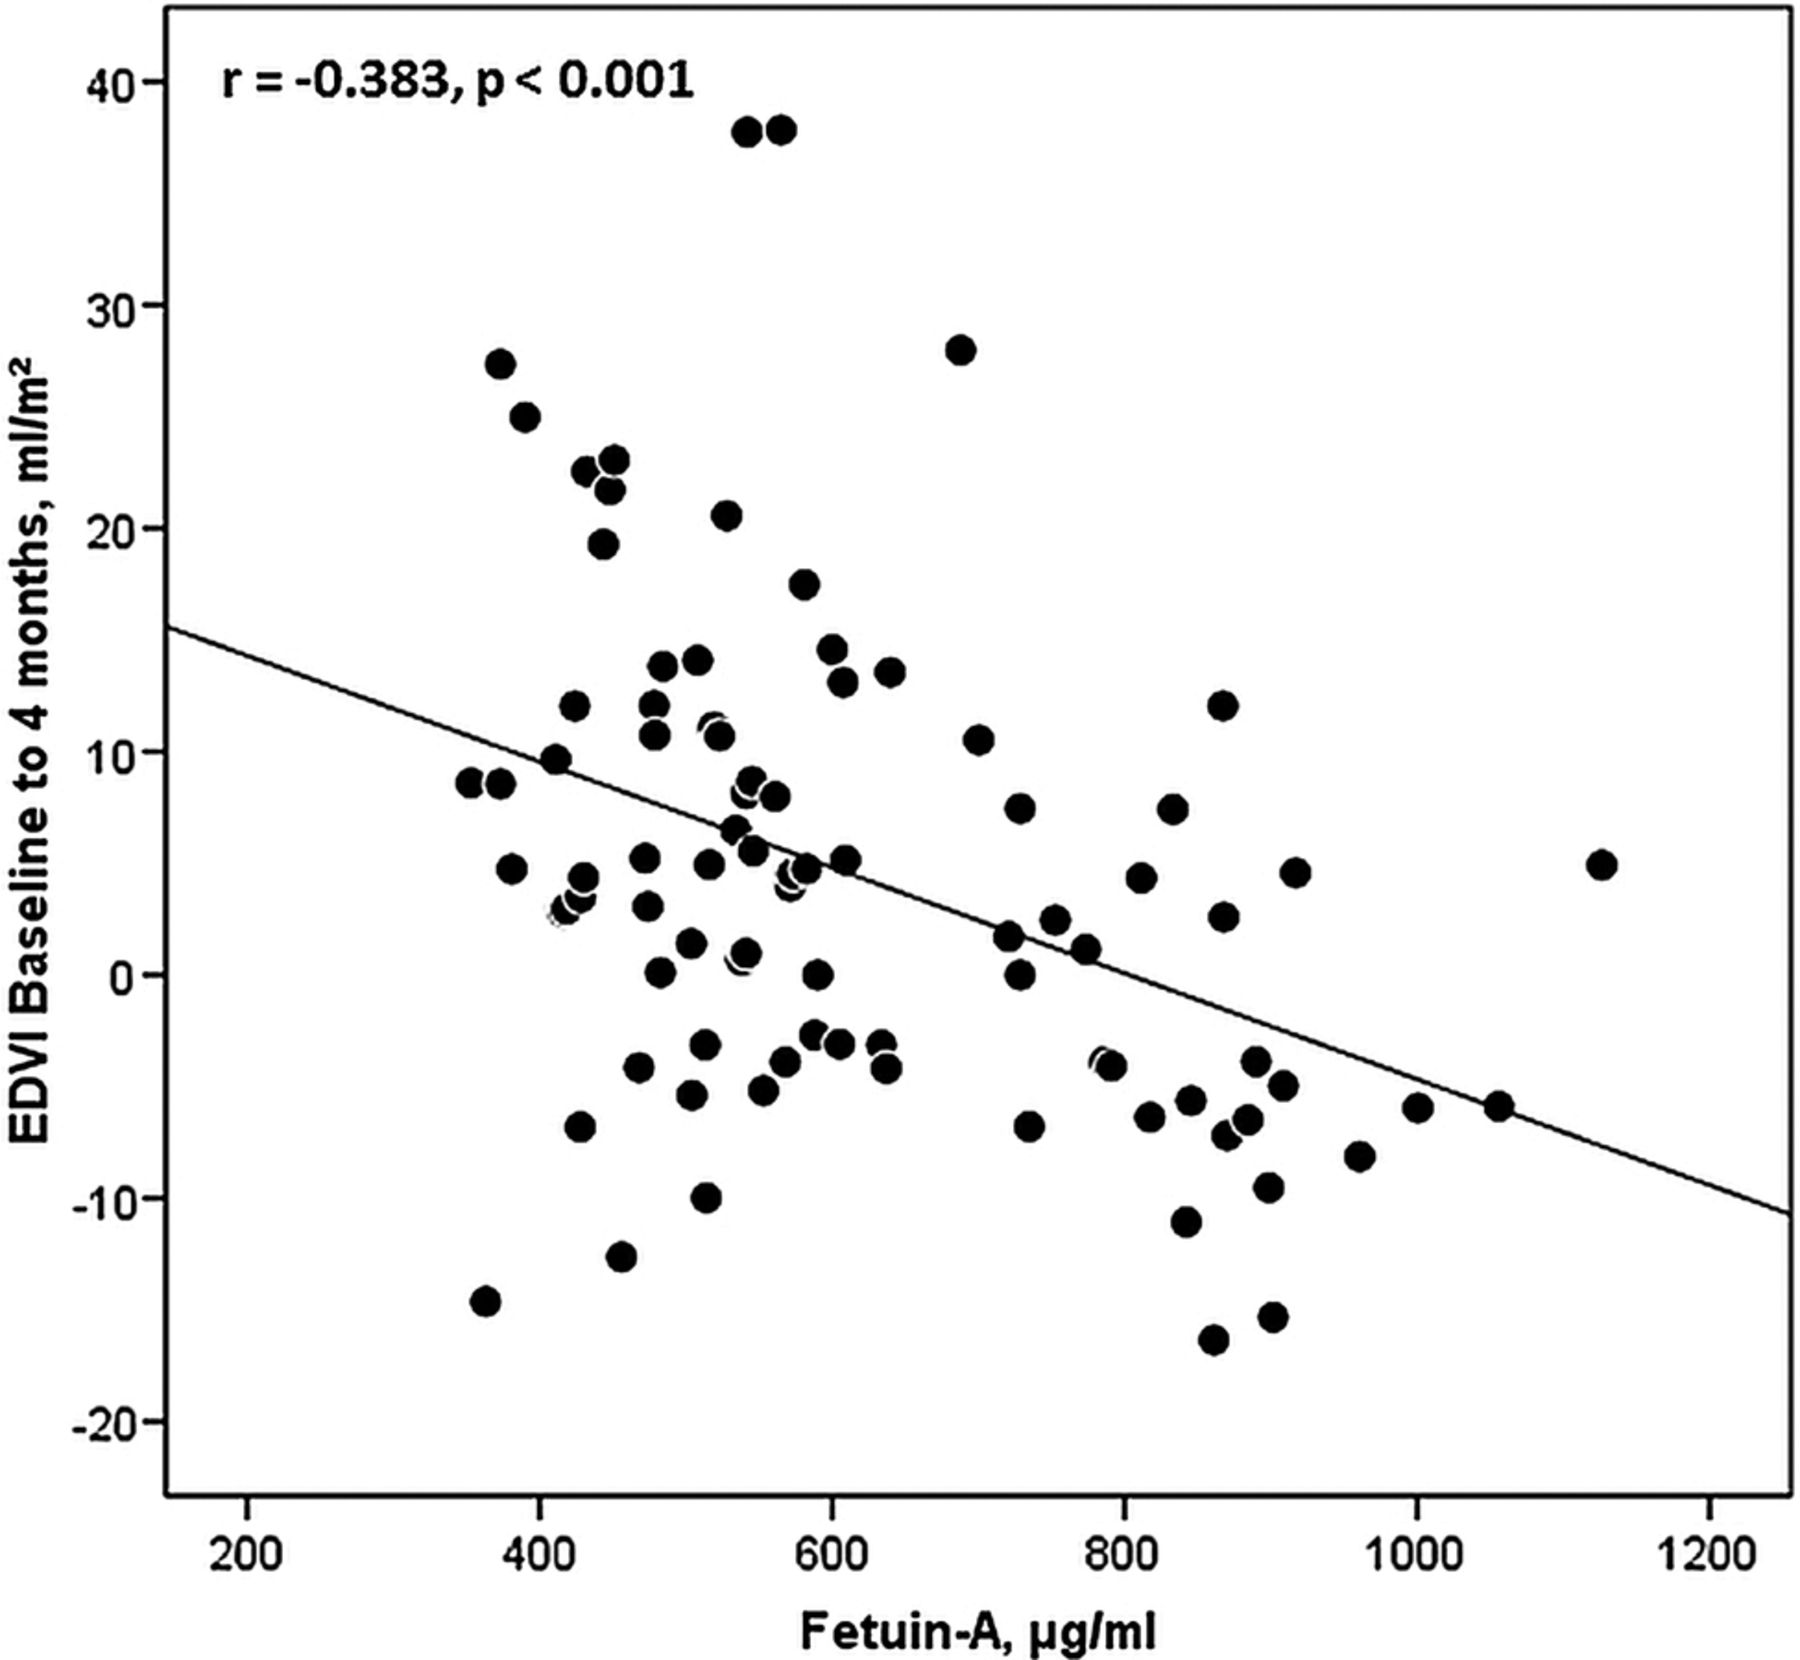
Linear correlation of fetuin-A and the change in end-diastolic volume index (EDVI) between baseline and 4 months.
Differences in the baseline characteristics of patients with (n=14) and without (n=75) LV remodelling are shown in table 2. In the first model of multivariate logistic regression analysis, baseline fetuin-A (HR=0.23, 95% CI 0.06 to 0.95, p=0.041) but not maximum cTnT, NT-proBNP and CRP (all p>0.110) concentrations were associated with the occurrence of adverse LV remodelling at 4 months. According to a second model also including baseline infarct size and late MVO, fetuin-A concentrations (HR=0.17, 95% CI 0.03 to 0.89, p=0.036) besides the presence of late MVO (HR=10.03, 95% CI 0.98 to 102.43, p=0.05) were significantly related to the occurrence of adverse LV remodelling.
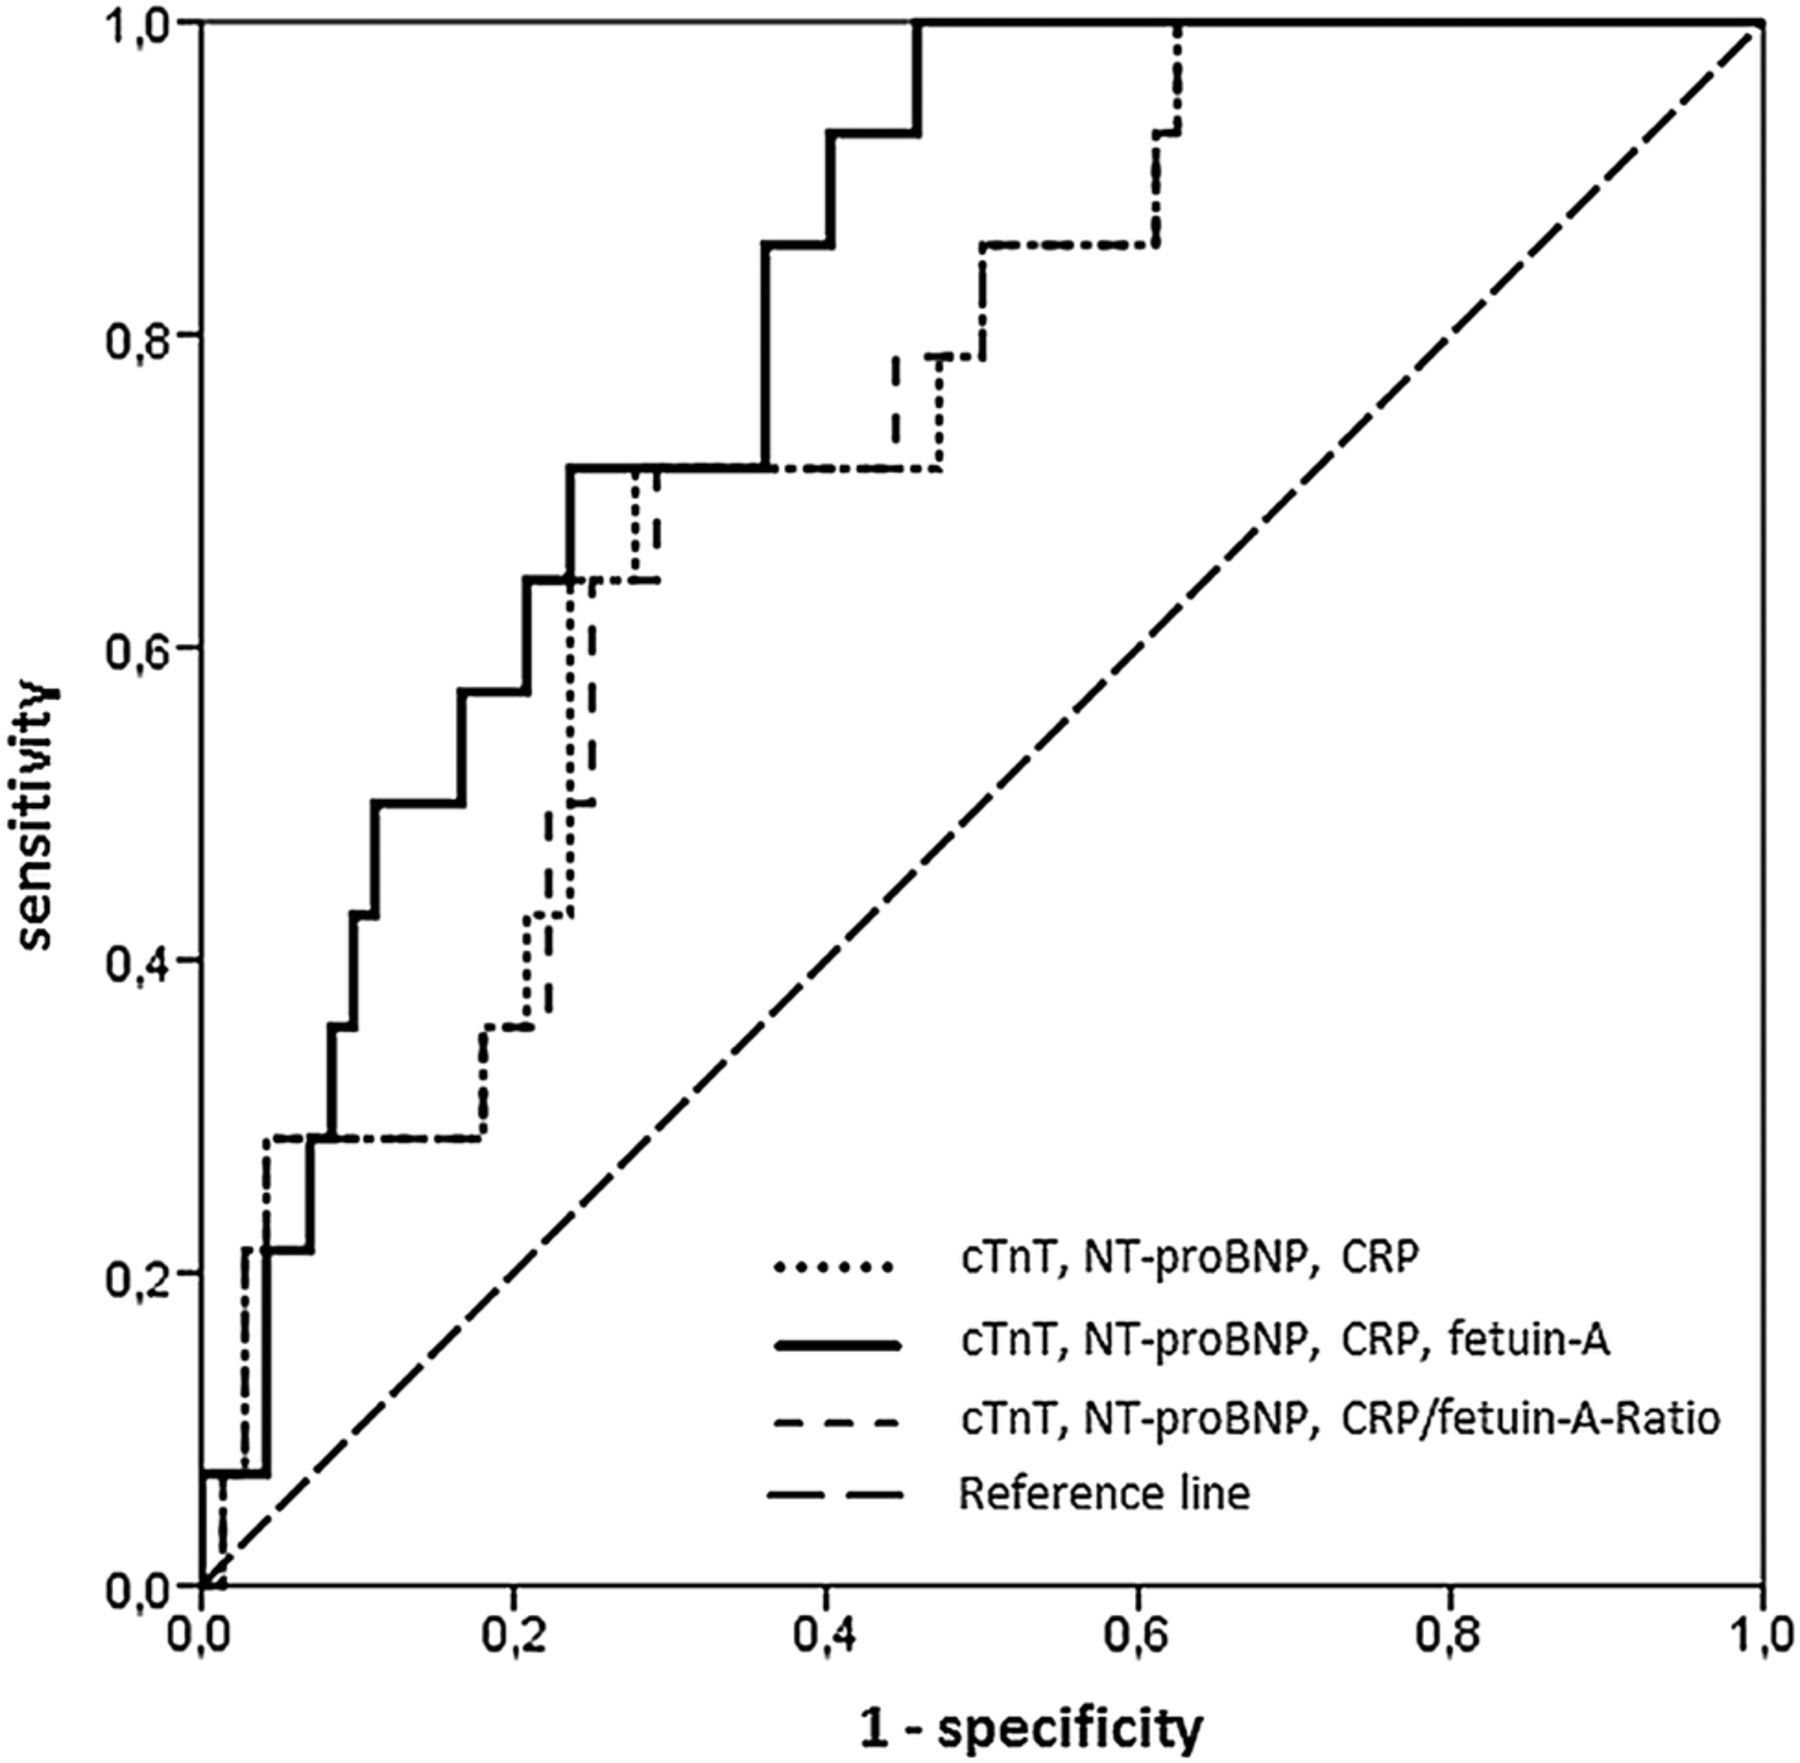
ROC curves indicating the risk for LV remodelling are shown in figures 3 and 4.
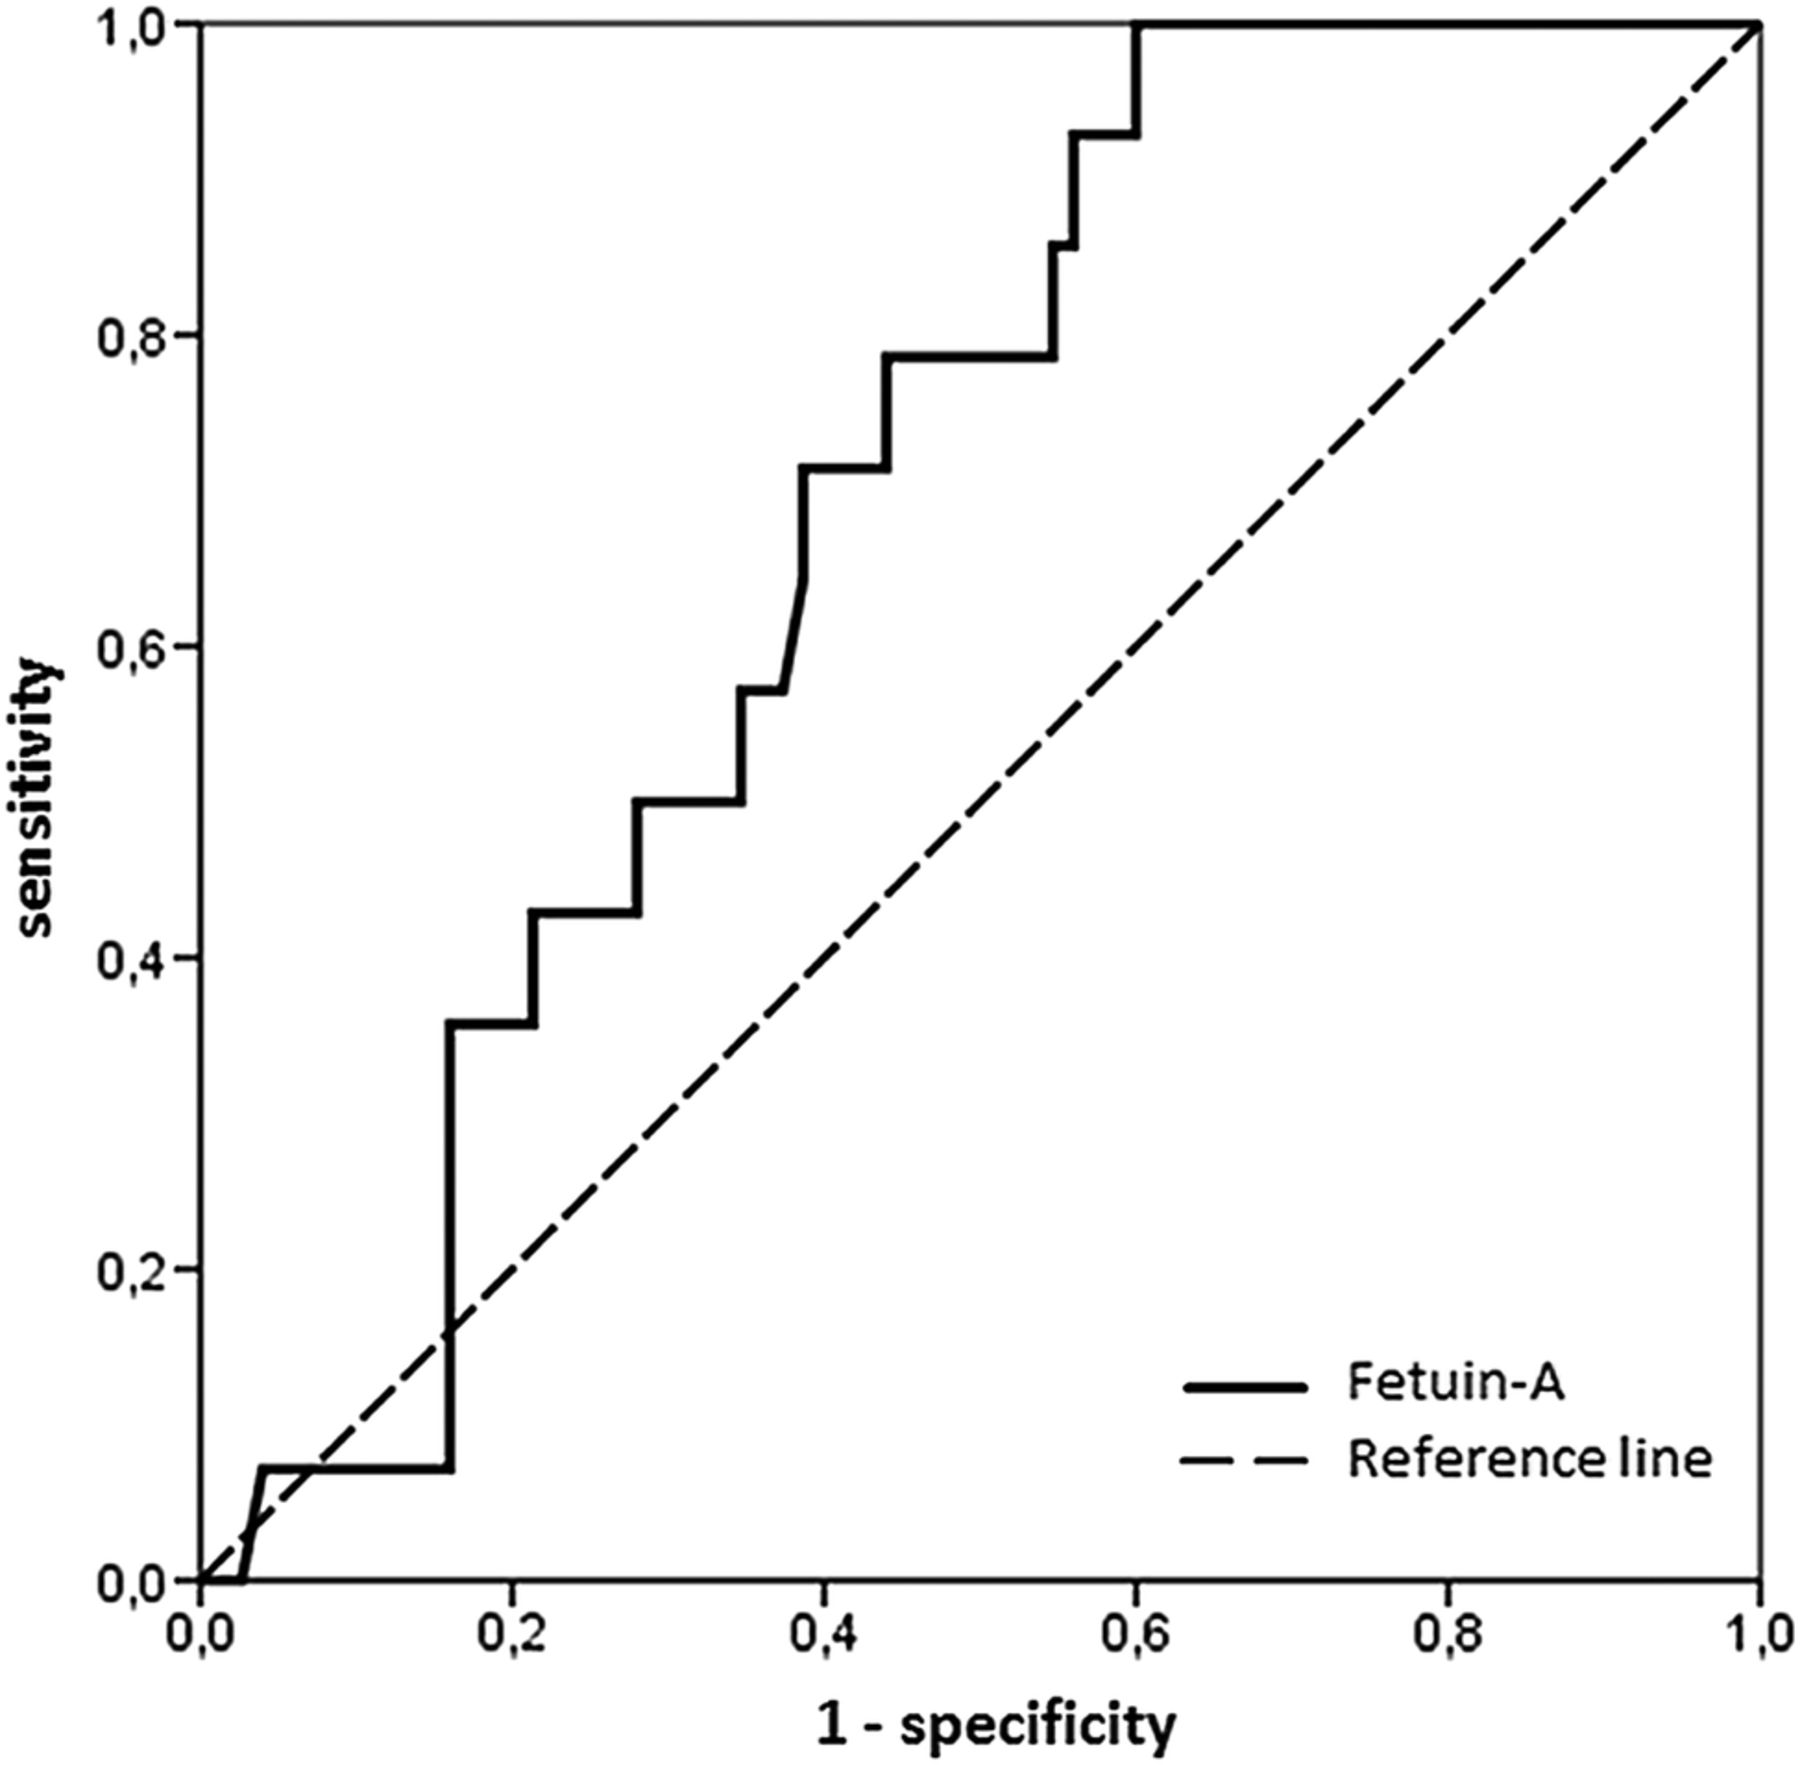
Analysis of receiver operating characteristic of fetuin-A. The area under the curve of fetuin-A (0.68, 95% CI 0.56 to 0.80) with the optimal cut-off value of 544 µg/mL provided 71% sensitivity and 61% specificity for the prediction of adverse left ventricular remodelling at 4 months. The corresponding negative and positive predictive values were 92% and 26%.
Analysis of receiver operating characteristic of three models (model 1: cardiac troponin T (cTnT), N-terminal pro brain natriuretic peptide (NT-proBNP), C reactive protein (CRP) (dotted line); model 2: cTnT, NT-proBNP, CRP and fetuin-A (continuous line); model 3: cTnT, NT-proBNP and CRP/fetuin-A-ratio (broken line)) for prediction of adverse left ventricular remodelling at 4 months. Model 2 (area under the curve=0.812, 95% CI 0.712 to 0.911) resulted in a higher prognostic value for the prediction of adverse remodelling compared with model 1 (area under the curve=0.736, 95% CI 0.609 to 0.863) and model 3 (area under the curve=0.735, 95% CI 0.609 to 0.861).
Discussion
The main findings of the present study are as follows: fetuin-A levels measured 2 days after acute STEMI are associated with acute and chronic infarct size as well as LVEF as assessed by CMR. Moreover, fetuin-A predicts the development of LV remodelling post-STEMI.
Myocardial necrosis is followed by inflammation,1 which is a trigger for cardiac remodelling and subsequent development of heart failure.26 Low levels of anti-inflammatory mediators were related to poor prognosis after acute myocardial infarction.27 Fetuin-A is an anti-inflammatory glycoprotein and its plasma concentrations decrease during inflammatory processes.7 Fetuin-A levels are lower in patients with STEMI compared with healthy controls and decrease over the first 3 days after symptom onset.15 ,16 We showed that plasma fetuin-A concentrations measured 4 months after infarction were significantly lower compared with baseline values. This finding might suggest that plasma fetuin-A concentrations decrease beyond the first few days after the acute event. As shown by Cubedo et al,16 the decline in serum fetuin-A levels early after acute STEMI is correlated with the degree of myocardial necrosis. In this study, baseline but not 4-month fetuin-A concentrations were associated with acute and chronic infarct size. These findings indicate that the decrease of plasma fetuin-A levels within the first few days after infarction as well as single time point fetuin-A concentrations at baseline might be useful to predict infarct size.7 ,13 In this study, baseline and 4-month fetuin-A levels did not differ significantly between patients presenting with 1-vessel, 2-vessel and 3-vessel disease. Anyhow, low fetuin-A levels have been shown to be associated with a higher severity of CAD in a community-dwelling population.11 We speculate that the impact of stable CAD on fetuin-A levels might be masked following myocardial infarction. This is possibly due to a prolonged inflammatory response within the myocardium, which depresses plasma fetuin-A concentrations.
The decrease in fetuin-A levels is accompanied by the aggravated synthesis of proinflammatory cytokines, which depress ventricular function and promote remodelling.2 ,3 For the first time, we report in this study a significant correlation between 2-day fetuin-A levels and CMR-derived LVEF in the acute and chronic settings after STEMI. This is in line with data previously published by Lim et al15 who utilised echocardiography and ventriculography for the assessment of LV function, volumes and morphology, which are less-accurate imaging modalities than CMR.28
Besides the adverse effect on LV function, inflammatory processes promoting calcification and fibrosis also trigger subsequent dilation of the left ventricle.2 ,3 In this study, low fetuin-A levels were associated with 4-month EDVI. Moreover, fetuin-A concentrations were independently associated with the increase in EDVI during follow-up. Fetuin-A was independently related to the occurrence of adverse LV remodelling, even after correction for traditional laboratory and CMR-derived determinants of cardiac remodelling.29 According to ROC analyses, adding fetuin-A to a model including maximum cTnT, NT-proBNP and CRP concentrations resulted in a higher area under the curve for the prediction of adverse LV remodelling. These findings are in agreement with those of Merx et al13 who reported that low levels of fetuin-A negatively affect cardiac structure and function in a murine model of myocardial ischaemia. Nevertheless, larger studies with a longer period of follow-up should be performed to confirm our findings.
Study limitations
This study has some important limitations. Although patients with STEMI were screened consecutively, only haemodynamically stable patients with a first coronary event and preserved renal function were included. These facts resulted in a homogeneous study cohort with a moderate infarct size and a relatively preserved LVEF. Anyhow, the baseline characteristics of our study population are comparable to large multicentre trials (median LVEF 51%), which also exhibited a similar ischaemia time.30 Second, in this study, only single time point fetuin-A levels were measured at baseline. Therefore, the optimal time point for fetuin-A measurement with the highest prognostic value for the prediction of LV remodelling remains unknown. Future studies performing serial measurements of fetuin-A over the first 2 days after symptom onset are needed to determine the optimal time point for measurement of this biomarker. Moreover, the remodelling group was too small to draw robust conclusions. Accordingly, our findings should be confirmed in larger studies. Although higher fetuin-A plasma levels have been described in females compared with males,31 this study was not powered to point out any gender-related differences. Another limitation is that data on staged revascularisation of the non-infarct-related artery could not be assessed for all patients, primarily due to non-in-house procedures.
Conclusion
The anti-inflammatory glycoprotein fetuin-A might be involved in myocardial healing after acute myocardial infarction. For the first time, this study links 2-day fetuin-A concentrations to CMR-derived infarct size, LV function and morphology in the acute and chronic stage after STEMI. Moreover, fetuin-A might be of additional prognostic value in the prediction of adverse LV remodelling, which should be confirmed in larger studies.
Acknowledgments
The authors thank Ursula Stanzl for valuable technical assistance.
References
Footnotes
Contributors H-JF contributed in the analysis and interpretation of the data; and in the idea, design and drafting of the manuscript. GK contributed in the analysis and interpretation of the data; and in the design, drafting and critical revision of the manuscript for important intellectual content. SJR contributed in the design, drafting and critical revision of the manuscript for important intellectual content. M-TG and RK contributed in the analysis of the data; and in the critical revision of the manuscript for important intellectual content. JM and W-MF contributed in the interpretation of the data; and in the critical revision of the manuscript for important intellectual content. BH contributed in the analysis and interpretation of the data; and in the critical revision of the manuscript for important intellectual content. W-MF contributed in the interpretation of the data; and in the critical revision of the manuscript for important intellectual content. BM contributed in the interpretation of the data; and in the design and critical revision of the manuscript for important intellectual content; and also gave final approval of the manuscript submitted.
Funding This study was supported by grants from the Austrian Society of Cardiology to GK, SJR and BM and by the intramural funding programme of the Medical University of Innsbruck for young scientists, MUI-START, project 2013042016 to GK.
Competing interests None declared.
Patient consent Obtained.
Ethics approval Local ethics committee of the Medical University of Innsbruck.
Provenance and peer review Not commissioned; externally peer reviewed.
Data sharing statement No additional data are available.