Article Text

Abstract
Background: This study aims to project the prevalence of adult obesity to 2012 by age groups and social class, by extrapolating the prevalence trends from 1993 to 2004. Repeated cross-sectional surveys were carried out of representative samples of the general population living in households in England conducted annually (1993 to 2004).
Methods: Participants were classified as obese if their body mass index was over 30 kg/m2. Projections of obesity prevalence by 2012 were based on three scenarios: extrapolation of linear trend in prevalence from 1993 to 2004; acceleration (or slowing down) in rate of change based on the best fitting curve (power or exponential); and extrapolation of linear trend based on the six most recent years (1999 to 2004).
Results: The prevalence of obesity increased significantly from 1993 to 2004 from 13.6% to 24.0% among men and from 16.9% to 24.4% among women. If obesity prevalence continues to increase at the same rate, it is projected that the prevalence of obesity in 2012 will be 32.1% (95% CI 30.4 to 34.8) in men and 31.0% (95% CI 29.0 to 33.1) in women. The projected 2012 prevalence for adults in manual social classes is higher (43%) than for adults in non-manual social classes (35%).
Conclusion: If recent trends in adult obesity continue, about a third of all adults (almost 13 million individuals) would be obese by 2012. Of these, around 43% are from manual social classes, thereby adding to the public health burden of obesity-related illnesses. This highlights the need for public health action to halt or reverse current trends and narrow social class inequalities in health.
Statistics from Altmetric.com
Obesity is a major public health problem that can lead to premature death1 because of its association with serious chronic conditions, such as type 2 diabetes, hypertension and cancer.2 3 In England alone, obesity was directly responsible for over 9000 premature deaths a year at the beginning of this decade,4 a figure that may have risen considerably as a result of increases in obesity prevalence since then.5 Besides the human costs in terms of disease, premature death and quality of life, obesity has severe economic consequences, costing the English economy directly at least £6.6–7.4bn per annum (2002 figures unadjusted for inflation).6 Other countries around the world will suffer similar consequences as there are compelling data showing that the prevalence of obesity is increasing rapidly in both developed and developing countries.7
Age and socioeconomic circumstances are associated with increased risk of excess weight. In general, obesity rates are higher in older age groups, peaking in middle-age for men and in late life for women.5 A socioeconomic gradient of obesity in Western countries is evident in women but not in men: women from lower socioeconomic strata have higher rates of obesity than women from higher strata.8 However, we have no information about whether obesity increases at different rates between age, sex and socioeconomic status groups of the population. Examining the recent prevalence trends and projecting the extent of the problem in the years to come will inform obesity prevention policies and interventions and will highlight the social class and age subgroups that may need to be given priority in preventive policies.
The aim of this study is to provide an update of the current state and time trends of obesity prevalence in England between 1993 and 2004 by age group and social class and to project the extent of the problem to year 2012 using the existing time trends for each population group as a guide. To achieve these aims, we used a number of large, nationally representative datasets of adults living in households in England, participants in the Health Survey for England.
METHODS
Study population
The Health Survey for England (HSE) draws annually a nationally representative sample of the general population using multistage stratified probability sampling, with postcode sectors as primary sampling units and the Postcode Address File as the sampling frame for households. In this study, we used data from 1993–2004 surveys.9–20 Individual response rates for adults varied between 76% (1993) and 66% (2004), depending on the survey year. The HSE has a series of core elements that are included every year (adults aged 16 and over living in private households) and special topics that are included in selected years. In those years in which the survey focused on specific demographic groups (such as in 1997, 1999, 2000, 2002 and 2004), the sample of the general population was reduced.13 15 18 20
Measurements
Weight and height were measured by trained interviewers using electronic digital scales (Tanita Corporation, Tokyo, Japan) and Chasmors stadiometers (Chasmors Ltd, London, UK). Body mass index (BMI) is the most commonly used index of obesity; it is calculated as weight (kg) divided by squared height (m2). Informants were classified as obese if BMI exceeded 30.0 kg/m2. HSE participants who weighed more than the upper limit of the scales (130 kg), who were asked to estimate their weight, were excluded from these analyses. In total, 127 876 adults aged 19 and over with a valid BMI were included.
The occupation of the respondents was used to determine their socioeconomic status; this information was available from 1994 onwards. We used the Registrar-General’s classification to classify the sample into manual and non-manual social classes.21
Statistical analysis
The prevalence of obesity for the period 1993–2004 was calculated for each year separately, by sex, age group and social class. Age standardisation has been used for all figures in which age is not included as a break variable, namely by sex and social class with the standards being the age distribution of the 2004 population. A linear trend was fitted to the prevalence data (x1, x2,…,x11) for the time period 1993–2004. The value of the series was then projected p years ahead, where p = 8 (corresponding to the year 2012) by extrapolating a linear trend. For all projected rates, we have also calculated the 95% prediction intervals as y ± (tn–2 * standard error).
The standard error is given by:

The assumption underlying the linear projections is that the time trends over the examined period will continue unchanged. An alternative set of projections was also made to allow for acceleration or slowing down in the rate of change in the prevalence of obesity. For this set of projections, power (of form xt =  where t = year–1992) and exponential curves (of form xt =
  ) were fitted to the data. For presentation in the graphs, the best fitting curve between power and exponential was chosen based on the R2. Finally, a third set of projections was made based on extrapolating trends in more recent years, 1999–2004. The three scenarios are summarised in Box 1.
The prevalence of obesity in 2004 and the projections for 2012 were applied to the 2004 mid-year population estimates for England22 and the 2006-based projected population for 2012.23 The projected numbers of the population are available by age groups, but not by social class. Therefore, to obtain the projected numbers of the population by social class for 2012, we have applied the prevalence of men and women by social class in 2004 (53.0% non-manual men, 47.0% manual men; 66.7% non-manual women, 33.3% manual women) to the projected population in 2012, assuming that these will not change in 2012.
All analyses were run using the SPSS statistical package, version 13.
Scenario 1
These projections are based on the linear trend observed in 1993 to 2004 and assume that the rate of increase will remain constant until 2012.
Scenario 2
These projections are based on the best fitting curve exponential or power to allow for acceleration or decrease in rates of change of obesity.
Scenario 3
These projections are based on the linear trends observed in the six most recent years (1999 to 2004).
Statement of ethics
We certify that all applicable institutional and governmental regulations concerning the ethical use of human participants were followed during this research. Each year’s survey was approved by the appropriate research ethics committee.
RESULTS
Table 1 presents the obesity prevalence rates among men by age group, from 1993 to 2004, as well as the annual percentage change in obesity prevalence. Overall, among men, the prevalence of obesity increased from 13.6% in 1993 to 24.0% in 2004 (p<0.001). Significant increases in obesity prevalence rates were found from 1993 to 2004 for men in all age groups. However, higher rates of obesity were found in those aged 35–54 and 55–74 from 1993 onwards. The overall prevalence of obesity among women increased from 16.9% in 1993 to 24.4% in 2004 (p<0.001). Similarly to men, women also had significant increases in obesity prevalence rates from 1993 to 2004 in all age groups. The highest prevalence of obesity rates was among women aged 35–54 and among women aged 55–74 from 1993 onwards (table 2). Among those aged 75 and over, women reported higher rates of obesity than men (p<0.01) for each year from 1993 onwards. Similarly, among those aged 55–74, women had higher rates than men in each year (except 2002 and 2004, when differences between the sexes were not significant). In the youngest age group, women had higher rates of obesity than men from 1993 to 1998, and from 2001 to 2003. With only one exception (the year 2000), the prevalence of obesity was higher in women (p<0.001) (tables 1 and 2).
Table 3 reports the projected rates to 2012, based on linear and non-linear trends. The projected rate of obesity (based on linear trends) for men aged 35–54 is 35.1% (95% CI 33.0 to 37.1) compared with 40.9% in the worst scenario (based on exponential trends) and 28.0% in the optimistic scenario (based on power trends). Even more serious will be the situation of those aged 55–74: the estimated rate of obesity (based on linear trends) for men in 2012 is 36.4% (95% CI 33.0 to 40.0) compared with 40.9% if the trend is exponential and 29.8% in the optimistic scenario. The projected rate of obesity (based on linear trends) for women aged 35–54 is 30.6% (95% CI 27.4 to 33.8) compared with 33.0% in the worst scenario and 25.8% in the more optimistic one. For women in the 55–74 age group, the rate of obesity in 2012 is estimated to be 35.9% (95% CI 31.6 to 40.2) based on linear trends compared with 37.4% in the worst scenario and 32.0% in the optimistic one (table 3).
Figure 1 shows the projected increase rates to 2012 based on three different scenarios. If the time trends continue as they have been between 1993 and 2004, the obesity prevalence in 2012 will be 32.1% (95% CI 30.4 to 34.8) in men and 31.0% (95% CI 29.0 to 33.1) in women. However, with the worst scenario (based on an exponential trend), the prevalence of obesity would be 37.9% (95% CI 34.1 to 42.0) in men and 33.9% (95% CI 30.4 to 37.7) in women. Among men, the exponential curve shows a dramatic increase, although the prevalence rates of obesity in the four most recent years increased steadily. This is because the projection takes into account the rapid increase that occurred between 1993 and 1999.
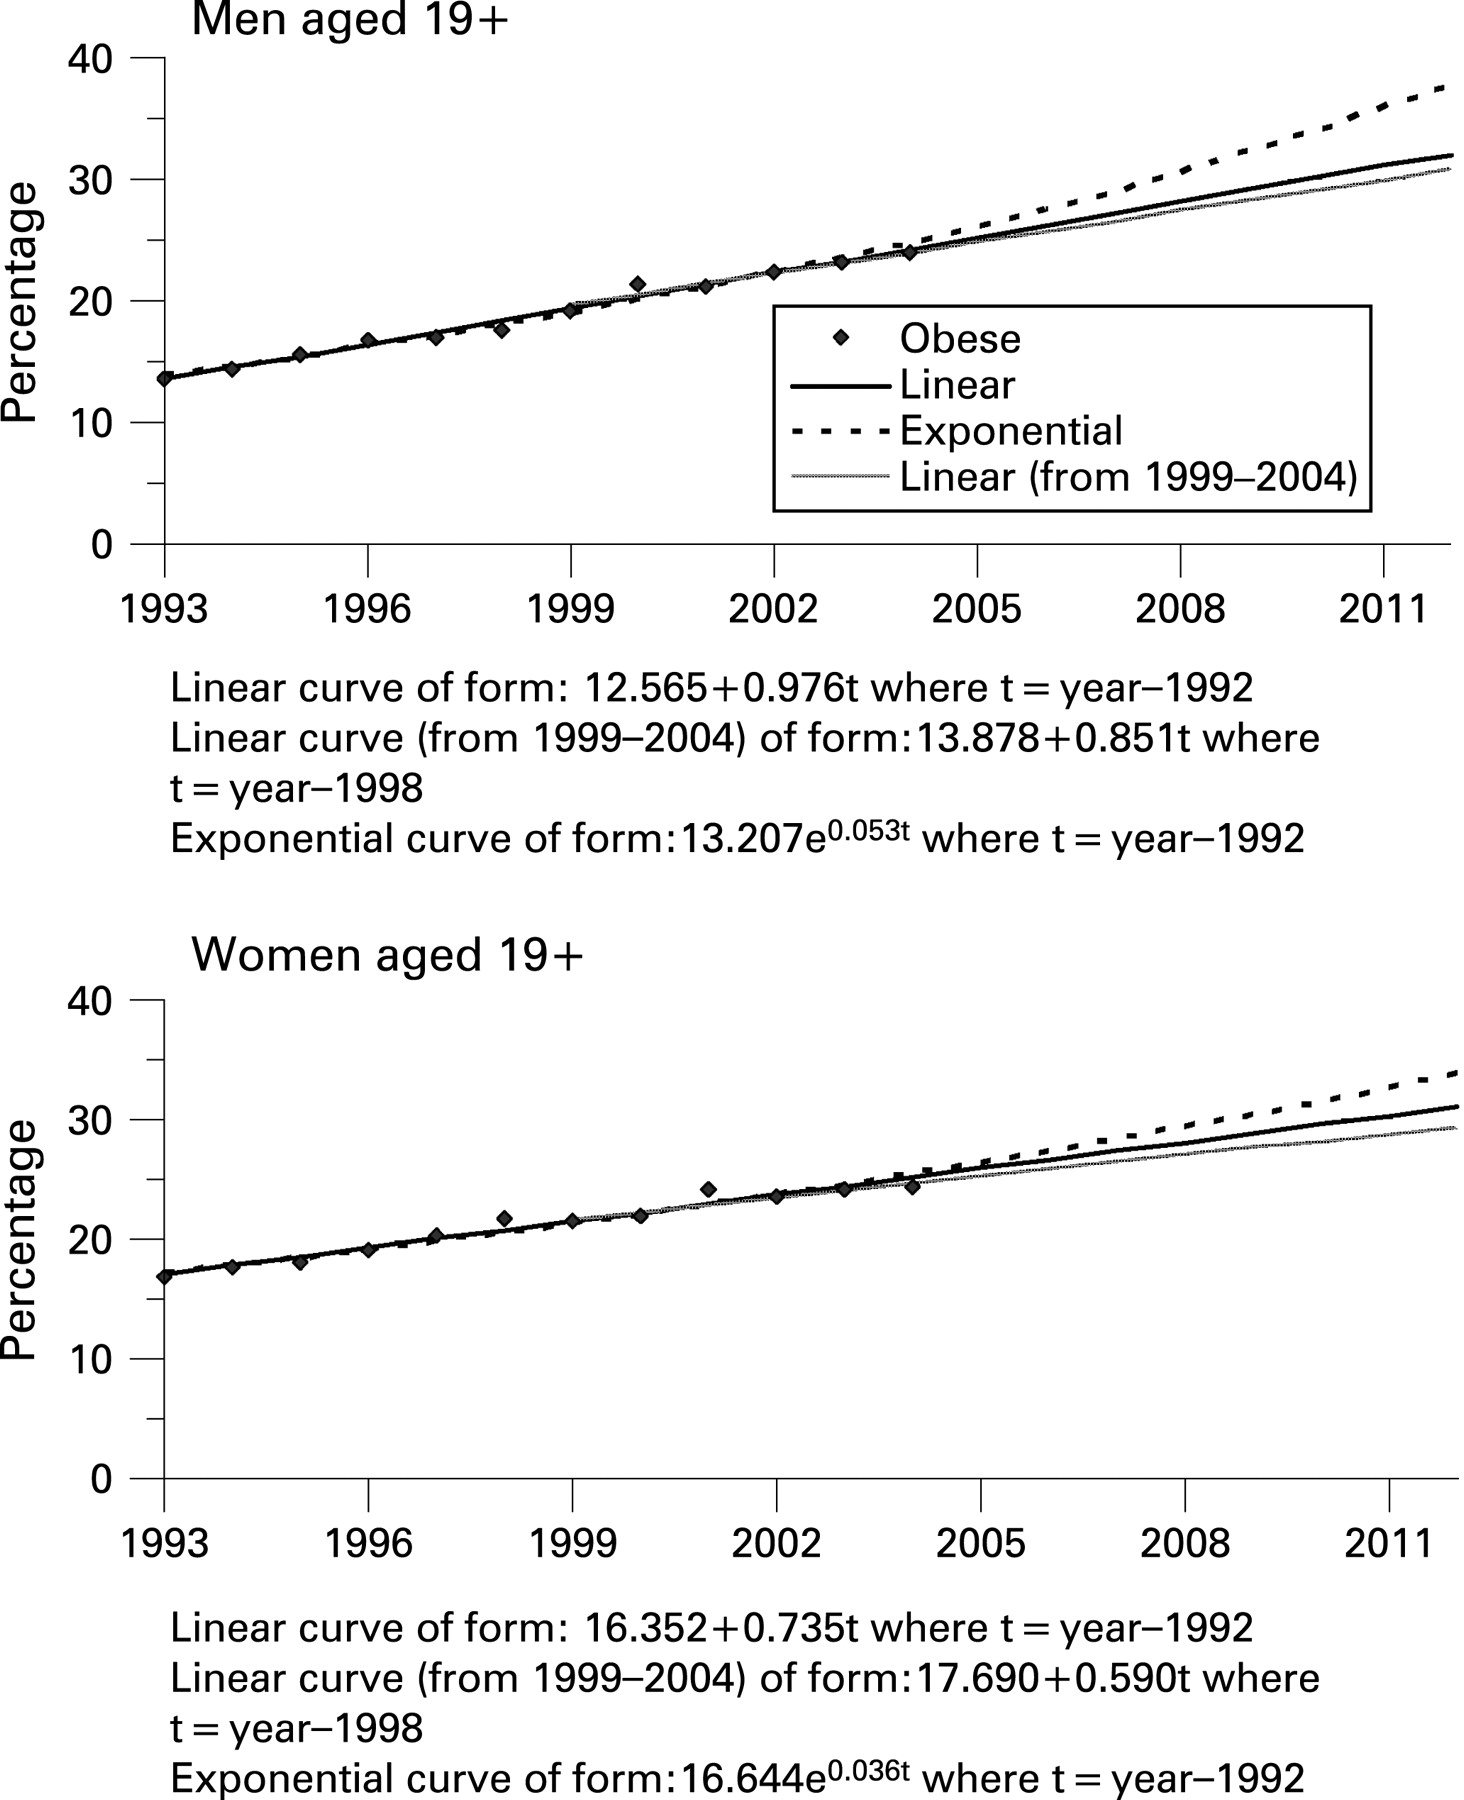
The projected rates to 2012 based on a recent linear trend (1999–2004) were very similar to the projected rates based on the linear trend from 1993 to 2004 for both men and women.
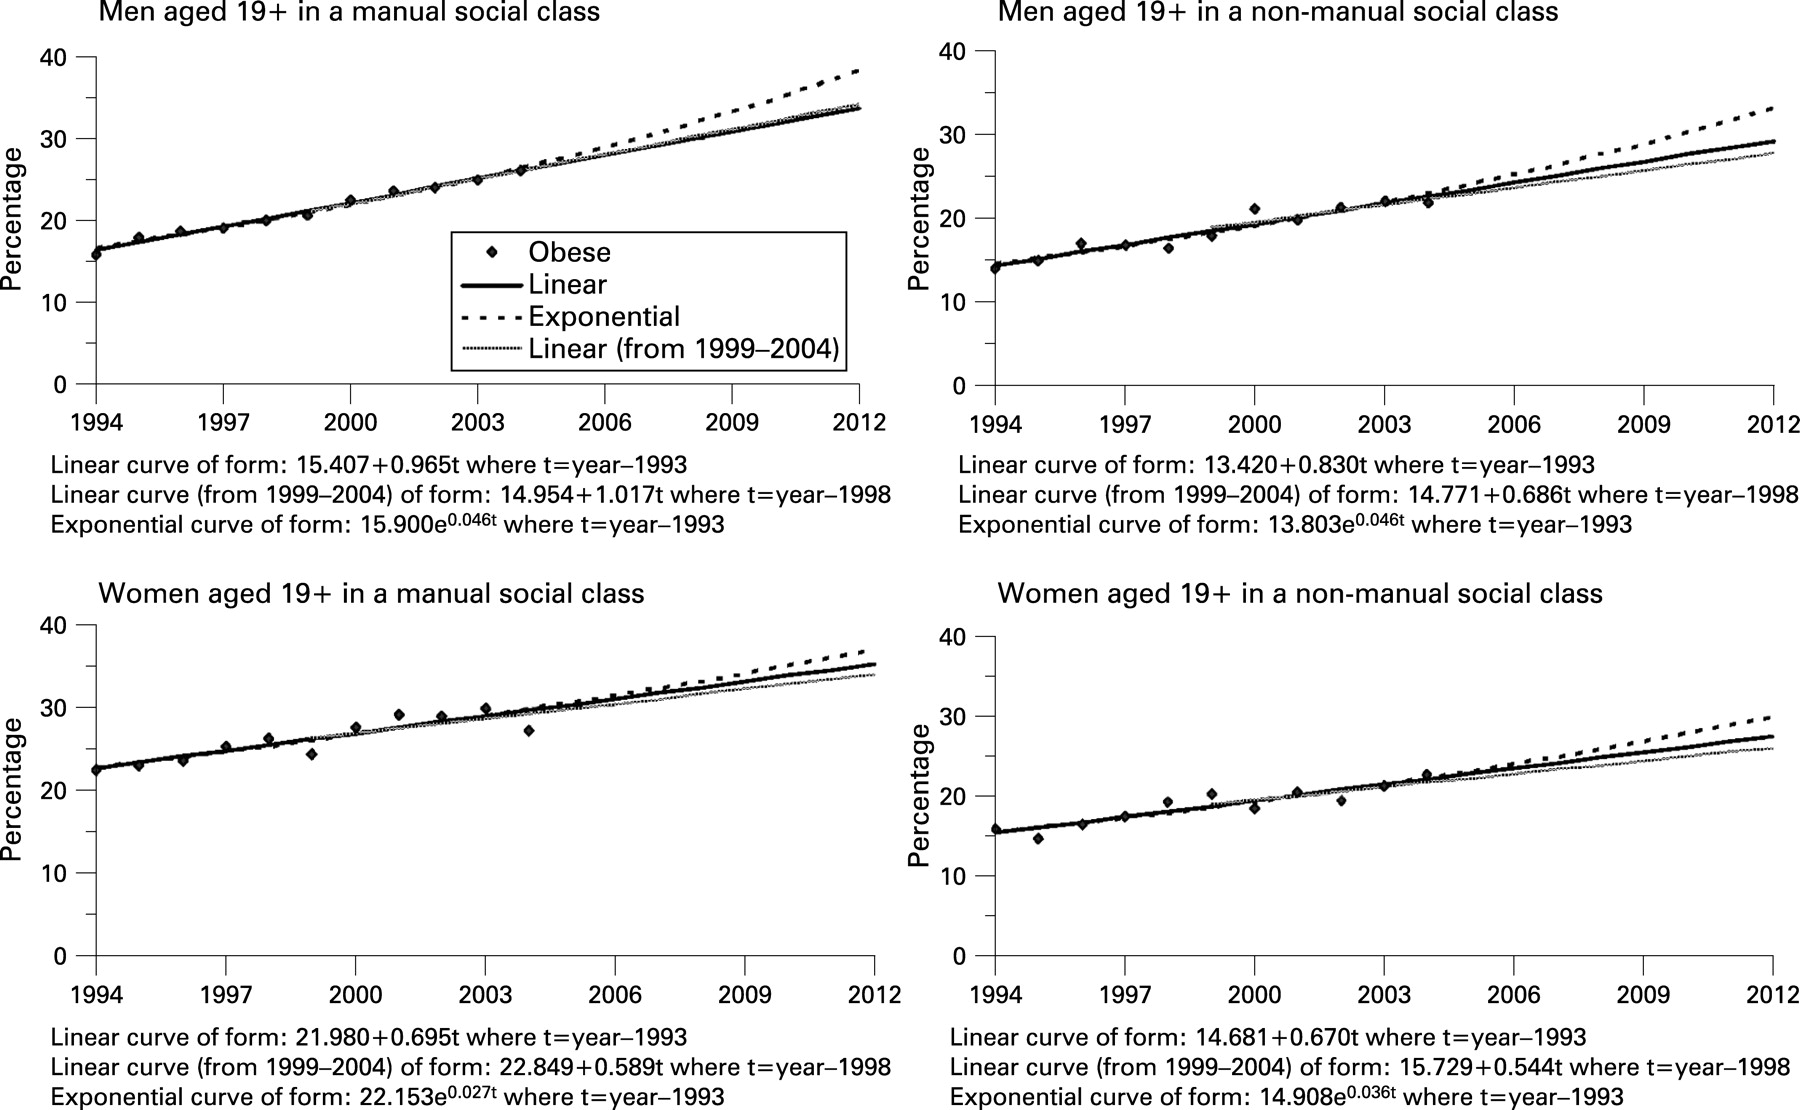
Figure 2 presents the trends, from 1994 to 2004, of obesity prevalence by sex and social class, and the projected rates to 2012. The age-adjusted prevalence of obesity in 1994 was 13.9% among men from non-manual groups compared with 15.9% for manual groups (p<0.05); these rates increased in 2004 to 21.8% for non-manual and 26.1% for manual groups (p⩽0.01). For women in the non-manual social class, the prevalence of obesity was 15.9% in 1994 and 22.5% in 2004 (p<0.001), while for those in a manual social class, the prevalence of obesity was 22.4% in 1994 and 27.2% in 2004 (p<0.001). The differences between obese women in non-manual and manual social classes were statistically significant (p<0.01) in both 1994 and 2004.
In the manual social class, the projected obesity prevalence in 2012 is 33.8% (95% CI 32.1 to 35.4) for men and 35.2% (95% CI 30.5 to 39.9) for women. The linear projections for men in manual social classes, based on more recent years (1999–2004), is slightly higher compared with the linear projections based on trend in 1994–2004 (0.5% higher). For those in non-manual social classes, the projected obesity prevalence in 2012 is 29.2% (95% CI 26.0 to 32.4) for men and 27.4% (95% CI 23.8 to 31.1) for women. The corresponding projected rate based on recent linear trends is 27.8% (95% CI 20.4 to 35.2) for men and 26.1% (95% CI 17.7 to 34.4) for women. If the trend is assumed to be exponential, obesity prevalence in 2012 for manual men will increase to 38.2% and will exceed the rate among women (36.9%); in the non-manual groups, prevalence will be 33.1% for men and 29.8% for women.
Applying the prevalence figures above to the relevant population estimates or projections, there were approximately 4.5 million obese men and 4.8 million obese women in England in 2004. If the linear trend occurs, we predict that these figures are likely to rise to 6.5 million in each sex in 2012 (table 4). Among those, 3.2 million men and 2.5 million women will be from manual social classes.
DISCUSSION
There has been a marked increase in the prevalence of obesity among adults in England between 1993 and 2004. The prevalence of obesity has increased across all age groups; however, the increase is more pronounced in men and women aged 35–74 and in those from manual social classes. If the linear trend is extrapolated, our projections show that overall around 31% of the population would be obese in 2012. For men and women in manual social classes, the rates of obesity are projected to rise to 33.8% in men and 35.2% in women in 2012. Applying these projected rates of obesity to the projected population in 2012, we estimate that almost 13 million individuals will be obese by 2012: of these, nearly 6 million are from manual social classes. Among women, the projected number of obese will be higher in the non-manual social class compared with the manual, although the prevalence rate was predicted to be higher in the manual social class. This is because in 2004 there were twice as many women in non-manual as in manual occupations.
The method used to project the future prevalence of obesity makes assumptions about future changes in obesity based on past patterns of change. Projections were based on extrapolating linear trends in the prevalence of obesity between 1993 and 2004. Two alternative models, based on fitting power and exponential curves, were selected as plausible alternative models that would allow for either acceleration or slowing down in changes in the prevalence of obesity. In both men and women, the exponential curve provided a better fit to the data than the power curve, suggesting that rates of change in obesity prevalence have been accelerating. If extrapolations are based on the exponential curve, then the prevalence of obesity in men and women could be as high as 38% and 34%, respectively, by 2012.
Although the prevalence of obesity was greater in men and in women from manual social classes than in those from non-manual classes throughout the period 1994–2004, the rate of increase was very similar in both manual and non-manual groups. The only exception was the linear trend for men based on the more recent years (1999–2004), where the rate was almost twice as great in manual as in non-manual classes.
A limitation of the work presented here is that we did not take into account the sampling differences in HSE participants from year to year regarding sociodemographic composition or lifestyle behaviours that affect obesity. HSE is a large survey, designed to be nationally representative, so considerable differences in the sociodemographic make-up of those selected should be minimal over time, although the accuracy of stratification by proportion of non-manual households prior to selecting the sample is affected by time since the last Census. This would not have affected the results shown by social class. However, we acknowledge that the decline in response rates in recent years (from 74% in 1993 to 66% in 2004) may have introduced respondent bias in more recent years, for example if people refusing to take part in the survey (non-respondents) are more likely to be obese than respondents. This is possible as people from lower social classes are more likely to be both non-responders in survey research24 25 and obese.8 In other words, decline in response rates may have resulted in an actual underestimate of obesity rates in the recent years and subsequently in our projected rates, making these more conservative. Similarly, exclusion of respondents who weighed more than 130 kg will have underestimated the prevalence of obesity.
Differences in behaviour over time are major drivers of obesity, so changes in prevalence of, for example, physical activity in different survey years are not appropriate to adjust for in these projections.
To our knowledge, few other studies have attempted to project future levels of obesity among English adults, despite the potential usefulness of such data for policy-makers and health service providers. Indeed, projecting future levels of health risk factors in general seems to be relatively little used in health research. More has been done on projecting future levels of mortality and morbidity.26–29 The methods used in those studies have usually been based on the application of multivariable risk prediction models to the prevalence of known risk factors for disease, such as smoking and hypertension, to estimate likely future incidence of disease rather than extrapolation of existing trends in disease rates. Increasing prevalence based on extrapolating linear trends in the prevalence of obesity was used as one scenario in a model developed to project the prevalence of diabetes in 2010.30 The authors of this diabetes prevalence model justified their use of linear extrapolation of trends in obesity by referring to American evidence showing that obesity levels similar to those prevalent in 2003 in England were reached 9 and 13.5 years previously for American men and women and that, since then, trends in obesity in the United States had continued to rise linearly.
Predicting future levels of obesity is more difficult than predicting future levels of chronic disease, as any changes in contributing factors, such as a change in diet or levels of physical activity, are likely to have quite immediate effects on obesity. In this study, we have not attempted to take account of any trends in underlying risk factors for obesity or current or planned interventions, whether at the individual or the population level, but have simply based our projections on recent trends. It could be argued that it is an impossible task to provide an accurate forecast of future levels of obesity, given that levels can depend so much on short-term influences. However, the purpose of our projections is not so much to provide an accurate forecast of future levels, but to predict what might happen if the trends observed in recent years were to continue.
CONCLUSIONS
The prevalence of obesity has been rising over the past decade. If trends continue as they have done between 1993 and 2004, in 2012, the number and prevalence of obese people is projected to increase dramatically, and these increases will affect lower social classes to a larger extent. Thus, it is essential to implement effective strategies for the management and prevention of obesity and the reduction of social class inequalities in health.
What is already known on this subject
Obesity has been increasing at very fast rates in England in the past 12 years in men and women aged 19 years and over.
What this study adds
If recent trends in adult obesity continue, about a third of all adults will be obese by 2012. The projected 2012 prevalence will be higher for adults in manual social classes than for adults in non-manual social classes.
Policy implication
Action is needed to implement effective strategies for the management and prevention of obesity to halt or reverse current trends and narrow social class inequalities in health.
Acknowledgments
We thank the staff of the Joint Health Surveys Unit of NatCen and UCL, the interviewers and the participants in the Health Surveys for England. This research was supported by the Department of Health. The views presented in this paper are those of the authors, not the funders.
REFERENCES
Footnotes
Funding: Supported by the Department of Health.
Competing interests: None declared.
Ethics approval: All applicable institutional and governmental regulations concerning the ethical use of human participants were followed during this research. Each year’s survey was approved by the appropriate research ethics committee.